QDPL - KNG: Enhancing Dividend Aristocrat Yields With Covered Calls
2023-10-13 17:27:35 ET
Summary
- First Trust Cboe Vest S&P 500 Dividend Aristocrats Target Income ETF implements a buy-write strategy with dividend aristocrats.
- It is well-diversified across sectors and holdings.
- KNG outperforms other S&P 500 buy-write ETFs since 2018, but lags behind JEPI and FTHI in the last 3 years.
- The variable distribution yield of buy-write ETFs may not suit investors seeking a predictable income stream.
This article series aims at evaluating ETFs (exchange-traded funds) regarding the relative past performance of their strategies and metrics of their current portfolios. Reviews with updated data are posted when necessary.
KNG strategy and portfolio
FT Cboe Vest S&P 500® Dividend Aristocrats Target Income ETF ( KNG ) was listed on 3/26/2018 and tracks the Cboe S&P 500 Dividend Aristocrats Target Income Index. It generates income by holding dividend stocks and selling covered call options on these stocks. KNG has 67 stock holdings, 66 positions in options, a trailing 12-month distribution yield of 5.03% and a total expense ratio of 0.75%.
As described by First Trust ,
The Index is composed of two parts: (1) an equal-weighted portfolio of the stocks contained in the S&P 500 Dividend Aristocrats Index (the “Aristocrat Stocks”) that have options that trade on a national securities exchange and (2) a rolling series of short (written) call options on each of the Aristocrat Stocks (the “Covered Calls”). The S&P 500 Dividend Aristocrats Index generally includes companies in the S&P 500 Index that have increased dividend payments each year for at least 25 consecutive years and meet certain market capitalization and liquidity requirements.
The fund invests exclusively in a subset of the S&P 500 index. The stock portfolio is reconstituted annually and rebalanced quarterly. Covered calls are written each month to expire the following month at a strike price close to the last daily closing price, on no more than 20% of the position in each stock.
Unlike ETFs whose yields are only based on the distributions of securities held in their portfolios, KNG distribution yield has an unpredictable part. It depends on market conditions being favorable or not to a buy-write strategy, and on the execution of such a strategy.
The top 2 sectors are consumer staples (24% of asset value) and industrials (22.6%). Other sectors weigh no more than 12%. Compared to the S&P 500 (SPY), the fund massively overweights these two sectors, along with materials, and to a lesser extent utilities and real estate. It underweights mostly technology, consumer discretionary, and ignores communication services.
Sector breakdown (Chart: author; data: First Trust, SSGA)
Stocks are in equal weight after every rebalancing, but positions may drift with price action. The current top 10 holdings, listed in the next table with fundamental ratios, represent 17.4% of asset value. These are the constituents with the highest price return since the last rebalancing date. As of writing, all positions are below 2%, so risks related to individual companies are low.
| Ticker |
| Name |
| Weight% |
| EPS growth %TTM |
| P/E TTM |
| P/E fwd |
| Yield% |
| General Dynamics Corp. |
| 1.85% |
| 3.15 |
| 19.48 |
| 18.77 |
| 2.22 |
| Aflac Incorporated |
| 1.83% |
| 12.66 |
| 10.69 |
| 13.19 |
| 2.10 |
| AbbVie Inc. |
| 1.73% |
| -31.10 |
| 30.46 |
| 13.39 |
| 3.99 |
| Chubb Ltd. |
| 1.73% |
| -16.01 |
| 15.04 |
| 11.23 |
| 1.64 |
| Automatic Data Processing, Inc. |
| 1.72% |
| 17.19 |
| 30.17 |
| 27.09 |
| 2.02 |
| Caterpillar Inc. |
| 1.72% |
| 28.61 |
| 16.77 |
| 13.50 |
| 1.93 |
| Emerson Electric Co. |
| 1.72% |
| -105.42 |
| N/A |
| 21.55 |
| 2.17 |
| West Pharmaceutical Services, Inc. |
| 1.71% |
| -23.90 |
| 56.10 |
| 49.06 |
| 0.20 |
| International Business Machines Corp. |
| 1.69% |
| -64.96 |
| 65.50 |
| 14.75 |
| 4.70 |
| Roper Technologies, Inc. |
| 1.69% |
| 12.89 |
| 43.01 |
| 30.43 |
| 0.54 |
Historical performance
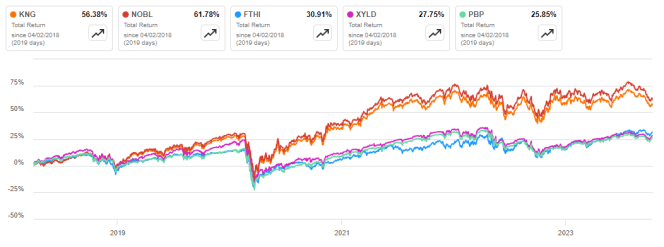
I will use as a benchmark the S&P 500 Dividend Aristocrats Index, represented hereafter by ProShares S&P 500 Dividend Aristocrats ETF ( NOBL ). The next chart compares total returns since inception of KNG, NOBL, and three ETFs generating income with covered call strategies in the S&P 500 (SP500) universe:
- First Trust BuyWrite Income ETF ( FTHI ), reviewed here ,
- Global X S&P 500 Covered Call ETF ( XYLD ),
- Invesco S&P 500 BuyWrite ETF ( PBP ),
KNG vs NOBL and competitors (Seeking Alpha)
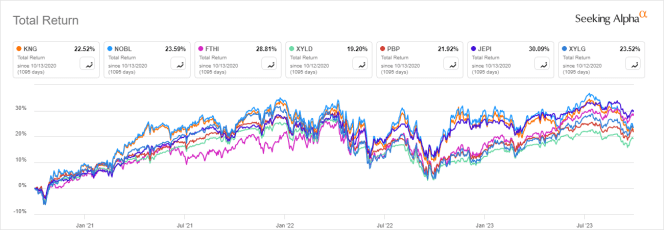
KNG is the best performer among buy-write S&P 500 ETFs, but it is shortly behind the plain vanilla dividend aristocrats fund. The next chart reports a shorter period of 3 years and adds two newer funds:
KNG vs NOBL and competitors, 3 years (Seeking Alpha)
KNG is in the middle of the pack on this shorter time frame. JEPI is leading, closely followed by FTHI.
Scanning the portfolio
The price/earnings and price/book ratios are close to S&P 500’s values. KNG is cheaper regarding price/sales and to a lesser extent in price/cash flow (see next table).
| KNG |
| SPY |
| Price / Earnings TTM |
| 21.08 |
| 21.48 |
| Price / Book |
| 3.43 |
| 3.81 |
| Price / Sales |
| 1.43 |
| 2.44 |
| Price / Cash Flow |
| 14.28 |
| 15.07 |
In previous articles, I have shown how three factors may help cut the risk in a dividend portfolio: Return on Assets , Piotroski F-score , Altman Z-score . My core portfolio holds 14 stocks selected using these metrics (more info at the end of this post). I have scanned KNG holdings with these quality metrics. I consider that risky stocks are companies with at least 2 red flags among: bad Piotroski score, negative ROA, unsustainable payout ratio, bad or dubious Altman Z-score, excluding financials and real estate where these metrics are unreliable. With these assumptions, only 6 stocks in KNG portfolio are risky and they weigh 6.7% of asset value, which is a good point.
Based on my calculation reported in the next table, aggregate quality metrics are a bit superior to the large cap benchmark S&P 500.
| KNG |
| SPY |
| Altman Z-score |
| 4.16 |
| 3.45 |
| Piotroski F-score |
| 5.9 |
| 5.64 |
| ROA % TTM |
| 7.51 |
| 7.1 |
Takeaway
First Trust Cboe Vest S&P 500 Dividend Aristocrats Target Income ETF implements a buy-write strategy in a subset of the S&P 500 index. It holds stocks of dividend aristocrats and sells covered calls on a maximum of 20% of each stock position. Constituents are rebalanced in equal weight on a quarterly basis. Compared to the S&P 500 Dividend Aristocrats Index, this strategy improves the dividend yield, but it has deteriorated the total return since the fund’s inception. KNG has beaten other S&P 500 buy-write ETFs since 2018, but it is significantly behind JEPI and FTHI in the last 3 years.
The main inconvenience of buy-write ETFs is distribution variability. Investors looking for a stable and predictable income stream enhanced with derivatives may be more interested in Pacer Metaurus US Large Cap Dividend Multiplier 400 ETF ( QDPL ), reviewed here .
For further details see:
KNG: Enhancing Dividend Aristocrat Yields With Covered Calls