LRLCF - L'Oréal Vs. Estée Lauder: The Better Pick Will Surprise You
Summary
- In today's article, I will compare U.S.-based cosmetics and personal care company Estée Lauder with its larger and more diversified competitor from Europe - L'Oréal.
- In addition to an overview of the companies, I discuss past growth and future expectations, dividend track records, and investment risks, including the ownership structure of the companies.
- Both Estée Lauder and L'Oréal are very profitable, but in several respects, one outperforms the other.
- Their balance sheets are both of very high quality. L'Oréal's financing structure illustrates the anomalies of the zero-interest rate environment in the Eurozone over the last decade.
- I will also explain the specifics of L'Oréal's dividend - not only in terms of withholding tax, but also in the context of a loyalty bonus reserved for long-term shareholders.
Introduction
The cosmetics industry is a wonderful sector to invest in - it is largely consolidated and dominated by a few large global companies that own the world-leading brands and work tirelessly to maintain their high standards. The shareholders of such companies can be justifiably envied.
In this article, I will take a close look at the world's two leading "pure-play" cosmetics and personal care companies - L'Oréal ( LRLCY , ADRs; LRLCF , OTC-traded common shares) of France, with 2021 net sales of more than €32 billion, and The Estée Lauder Companies ( EL ) of the U.S., with fiscal 2022 (ended June 30, 2022) net sales of nearly $18 billion. I will take a look at the brand portfolios of the two companies and compare their profitability. I will show which of the two is more conservatively managed and what risks should be considered in one's due diligence. I will also examine the dividend performance and future prospects of the two companies. Finally, I will value the companies from the perspective of earnings and cash flows and close out with a brief conclusion.
Overview Of Estée Lauder and L'Oréal
L'Oréal
The history of L'Oréal dates back to 1907, when Eugène Schueller - a French chemist - developed a hair dye called "Oréale." Over the past 100 years, the company has evolved into the world's largest pure-play cosmetics and personal care company by net sales. L'Oréal has four reporting divisions.
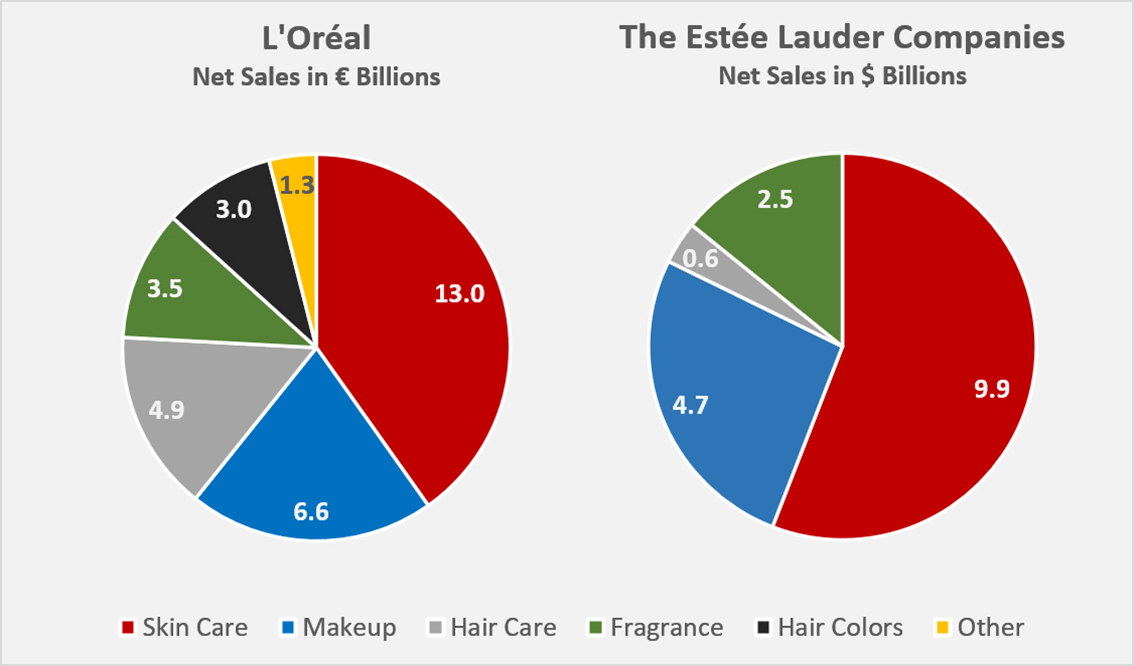
L'Oréal Luxe is the company's largest segment in terms of net sales (38.2% of 2021 net sales) and second in terms of operating profitability (22.8%), closely followed by Consumer Products (37.9% of 2021 net sales). This segment is understandably L'Oréal's weakest in terms of profitability (20.2%). Active Cosmetics and Professional Products each contributed about 12% of the company's 2021 sales, with operating margins of 25.3% and 21.3%, respectively. In Professional Products , the company offers its expertise to professionals such as hair and beauty salons - key brands include Kérastase, Redken and Matrix. Through the Consumer Products division, L'Oréal sells brands such as L'Oréal Paris, Garnier and Maybelline New York. L'Oréal Luxe represents the company's offerings for the most demanding consumers, with brands such as Lancôme, Kiehl's, Giorgio Armani Beauty, Yves Saint Laurent Beauté, Biotherm, Mugler and Valentino. Finally, the Active Cosmetics division includes brands such as Vichy, La Roche-Posay, CeraVe - brands that are also sold through pharmacies and via healthcare professionals. In September 2022, the company announced the acquisition of Skinbetter Science, a physician-dispensed skincare brand. To provide better comparability with Estée Lauder's portfolio, Figure 1 at the end of this section shows a breakdown of sales by business segment.
From a geographic perspective, Europe and North Asia are L'Oréal's largest markets, with net sales contributions of 32% and 31%, respectively, in 2021. North America is the third largest segment (25%), and SAPMENA-SSA (South Asia, the Pacific, Middle East, North Africa and Sub-Saharan Africa) and Latin America are the smallest segments, with net sales contributions of 7% and 5%, respectively.
Finally, it seems worth noting that L'Oréal has a minority stake in the French pharmaceutical company Sanofi ( SNY , SNYNF ) (ownership of 118 million shares, corresponding to a 9.4% stake, page 365, 2021 annual report ). L'Oréal received dividends of €372 million and €378 million from Sanofi in 2020 and 2021, respectively, which are recognized as other income and represent 7.8% and 6.3% of the Group's profit before tax.
Estée Lauder
Estée Lauder is a family-controlled company that was founded in 1946, but only went public in 1995. After L'Oréal, it is the largest pure cosmetics and personal care company in the world in terms of net sales. It owns several well-known and leading brands such as Estée Lauder, Clinique, M·A·C, Bobbi Brown, La Mer, Too Faced and The Ordinar. Skin Care Products is Lauder's main sales driver, accounting for 56% in fiscal 2022. In this segment, the company manufactures and sells serums, moisturizers, cleansers, toners, and various other products that address different skin care needs. Makeup is the company's second-largest segment (26% of net sales in fiscal 2022), while the Fragrance and Hair Care segments are much smaller, contributing 14% and 4% of net sales, respectively, in fiscal 2022. A good overview of the company's key brands is provided on page 5 f. of the fiscal 2022 10-K .
Same as L'Oréal, Estée Lauder is growing both organically and through acquisitions and is committed to maintaining industry-leading margins. Estée Lauder sells its products in its own stores, freestanding stores or online through its own websites or those of authorized distributors. As with L'Oréal, the COVID-19 pandemic has accelerated the company's increasing focus on direct-to-consumer sales, reducing its reliance on brick-and-mortar retail and further strengthening margins.
The company operates globally and has strong exposure to China, its key growth market. Of course, the country's draconian COVID-19 policy has hampered the recovery of EL's Asia/Pacific segment, which is the company's second-largest segment with net sales of $5.4 billion in fiscal 2022, or 31% of total sales. Europe, Middle East and Africa ( EMEA ) is Estée's largest segment (43%) and The Americas is the smallest segment (26%). However, the smallest segment was the most profitable segment in fiscal 2022, with an operating margin of 25%. It seems worth noting that performance has been significantly worse in recent years (margins of 14% and -28% in fiscal 2021 and 2020, respectively), but even before the pandemic, the segment's performance was rather poor (operating margin in fiscal 2019 of -4%). The operating margins of the EMEA (18%) and Asia/Pacific (15%) segments are still impacted by the effects of the pandemic, which is particularly evident when comparing the data to fiscal 2019 margins (31% and 20%, respectively).
Figure 1: Breakdown of 2021 and fiscal 2022 net sales of L’Oréal [LRLCY, LRLCF] and The Estée Lauder Companies [EL] by business segment, respectively (own work)
Past Growth, Future Expectations And Profitability
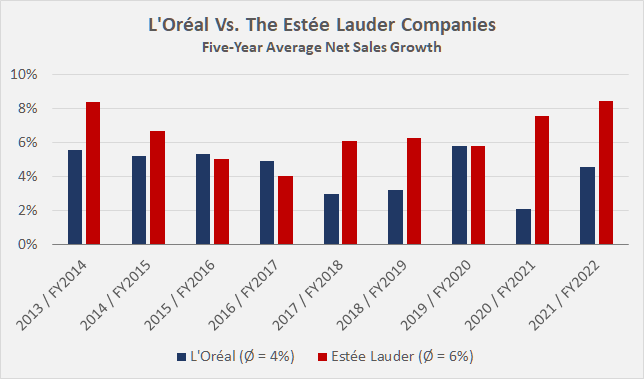
Figure 2 illustrates the net sales growth of the two companies over the last nine years utilizing five-year average growth rates. Estée has clearly outperformed L'Oréal, but I consider both sales growth rates to be solid - after all, these are relatively large companies whose businesses can only grow so fast in developed markets. However, because L'Oréal and Estée Lauder are also growing through acquisitions, it can be expected that their operating earnings growth outpaces sales growth. Over the past nine years, L'Oréal's adjusted operating profit has grown at an average annual rate of 6%, considerably slower than Estée's 11%. To be fair, however, it is worth noting that L'Oréal is a much larger company (market capitalization of $206 billion versus $97 billion as of January 6, 2022) and its baseline operating margin has historically been somewhat higher (Figure 3).
Figure 2: Five-year average net sales growth rates of L’Oréal [LRLCY, LRLCF] and The Estée Lauder Companies [EL] (own work) Figure 3: Adjusted operating margins of L’Oréal [LRLCY, LRLCF] and The Estée Lauder Companies [EL] (own work)
Looking ahead, analysts expect similar sales growth for the two cosmetics giants, with an average rate of 6.1% for Estée Lauder and 6.4% for L'Oréal over the next decade. Growth is expected to come mainly from rising demand in emerging markets (especially China), but also from an increasing emphasis on premiumization. However, due to macroeconomic uncertainties, these forecasts should be treated with caution. Earnings per share ((EPS)) growth estimates for Estée Lauder average 11% per year over the next decade, with fiscal 2023 being the trough year. For L'Oréal , there is only one analyst who expects EPS growth of 21% for 2022 and 10% for 2023. Personally, I do not put much weight on analyst estimates. Instead, I decide for myself whether the growth story is still intact. In both cases, of course, much depends on China, which is reflected in EL's and LRLCY's volatile stock prices that correlate strongly with news about China's COVID-19 policy. In the context of increasing EPS through share buybacks, it seems worth noting that L'Oréal has repurchased 11.6% of its outstanding shares since 2013 (net of stock options exercised), while Estée Lauder reduced its outstanding shares by 7.6% over the same period. The buybacks boosted EPS by 13.1% and 8.2%, respectively, over this period and understandably also reduce the cost of dividend payments (see section on dividends).
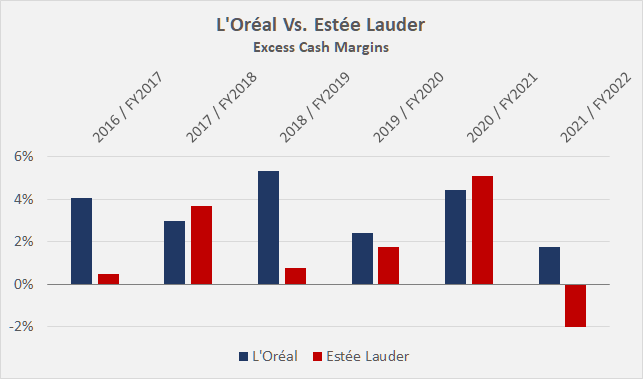
Looking at free cash flow ((FCF)) growth, Estée's outperformance in recent years is again obvious, but L'Oréal's cash flow margin (after normalizing with respect to working capital movements and adjusting for stock-based compensation expenses - normalized FCF, nFCF) is considerably stronger, with a four-year average margin of 17% versus 12%. This is not readily apparent from the operating cash flow ((OCF))-based excess cash margins (Figure 4) - which signal intact cash earnings quality for both companies - but only becomes obvious when capital expenditures (i.e., free cash flow) are taken into account. Estée invests significantly more money back into the business - the ratio of capital expenditures to normalized OCF (four-year average) is 29%, compared to 19% for L'Oréal.
Figure 4: Excess cash margins of L’Oréal [LRLCY, LRLCF] and The Estée Lauder Companies [EL], calculated by subtracting adjusted operating earnings from operating cash flows and dividing by net sales (own work)
L'Oréal's significantly better cash earnings are also attributable to better working capital management. While Estée Lauder has also reduced its cash conversion cycle over the past nine years, L'Oréal's performance in this regard is significantly better (Figure 5). In these arguably difficult times, both companies have to maintain higher inventory levels (supply chain issues, concentration risks), which increases the cash conversion cycle due to higher inventory days ((ID)) and thereby reduces profitability from a cash flow perspective. L'Oréal is in a better position in this regard, with an ID of 126 days in 2021 versus 230 days for Estée Lauder in fiscal 2022.
Figure 5: Cash conversion cycle of L’Oréal [LRLCY, LRLCF] and The Estée Lauder Companies [EL] (own work)
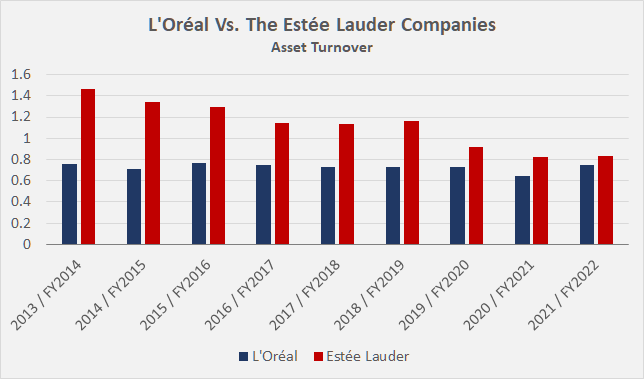
In theory more concerning is the fact that Estée Lauder's asset turnover has been declining from about 1.5 (fiscal 2014) to 0.8 (fiscal 2022), meaning the company is using its assets increasingly inefficiently. This could be attributed to regular acquisitions and lengthy or difficult integration processes. Restructuring-related costs are regularly reported in Estée Lauder's income statement, but they are not really significant (typically around 1% of net sales). While I would keep an eye on Estée's asset turnover, I would also not over-interpret its development. The hypothesis that the decline in asset turnover is due to the company's growth through acquisitions seems reasonable, especially considering that much larger competitor L'Oréal has had an asset turnover of about 0.7 to 0.8 since at least 2013 (Figure 6). Therefore, it seems appropriate to conclude that Estée has merely moved closer to the industry norm from an asset turnover perspective.
Figure 6: Asset turnover of L’Oréal [LRLCY, LRLCF] and The Estée Lauder Companies [EL] (own work)
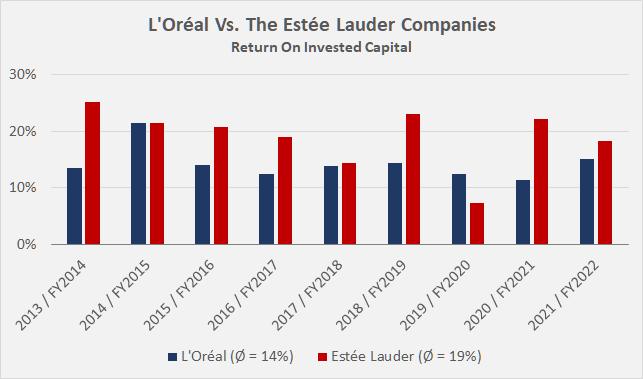
Finally, I would like to discuss the historical return on invested capital ((ROIC)) of Estée Lauder and L'Oréal, which I consider to be a very important, if not the most important, profitability metric from a shareholder perspective. In my own portfolio, I place a high value on companies that consistently generate a return on invested capital that significantly exceeds their cost of capital, as such companies typically outperform the market over the long term. Estée Lauder's ROIC is generally higher than L'Oréal's (Figure 7), but it should be noted that the two companies' costs of capital are different.
Figure 7: Return on invested capital of L’Oréal [LRLCY, LRLCF] and The Estée Lauder Companies [EL] (own work)
As a company domiciled in Europe, L'Oréal's cost of debt (see next section) is significantly lower than Estée Lauder's, reducing its weighted average cost of capital ((WACC)). The other component of WACC, the cost of equity, is a controversially discussed parameter. According to textbooks, it should be calculated according to the Capital Asset Pricing Model ((CAPM)), which takes into account the volatility of the stock as a measure of risk. Of course, such an approach has its own shortcomings, and I personally prefer to determine cost of equity using a number of factors such as GICS sector, market position, leverage, profitability, etc. L'Oréal's cost of equity is currently 7.7% and Estée Lauder's is 9.5% using the textbook guideline. Taking into account cost of debt, L'Oréal's WACC is 7.5% and Estée Lauder's is 8.9%.
In addition to comparing ROIC with the cost of capital, it is also worth looking at ROIC in the context of cash flow profitability. Because of its better free cash flow margin, L'Oréal's cash return on invested capital ((CROIC)) is similar to that of Estée Lauder, which has the leaner asset base. Of course, CROIC should not be compared to WACC as it is an equity-related metric, but given EL's and LRLCY's low leverage, such a discussion is more academic than practical. The important takeaway is that both companies generate reliable excess returns on their invested capital, using both after-tax net operating profit ((ROIC)) and normalized free cash flow ((CROIC)). L'Oréal's somewhat lower return on invested capital is put into perspective when free cash flow is considered, and it should also be remembered that L'Oréal is almost twice as large as Estée Lauder in terms of net sales.
Balance Sheet Quality
Estée Lauder's net debt at the end of fiscal 2022 was 1.9 times the company's four-year average nFCF (to smooth out one-off events in 2020 and 2021) - a figure that can hardly be described as worrisome and is a clear testament to the company's conservative management. The interest coverage ratio is 12 times the four-year average of Estée's nFCF, underscoring the company's ability to continue servicing its debt even in a high interest rate environment.
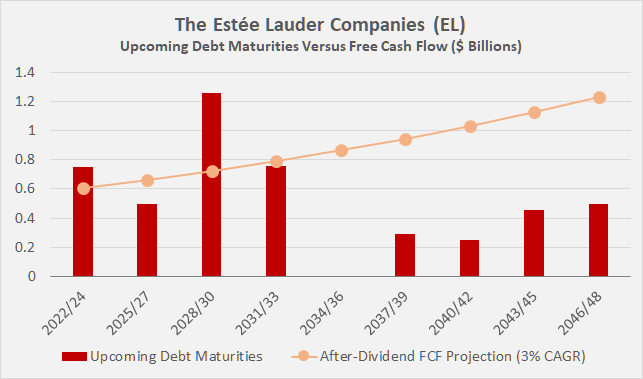
Even though Estée's debt is very manageable, I have nevertheless taken a look at its maturity profile. Figure 8 compares the company's upcoming maturities to normalized after-dividend nFCF (broken into three-year periods). Estée would not be able to repay its entire debt as it matures, but this is to be expected and almost always seen in larger companies. This also makes sense from an economic perspective, as equity is always more expensive than debt, and a manageable combination of both sources of capital lowers the cost of capital. The refinancing of the bonds maturing in the next few years will of course slightly increase the current weighted average interest rate of 3.19%, probably by around 15 to 20 basis points on a weighted average basis. Estée's long-term debt rating of A1 (A+ Standard & Poor's equivalent) was reaffirmed by Moody's in November 2022 with a stable outlook.
Figure 8: Debt maturity profile of The Estée Lauder Companies [EL] at the end of fiscal 2022 in three-year buckets, compared to its four-year average normalized free cash flow after dividends (own work)
At the end of 2021, L'Oréal had net debt of €3.6 billion on its balance sheet, including lease obligations. Interestingly, the majority of the company's interest-bearing debt is classified as current debt, which sounds worrisome at first glance from a maturity matching perspective. However, L'Oréal's four-year average nFCF of €5.1 billion puts the matter into perspective - the company's low level of debt is simply not worth a deeper discussion. Anyone interested can take a look at page 323f. of L'Oréal's 2021 annual report , where management discusses debt (e.g., maturities, currency exposure, hedging). However, it does seem worth noting that of the €6.3 billion in gross debt outstanding at the end of 2021, more than 70% is floating rate, so L'Oréal's debt servicing ability will decline as interest rates rise. At the end of 2021, the weighted average interest rate on the company's euro-denominated debt was -0.51% [ sic ], underlining L'Oréal's exceptional balance sheet quality and the anomalies that go in hand with the low/zero interest rate environment of the last decade. In early 2022, the company received an AA rating from Standard & Poor's and an Aa1 rating from Moody's with a stable outlook (p. 45, 2021 annual report ). Including interest on lease payments, L'Oréal's interest coverage ratio was approximately 230 times nFCF before interest. The net debt to nFCF ratio of 0.7 confirms what has already been suggested - L'Oréal could hypothetically repay its outstanding debt and lease obligations in less than a year, assuming it suspended its dividend. The company's focus on floating rate debt and short-term maturities is definitely not an issue.
While it may sound a bit cliché, the L'Oréal case once again confirms that European companies often operate with considerably lower leverage than U.S.-based peers. However, I think this is a pity from a shareholder perspective, as interest rates are much lower in the Eurozone and the European Central Bank has much less room to raise rates given the excessive debt of several member states. Of course, I do not condone the use of excessive leverage, but in the context of largely non-cyclical companies and/or those with very robust and reliable cash earnings, I have no objection to a company using a healthy level of leverage as long as its investments are profitable in terms of a positive excess ROIC - which is definitely the case for both companies.
Dividend Safety And Dividend Track Record of L'Oréal and Estée Lauder
Due to the strong balance sheets and reliable cash earnings, I consider the shares of both L'Oréal and Estée Lauder solid income-generating assets, leaving the rather low dividend yields aside for a moment (see below). And although earnings exhibit more or less pronounced cyclicality (see FAST Graphs charts in the last section), I see no reason to believe that the two companies will cut their distributions to shareholders in a recession. Using four-year averages of nFCF results in very manageable payout ratios of 46% and 44% for L’Oréal and Estée Lauder, respectively, which leaves plenty of room for growth and buffer in a recession. It should also be remembered that the use of four-year average nFCFs is rather conservative due to the relatively strong underlying growth.
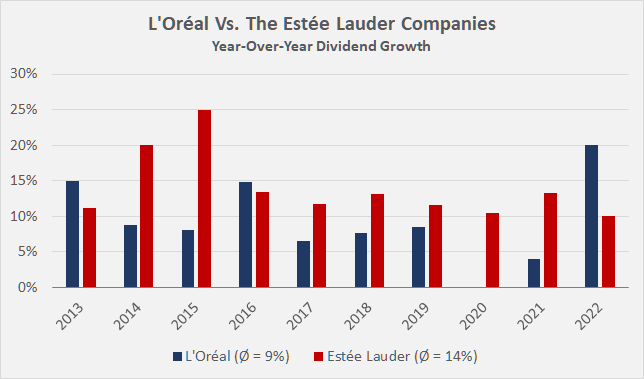
Estée Lauder has paid a dividend since 1995 and has increased it every year since its inception. Figure 9 compares the two companies' dividend increases over the past decade. According to information on the company's website, no dividend was paid in June 2020, likely due to uncertainties related to the emerging COVID-19 pandemic, so the annual dividend payment declined that year. However, management made up for the missing payment with a generous 13% increase in November 2021. The recent 10% increase can also be considered significant, but an investor opening a position today would still have to wait very patiently for a meaningful yield on cost to accumulate, as the stock is currently yielding only 1.0%. Figure 10 shows a projection of EL's current dividend yield into the future, assuming an 8% annual growth rate.
Annual increases are not the norm for many companies in Europe, and occasional periods of stagnant dividends or sometimes even suspensions cannot be ruled out. Management of L'Oréal, however, is strongly committed to its dividend. Apart from 2020, when management decided not to increase the dividend due to the uncertainties surrounding the pandemic, L'Oréal's dividend record is very good. Over the past decade, the company has increased its payout to shareholders by an average of 9% per year, and management compensated patient shareholders for the failure to increase in 2020 and the somewhat unimaginative increase of only 4% in 2021 with a very generous 20% increase in 2022 (Figure 9). However, with a starting dividend yield of currently 1.3%, investors will need a lot of patience to match the current yield on long-term U.S. Treasury bonds (3.8%) - 14 years to be exact.
Apart from the fact that L'Oréal pays its dividend in a single installment each year (which is quite common for European companies) - usually in April - there is one rather interesting aspect to note that I have not come across before with another company. L'Oréal incentivizes long-term ownership of its shares by offering a 10% loyalty bonus that applies after the shareholder has registered the shares to their name and held the shares for two full calendar years. For example, a shareholder who registered their shares before the end of 2022 would be eligible for the 10% bonus starting with the 2025 payout (Figure 10, light blue). I realize that it can be difficult for U.S. shareholders to register their shares (information on this can be found here ), and that this could possibly be completely impossible when owning the ADRs (ticker LRLCY , each representing one-fifth of an ordinary share). In this context, foreign investors should also be aware of the French withholding tax of 21% or 30% . While there are ways to reclaim the portion of the withholding tax that exceeds the amount allowed under the relevant double tax treaty, this could be difficult when holding ADRs. As an investor from Europe, I know of brokers who can arrange for a deduction equal to the amount specified in the double tax treaty, so there is no need to file any documentation with the French tax authorities. However, I would like to point out that this is only my personal experience and that other investors should definitely consult their licensed tax advisor before investing.
Figure 9: Year-over-year dividend growth rates of L’Oréal [LRLCY, LRLCF] and The Estée Lauder Companies [EL], average growth rates in parentheses (own work) Figure 10: Yield on cost projections for L’Oréal [LRLCY, LRLCF] (excluding and including the loyalty bonus from 2025 on) and The Estée Lauder Companies [EL], assuming the companies slow down their dividend growth and maintain it at 8% per annum in perpetuity (own work)
Key Risks
The sales and earnings of companies like L'Oréal and Estée Lauder are moderately cyclical. A severe downturn will certainly impact the two companies, but given their focus on premium offerings, I would not overstate this risk. Consumers with high disposable incomes are unlikely to switch to cheaper brands, as inflation and increased unemployment generally do not significantly affect this segment of society. Nevertheless, further erosion of the middle class, accelerated by a potentially long-lasting economic downturn, poses a risk to earnings.
Obviously, the brief recession in 2020 due to the pandemic was a very special one that hit both companies hard due to their exposure to the travel and retail business. The pandemic definitely accelerated the move toward e-commerce in general and direct-to-consumer in particular, which should ultimately lead to improved profitability. Nonetheless, the still significant exposure to department stores should be considered in one's due diligence.
As with all companies that derive most of their competitive advantage from their brands, scandals of any kind could damage their reputations and lead to a decline in profits, accompanied by impairment charges for goodwill and/or other intangible assets. Such charges are GAAP earnings-relevant and therefore, along with declining earnings, could represent a double whammy to the share price.
Ongoing supply chain issues and transportation bottlenecks are definitely a risk worth considering as well but likely a lower priority risk going forward, as the companies stabilize their supply chains through redundancies.
As traditionally high-margin companies with low capital intensity, L'Oréal and Estée Lauder can easily withstand inflationary pressures. As mentioned earlier, they have considerable pricing power and operate at significant economies of scale. As a result, import tariffs are likely to have only a minor impact on the two companies, but are still worth considering given the increasingly protectionist behavior of governments around the world.
The elephant in the room, of course, is China, and increasing isolation from the West could quickly destroy an investment thesis in either company. The abysmal performance of the two stocks, as well as recent strong rallies following somewhat positive news (LRLCY and EL rose 19% and 43%, respectively, from their 52-week lows), confirm the sensitivity to developments in China and the rather nervous attitude of investors. Most recent quarterly performance , however, suggests that L'Oréal is currently navigating headwinds in the Chinese market better than Estée Lauder, but this effect might be short-lived given the latter company's stronger emphasis on premium products.
Due to its significant exposure to non-US dollar regions, Estée Lauder's earnings - as a U.S.-domiciled company - are expected to suffer from a stronger dollar.
From a U.S. investor's perspective, it seems worth noting that L'Oréal reports earnings and pays its dividend in euros. The EUR/USD currency pair moves in a wide corridor, but it should not be forgotten that the pair has recently traded below parity. A weaker euro will benefit L'Oréal's earnings (as long as L'Oréal's eurozone customers maintain their standard of living, of course), but the net dividend a U.S. investor receives will understandably decline with the devaluation of the euro. Ultimately, it comes down to the risk appetite of the individual investor, but in theory, all living expenses should have a corresponding income in the same currency.
Finally, as mentioned earlier, Estée Lauder is a family-controlled company. According to page 24 of the company's fiscal 2022 10-K , members of the Lauder family represent 84% of the outstanding voting power of its common stock. While Estée Lauder's ancestors and other owners close to the family certainly have a vested interest in the company's continued success, minority investors should be aware that they are ultimately at the mercy of the family's decisions (e.g., regarding a hypothetical privatization during a recession). L'Oréal's ownership structure is more diverse from a voting rights perspective, but the significant family ownership should still be considered. The Bettencourt Meyers family controls 33.3% of the voting rights and Nestlé S.A. ( NSRGY , NSRGF ) controls another 19.3%. However, with the expiry of their agreement in 2004, the two parties have not acted in concert since March 2018 (p. 383, 2021 annual report ).
Valuation Of LRLCY AND EL Stock
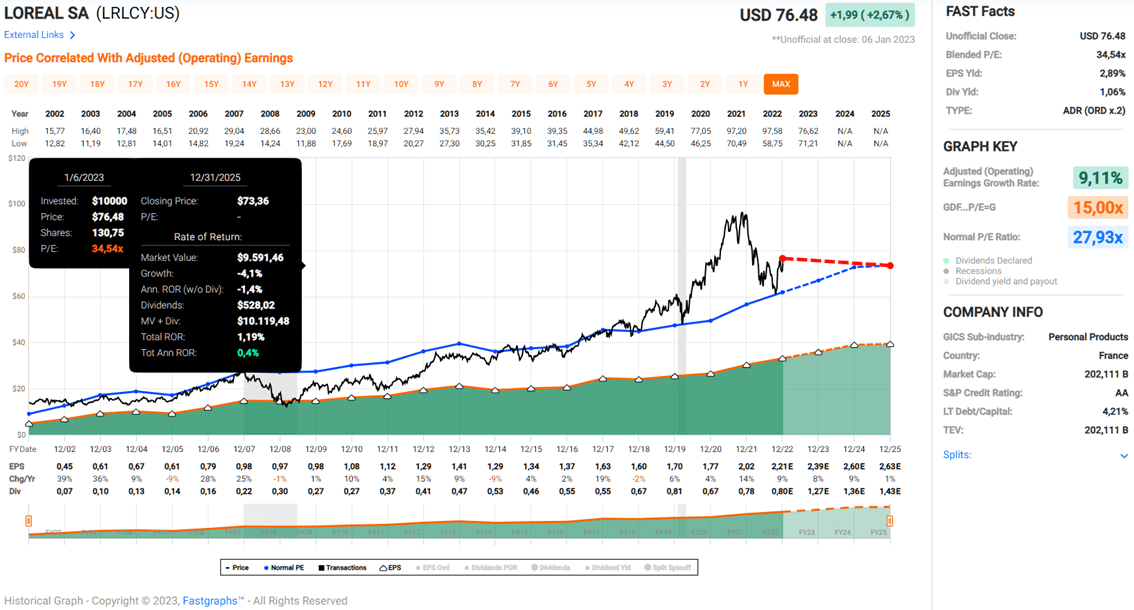
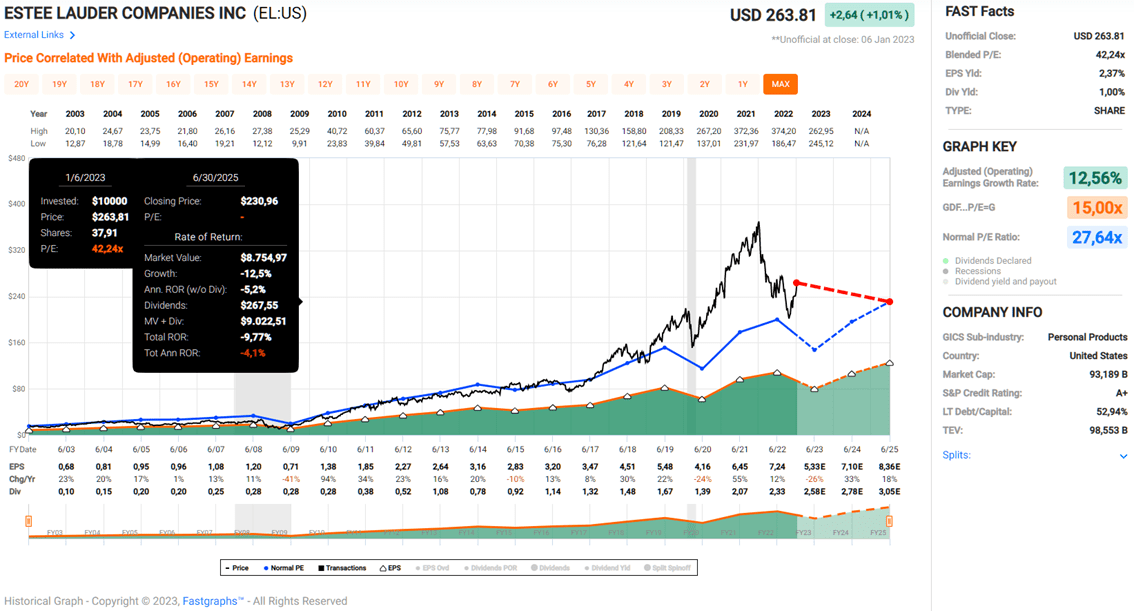
From an earnings perspective, both stocks are currently highly valued, which is somewhat surprising given the difficult macroeconomic outlook in general and the ongoing uncertainties surrounding the companies' main growth market - China - in particular. For a value investor like myself, paying more than 34 times earnings for L'Oréal and more than 40 times (!) earnings for Estée Lauder is out of the question, even though the growth stories of the companies are convincing. If we apply a - much more reasonable, but still high - price-to-earnings (P/E) ratio of 28 according to FAST Graphs and assume that analysts' estimates for the next two years come true, the two stocks should yield an annualized return of 0.4% (Figure 11) and -4.1% (Figure 12), respectively, including dividends. The two FAST Graphs charts also illustrate that both companies have experienced significant P/E expansion over the years, which I believe is largely unwarranted, especially if we return to a somewhat more reasonable interest rate regimen going forward. During the Great Financial Crisis, both EL and LRLCY were trading at less than 15 times earnings. I doubt we will see multiples like that anytime soon - probably not even in the event of a major liquidity crisis or a severe exogenous shock - but today is clearly not the time to buy L'Oréal or Estée Lauder stock from an earnings perspective.
Figure 11: FAST Graphs plot of L’Oréal [LRLCY, LRLCF] (taken with permission from www.fastgraphs.com) Figure 12: FAST Graphs plot of The Estée Lauder Companies [EL] (taken with permission from www.fastgraphs.com)
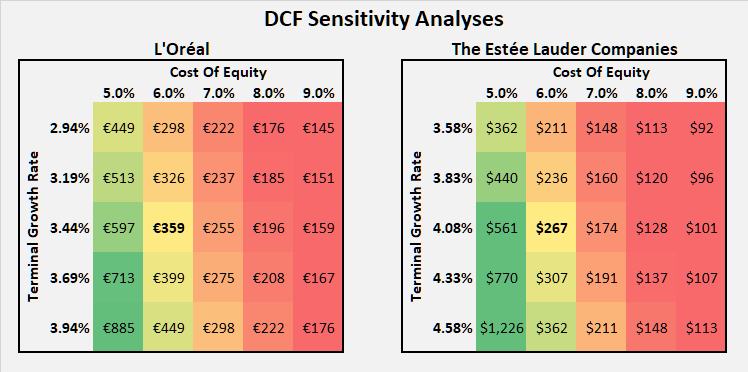
From a free cash flow perspective, things understandably do not look much different. The four-year average nFCF yield of both companies (2.5% LRLCY, 2.0% EL) is currently well below the interest rate of long-term US government bonds, another clear sign of overvaluation. When extrapolating the two companies' growing normalized free cash flows into the future and discounting them with various costs of equity, matrices as in Figure 13 – in which L'Oréal's and Estée Lauder's current share prices are shown in bold numbers - can be obtained. As can be observed, such discounted cash flow ((DCF)) models are very sensitive to the terminal growth rate, and it therefore seems imprudent to expect long-term nFCF growth of more than 5% or 6%. Beyond a certain point, the law of large numbers simply kicks in. This is more relevant for L'Oréal, which is already a much larger company (see above). In any case, an investor would have to be satisfied with a cost of equity of only about 6%, and L'Oréal and Estée Lauder would still have to increase their free cash flow by 3.4% and 4.1%, respectively, in perpetuity to justify their current share prices.
Figure 13: Discounted cash flow sensitivity analysis of L’Oréal [LRLCY, LRLCF] and The Estée Lauder Companies [EL] (own work)
Concluding Remarks
Both companies are obviously very good businesses with world-class brand portfolios, wide economic moats and strong pricing power. With their forward-looking and conservative management teams, solid balance sheets, and exceptional profitability, Estée Lauder and L'Oréal are solid long-term investments. There is not much to dislike about L'Oréal (except perhaps the lower emphasis on the premium products), while Estée Lauder's somewhat poorer quality of working capital management is worth noting. I had expected a somewhat higher cash flow profitability from the U.S. cosmetics giant, but it should not be forgotten that Estée Lauder is still somewhat in recovery and optimization mode, as can be noticed from the very volatile margins over the years. By comparison, L'Oréal's margin profile is much more reliable and balanced.
While the rather low dividend yields are largely a consequence of valuation multiples expansion, it would nonetheless be inaccurate to call EL and LRLCY dividend investments - they are clearly total return investments. However, managements are very committed to the dividends, as underscored by strong and reliable long-term growth and the conservative balance sheets. Therefore, the two stocks could be seen as generational income plays, in part because L'Oréal and Estée Lauder definitely have staying power and show a continued ability to adapt and evolve - whether organically or through acquisitions. Both companies obviously have the financial capacity to absorb smaller competitors or promising emerging growth companies with ease.
Given the very high valuations, buying L'Oréal and Estée Lauder does not seem prudent at this stage, especially given the macroeconomic uncertainties. A look at the past shows that EL and LRLCY return to much cheaper valuations in troubled times, so it is worth waiting and focusing on other cheaper sectors for the time being. Both companies are solid candidates for the watch list, but if I had to choose, I would personally prefer L'Oréal for the reasons outlined above. A P/E ratio of 20 to 22 (i.e., a share price of 220 euros or a nFCF yield of 4.0%) seems like a very reasonable (but currently difficult to imagine) price to pay for L'Oréal in a downturn.
Thank you very much for taking the time to read my article. How did you like it, my style of presentation, the level of detail? If there is anything you'd like me to improve or expand upon in future articles, do let me know in the comments section below.
For further details see:
L'Oréal Vs. Estée Lauder: The Better Pick Will Surprise You