LABU - LABU And LABD: Another Attractive Double-Short Pairs Trade
2023-09-29 16:50:34 ET
Summary
- Pairing Direxion Daily's S&P Biotech Bull 3X Shares ETF with their S&P Biotech Bear 3X Shares ETF produces a low volatility couple.
- Shorting both assets is attractive because leveraged assets erode over time due to their higher beta and inability to stay correlated over longer timeframes.
- The performance of the couple is dependent on the behavior of the underlying, with the short couple expected to lose value during strong trends.
- Because this strategy requires one to short both assets, I currently rate LABU and LABD as Sells.
Thesis
I have been searching for attractive low-volatility couples for use in a margin portfolio. The more of these I research, the more I am finding I should look for underlying with high volatility, yet tend to trade in a range.
This article is exploring the possibility of pairing Direxion Daily's S&P Biotech Bull 3X Shares ETF ( LABU ) with their S&P Biotech Bear 3X Shares ETF ( LABD ). Because this strategy requires one to short both assets, I currently rate LABU and LABD as Sells.
Backgrounds
Both funds were formed on May 28, 2015. LABU and LABD both attempt to track 3x or -3x the daily performance of the S&P Biotechnology Select Industry Index. LABU currently carries a net expense ratio of 1.09%, while LABD's is 1.01%.
Why They Erode
Leveraged assets have higher beta than their underlying and are designed to move in relation to their daily price action. This means they are unable to stay correlated over longer timeframes.
When an asset experiences a 25% gain in one day, it would need to drop by 20% the following day to reach its previous value. A 50% gain would only require a 30% decline, while a 50% drop would require a 100% increase to recover.
For example, if the underlying of a triple leveraged asset drops by 10% in a day, and then gains 11.1111% the next day, it will have returned to its previous value.
100 x (0.90) x (1.111111) = ~100.00.
Yet a triple leveraged ETF tied to it, will have experienced larger moves and will not return to its previous value.
100 x (0.70) x (1.333333) = 93.333331.
So while the underlying moved down by 10% and then returned to its previous value, the triple leveraged ETF correlated with it has lost roughly ~6.67%.
Although this represents a significant two-day move in the underlying, frequent small moves compound over time. This is why it is not advisable to be long a leveraged ETF over longer timeframes. Enough investors and traders have misunderstood this behavior that the SEC and FINRA both issued warnings.
Weightings
As to be expected with two assets that are both designed to inversely correlate to the same underlying, my minimum variance calculator is showing what amounts to a 50/50 ratio produces an extremely low variance for the couple. A minimum variance of 0.0191 can be achieved by shorting LABD by $981.82 for every $1000 they were short LABU.
LABU vs. LABD (By Author)
Combined Performance
The performance of the couple is dependent on the behavior of the underlying. Even though the two assets maintain correlation over daily timeframes, during periods when their underlying enters strong trends with few pullbacks, the couple falls out of co-integration and is expected to lose value.
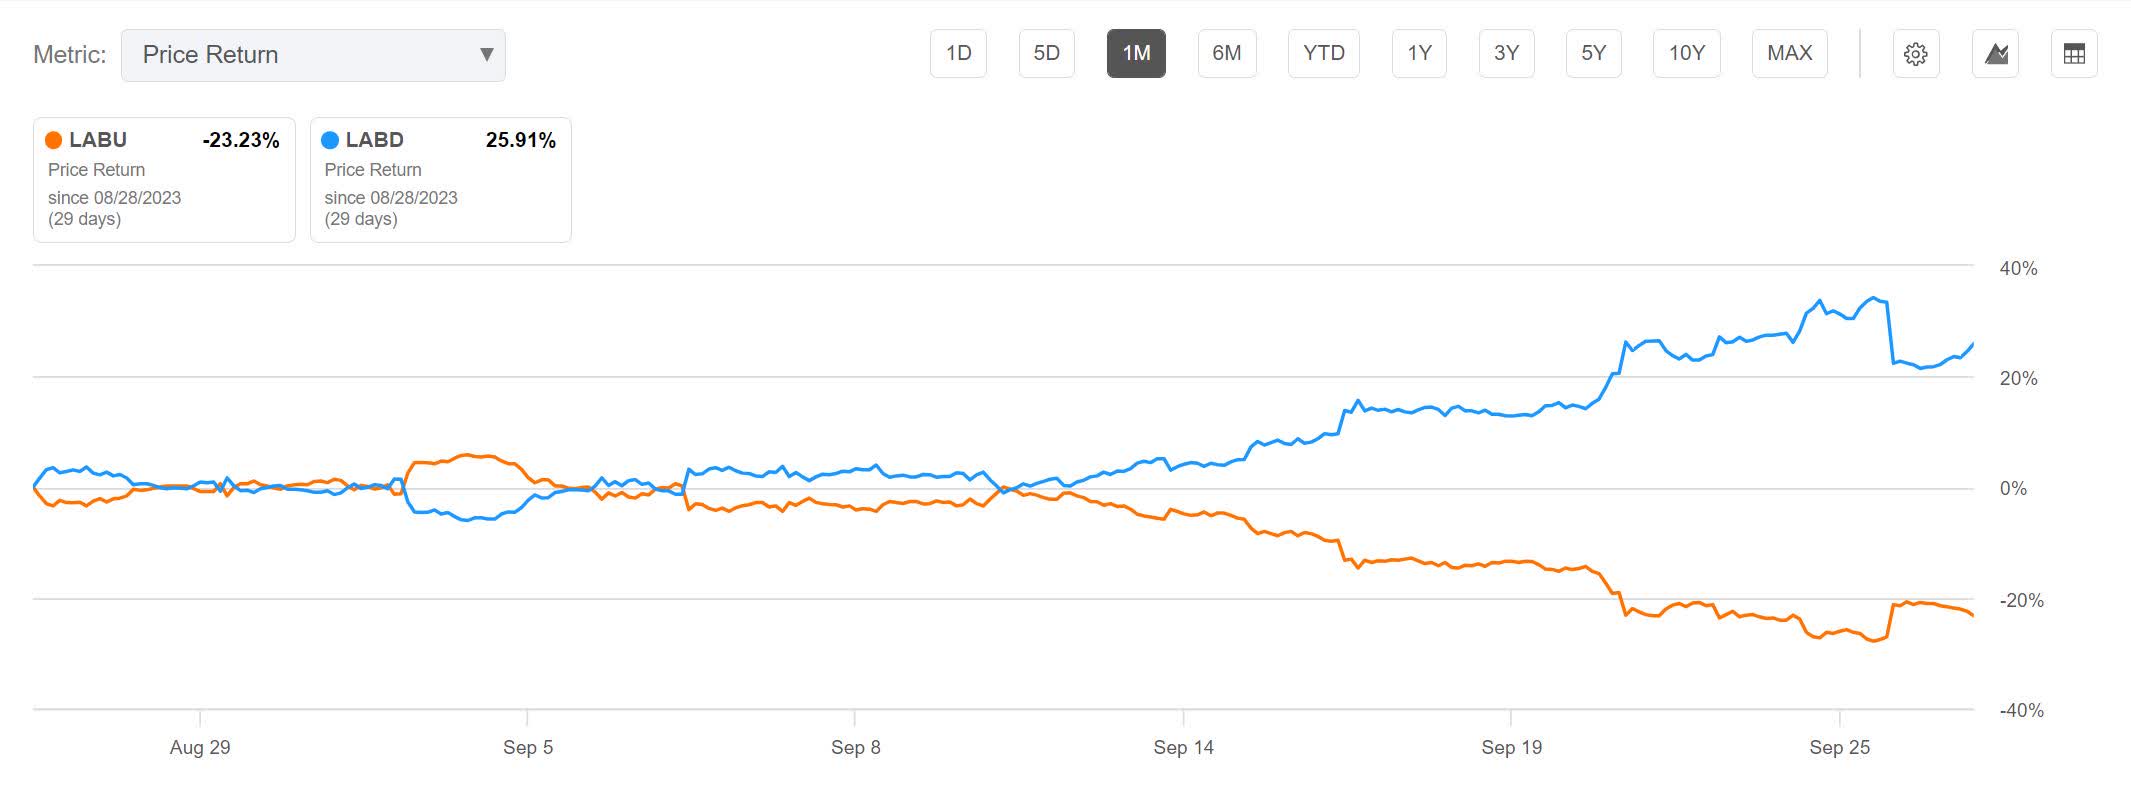
Over the last month, LABU is down by 23.23% and LABD is up by 25.91%. The short couple would be down by 1.34%.
LABU vs. LABD 1-Month (Seeking Alpha)
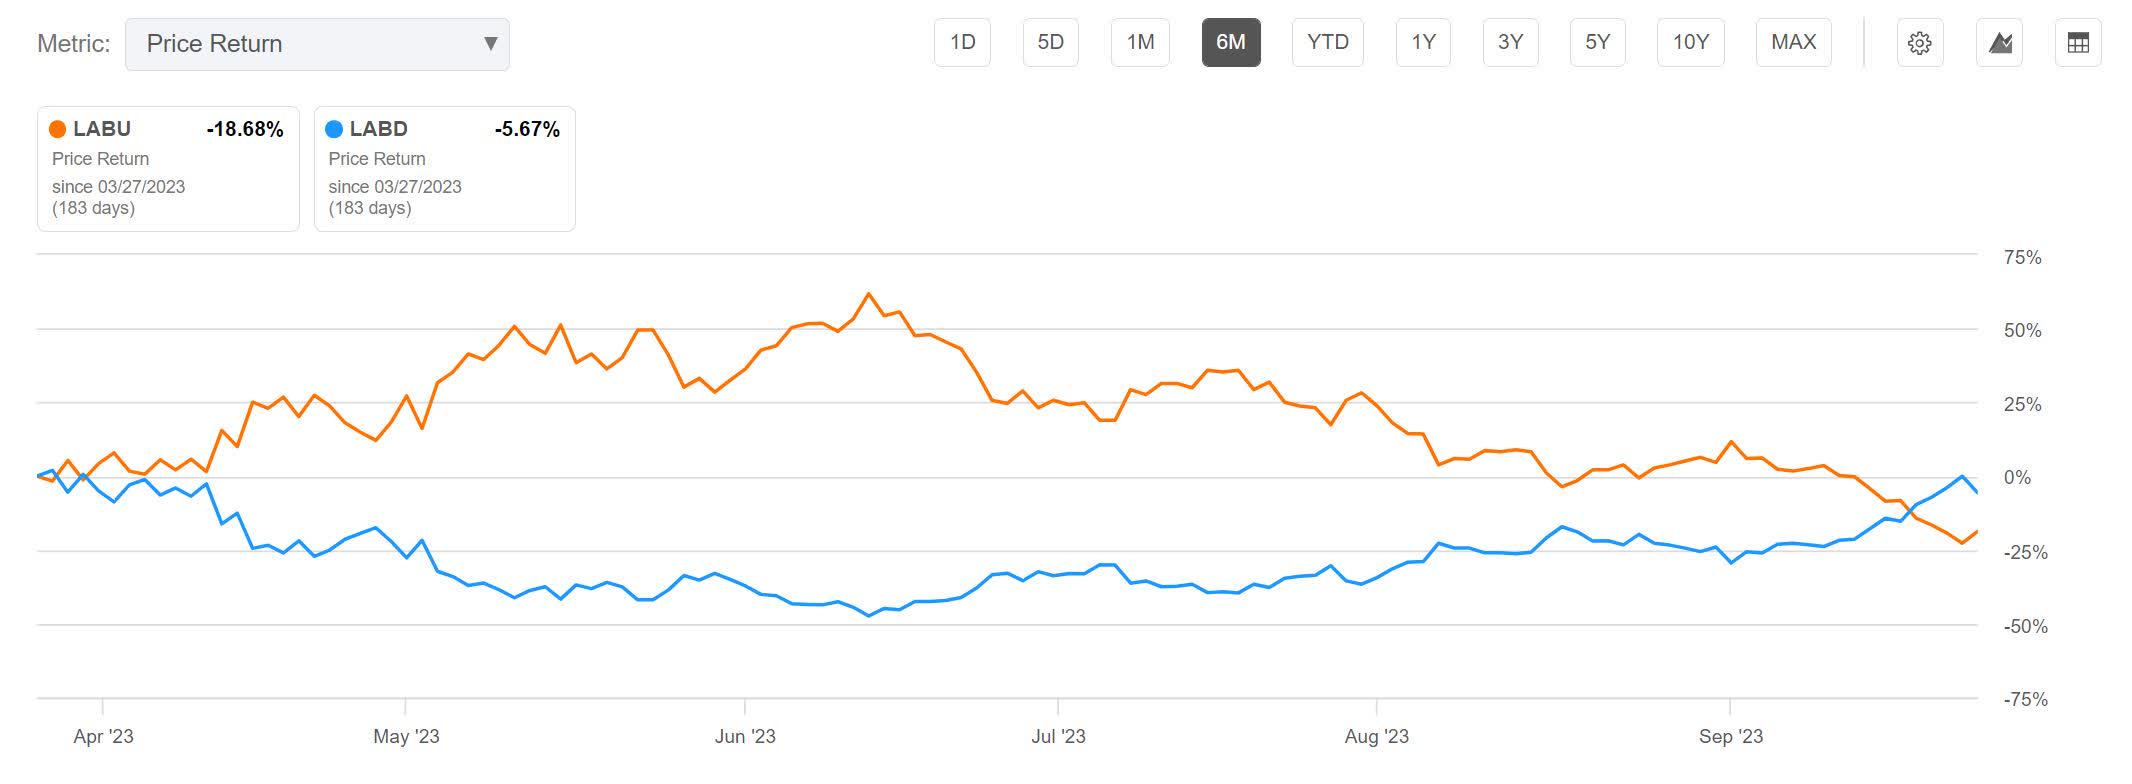
Over the six months, LABU is down by 18.68% and LABD is down by 5.67%. The short couple would be up by 12.175%.
LABU vs. LABD 6-Month (Seeking Alpha)
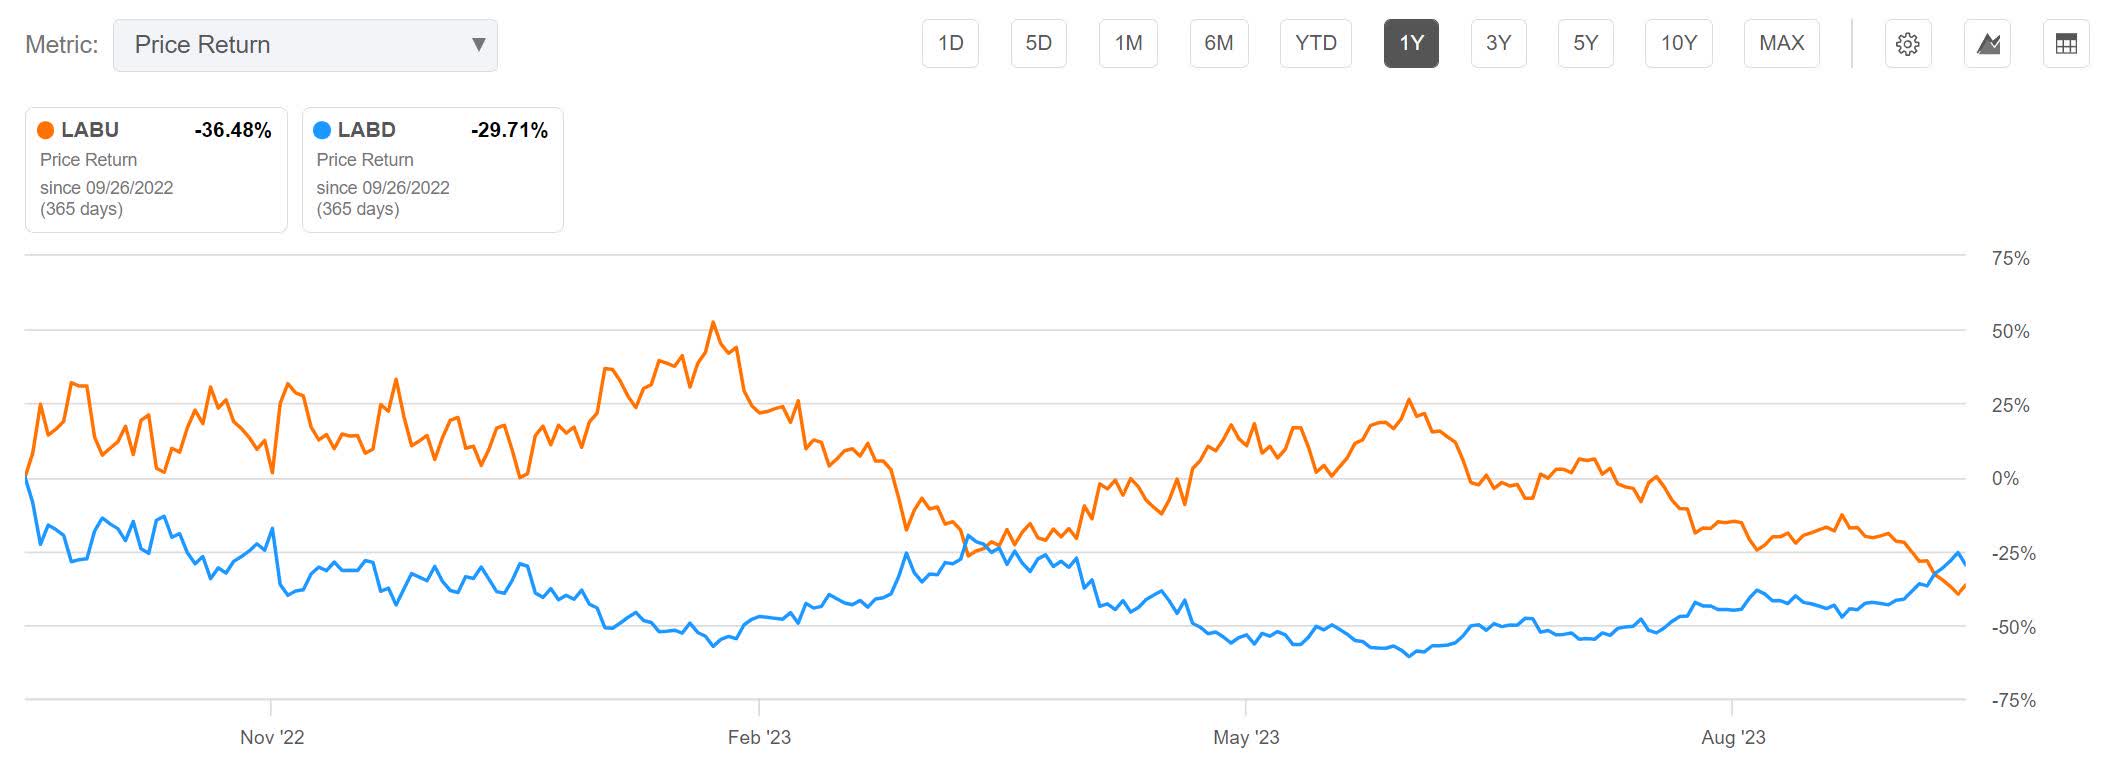
Over the year, LABU is down by 36.48% and LABD is down by 29.71%. The short couple would be up by 33.095%.
LABU vs. LABD 1-Year (Seeking Alpha)
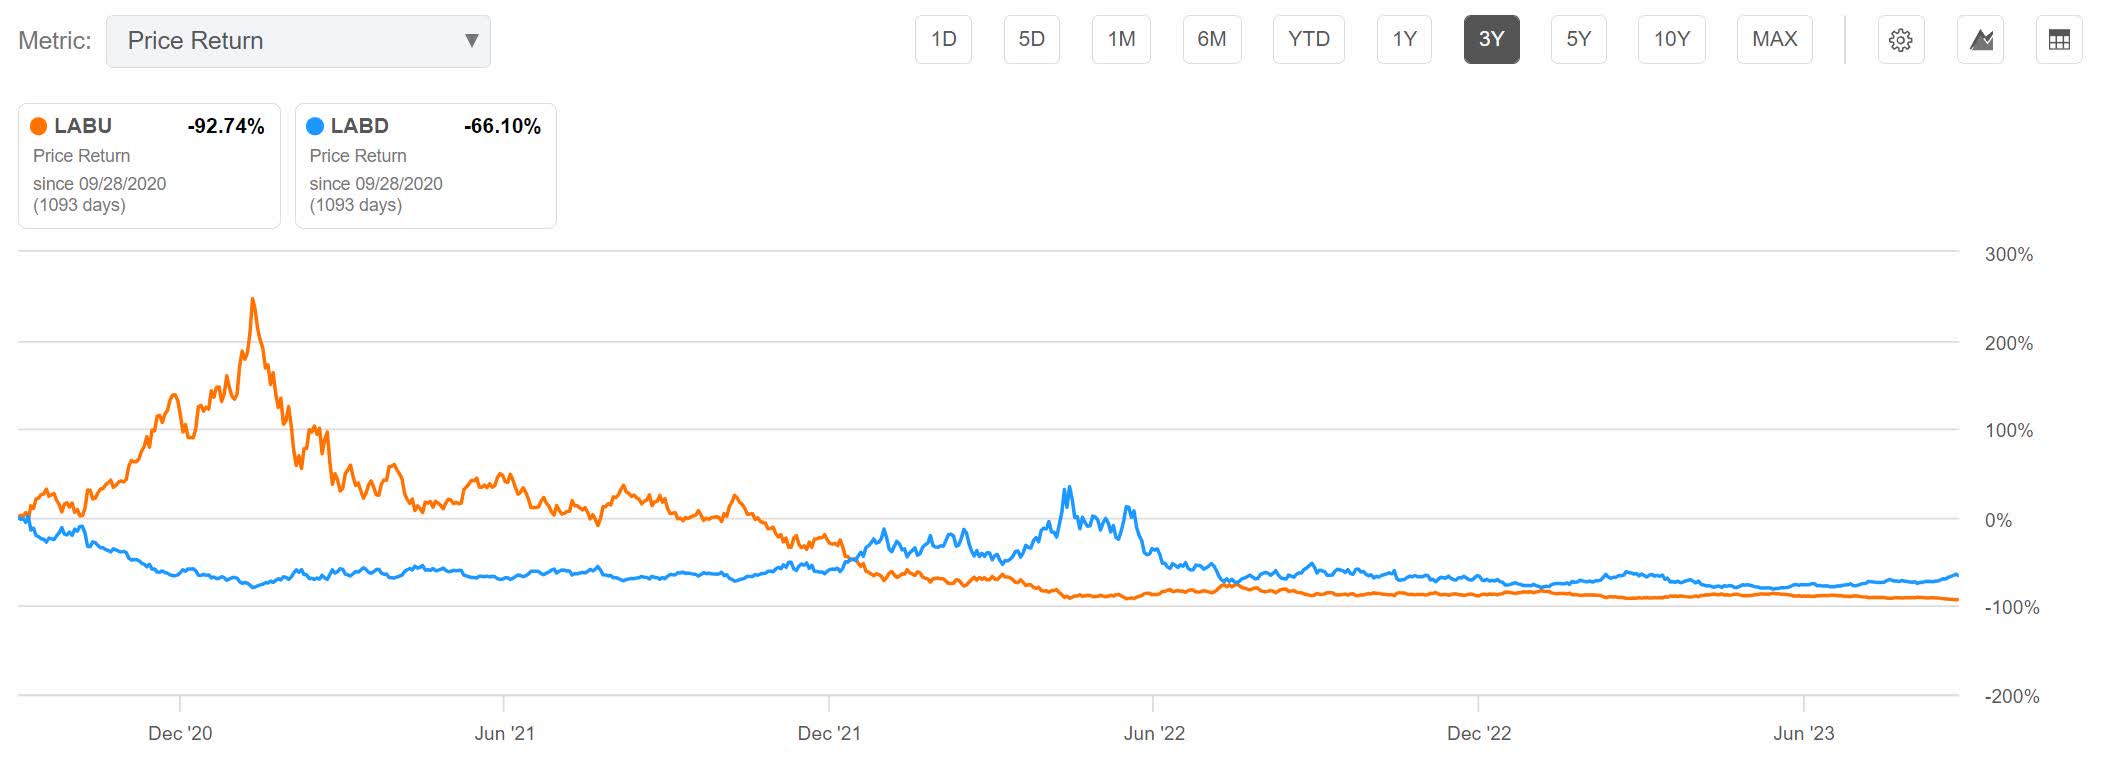
Over the last three years, LABU is down by 92.74% and LABD is down by 66.10%. The short couple would be up by 79.42%.
LABU vs. LABD 3-Year (Seeking Alpha)
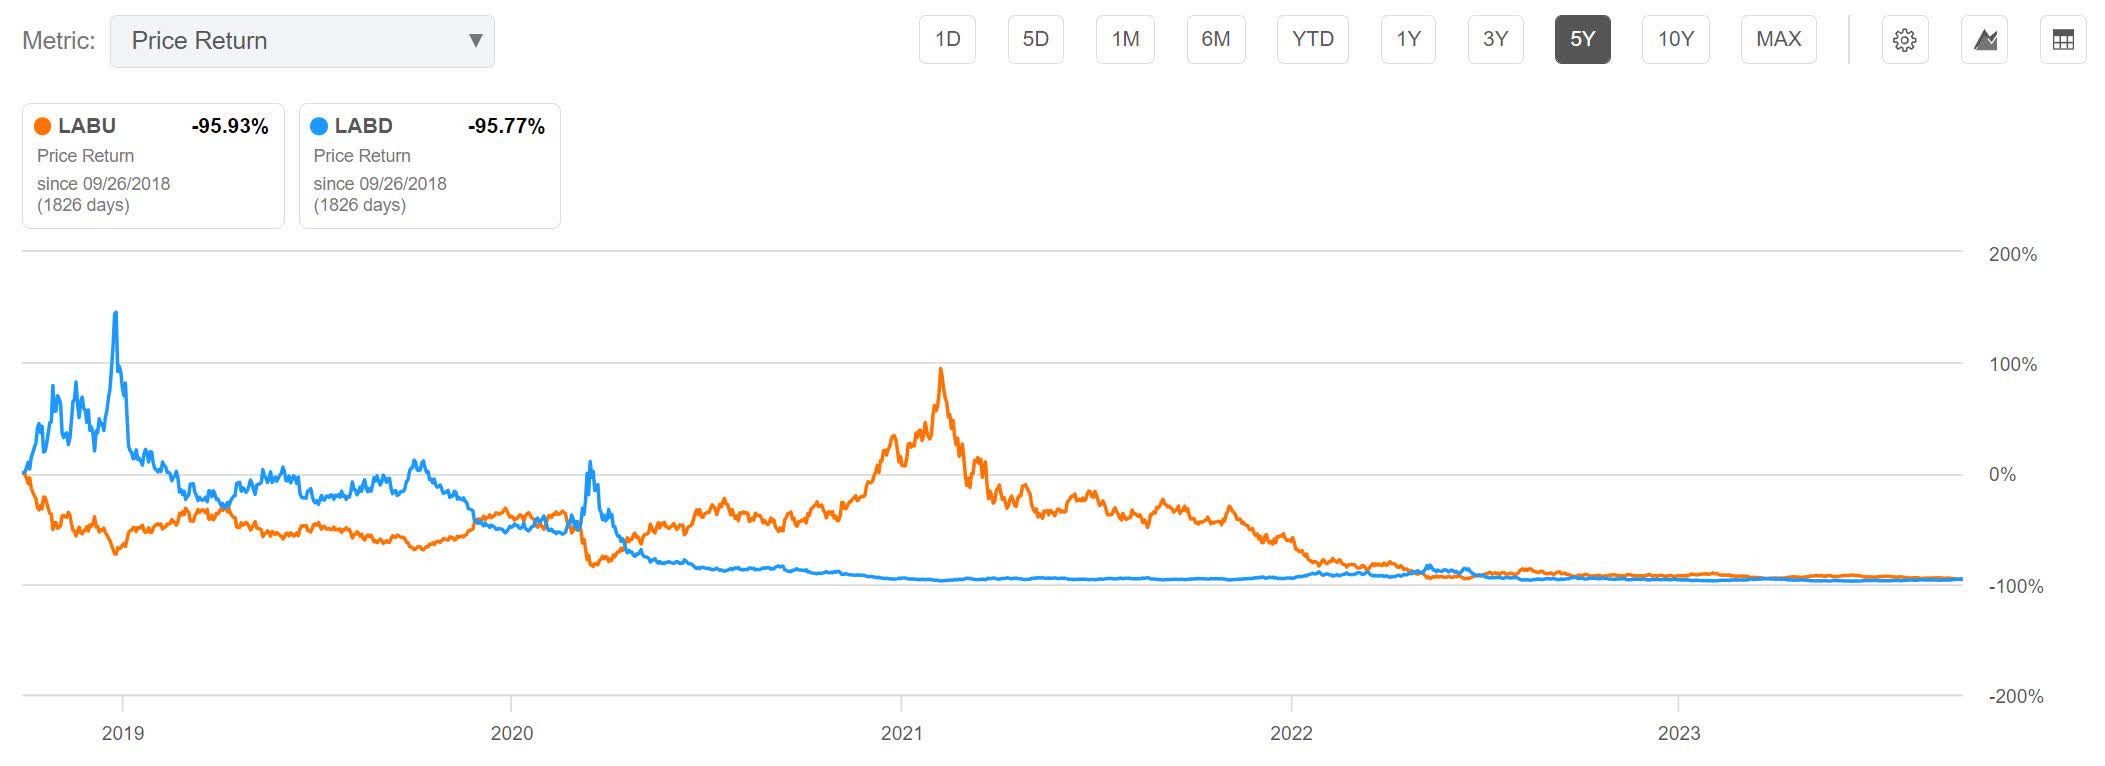
Over the five years, LABU is down by 95.93% and LABD is down by 95.77%. The short couple would be down by 95.85%.
LABU vs. LABD 5-Year (Seeking Alpha)
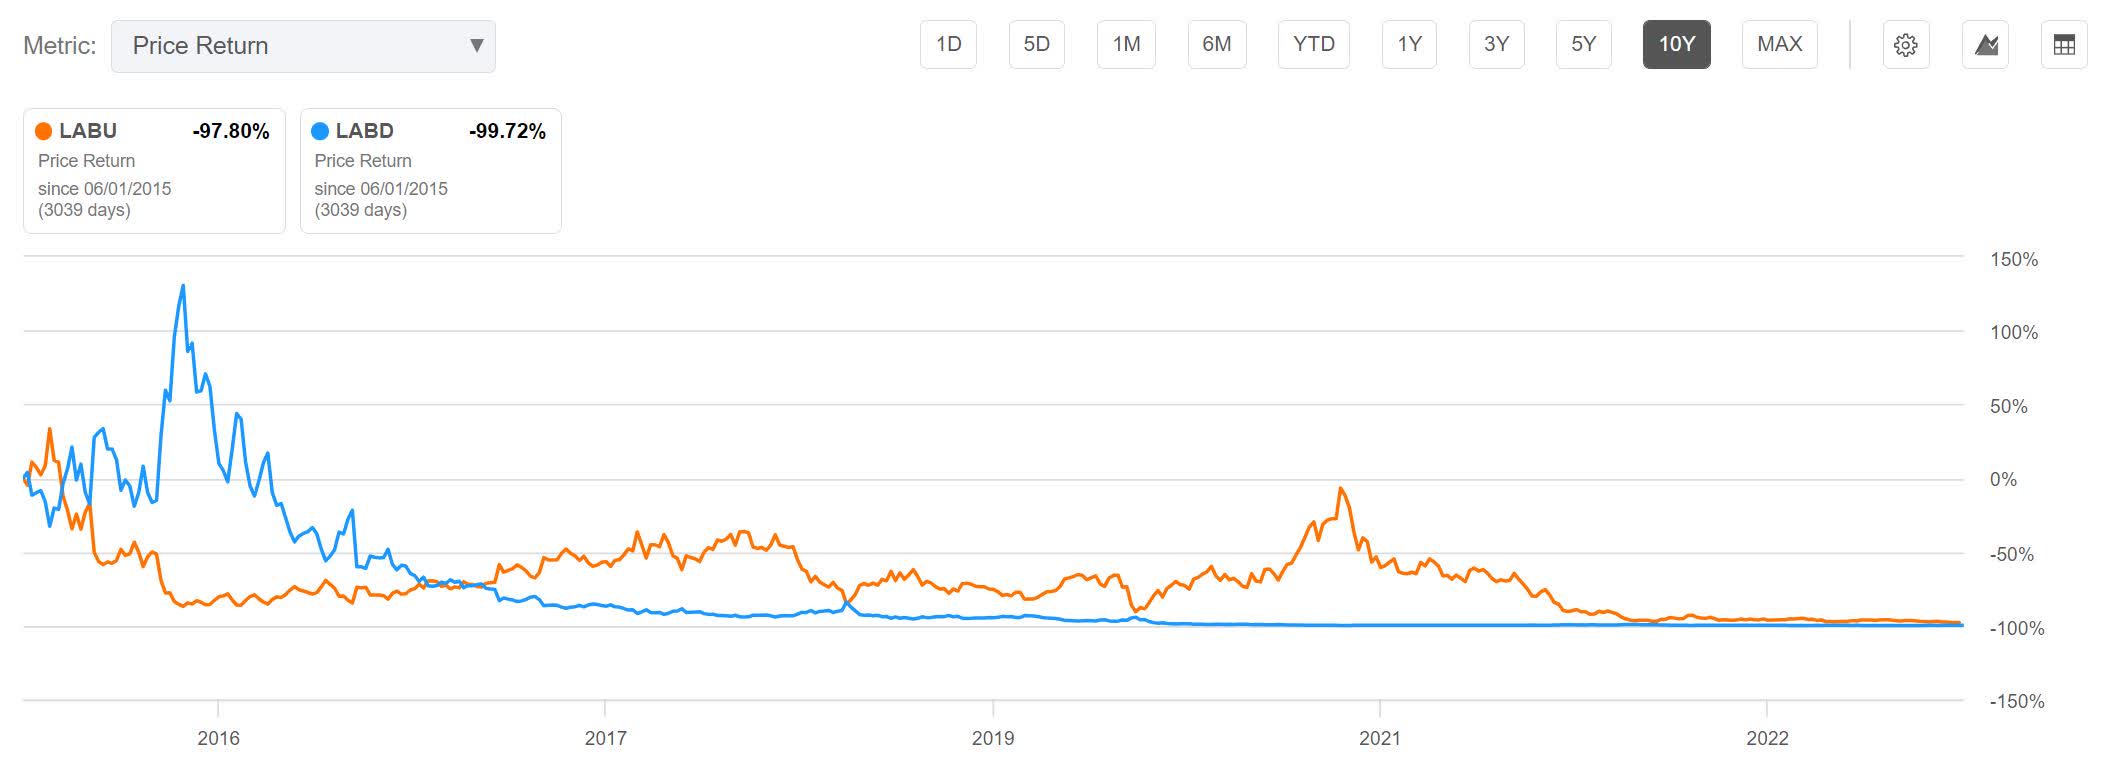
The fund has only been in existence for about 8 years. Since its inception, LABU is down by 97.80% and LABD is down by 99.72%. The short couple would be down by 99.76%.
LABU vs. LABD Since Inception (Seeking Alpha)
Fees
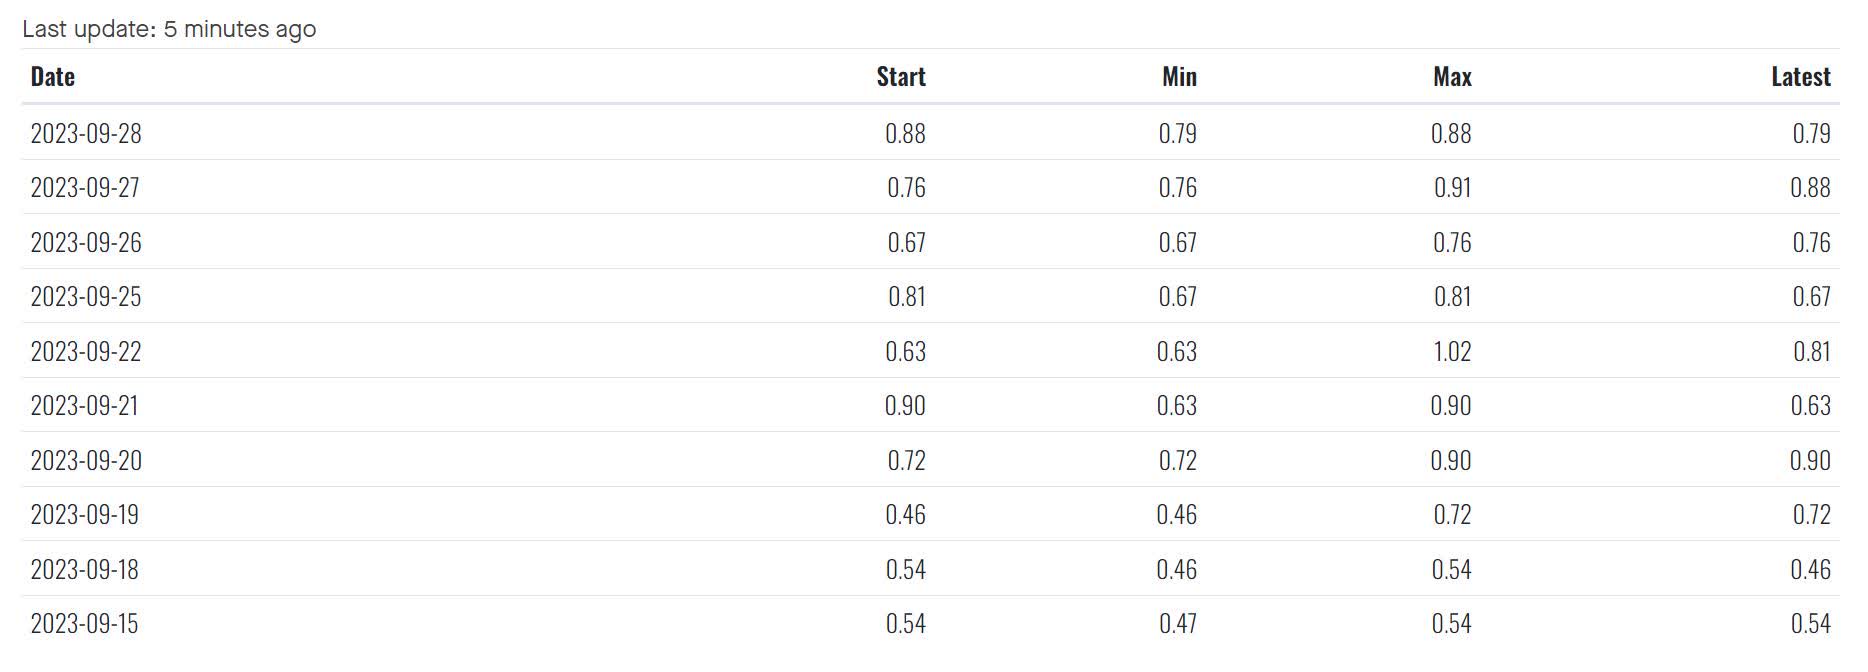
Because this strategy has us shorting both funds, we have to incorporate their annual cost to borrow fees into our estimates. These values vary over time. Using values from the "Latest" column, LABU currently has an average Short Borrow Rate of 0.707%.
LABU Short Borrow Fee Rate (By Author)
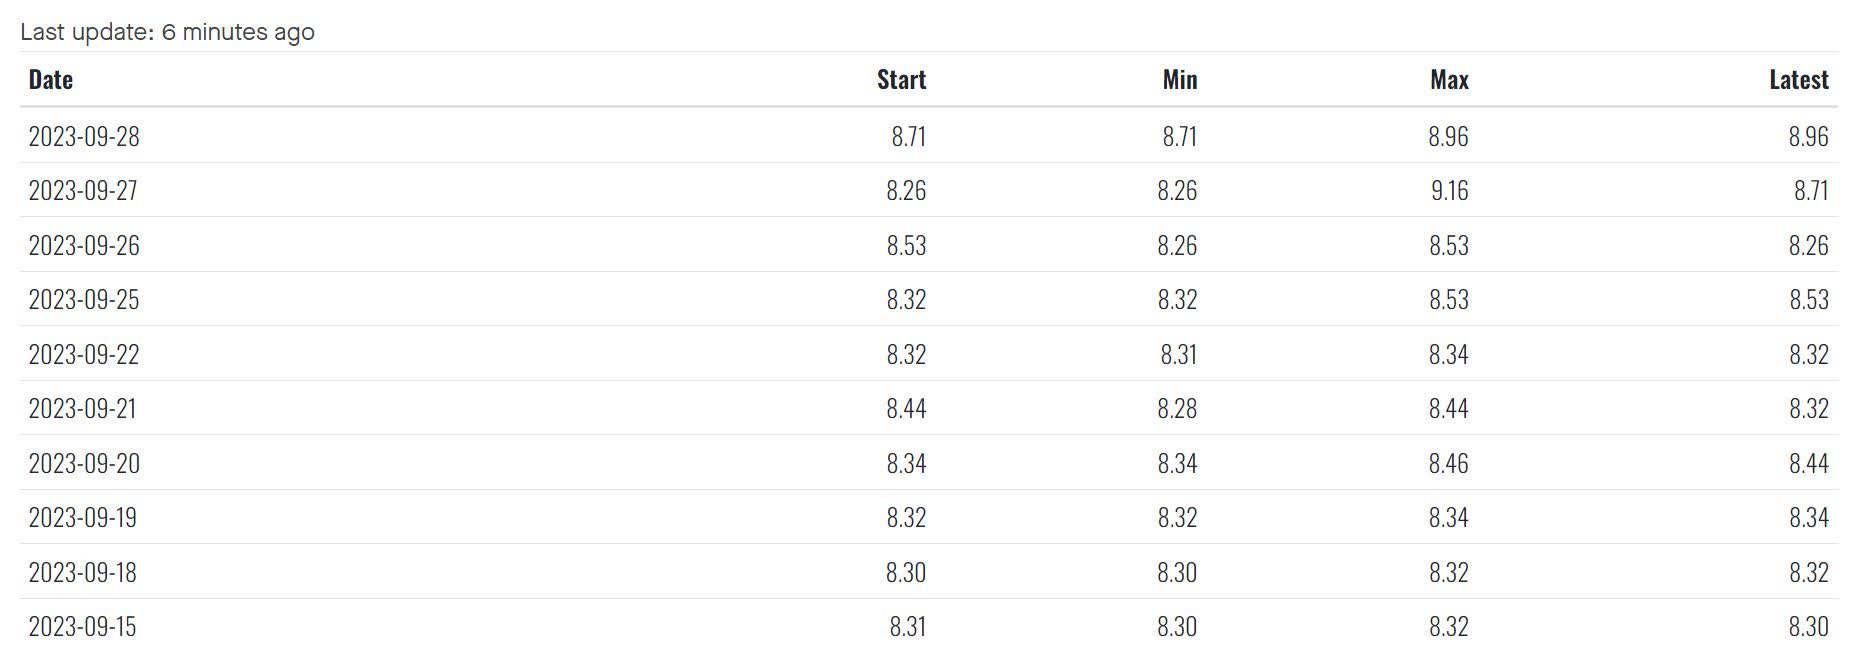
LABD currently has an average Short Borrow Rate of 8.45%.
LABD Short Borrow Fee Rate (By Author)
Negative Yield
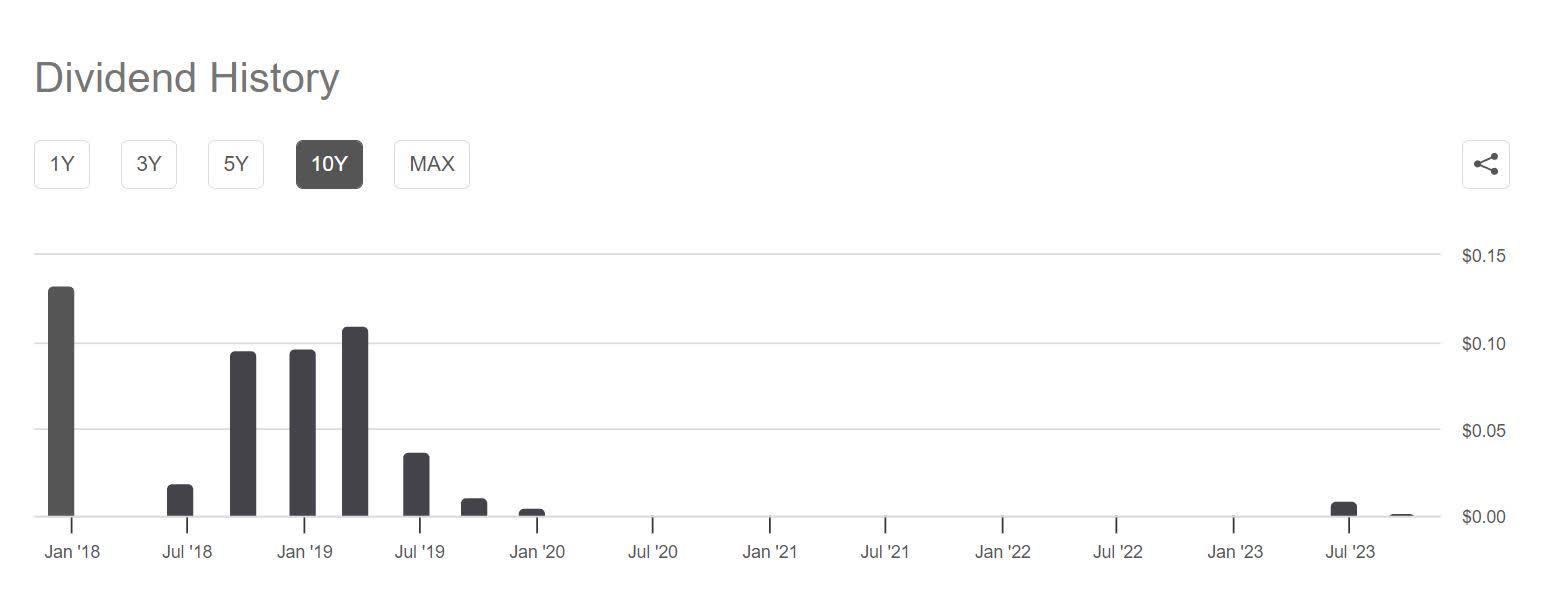
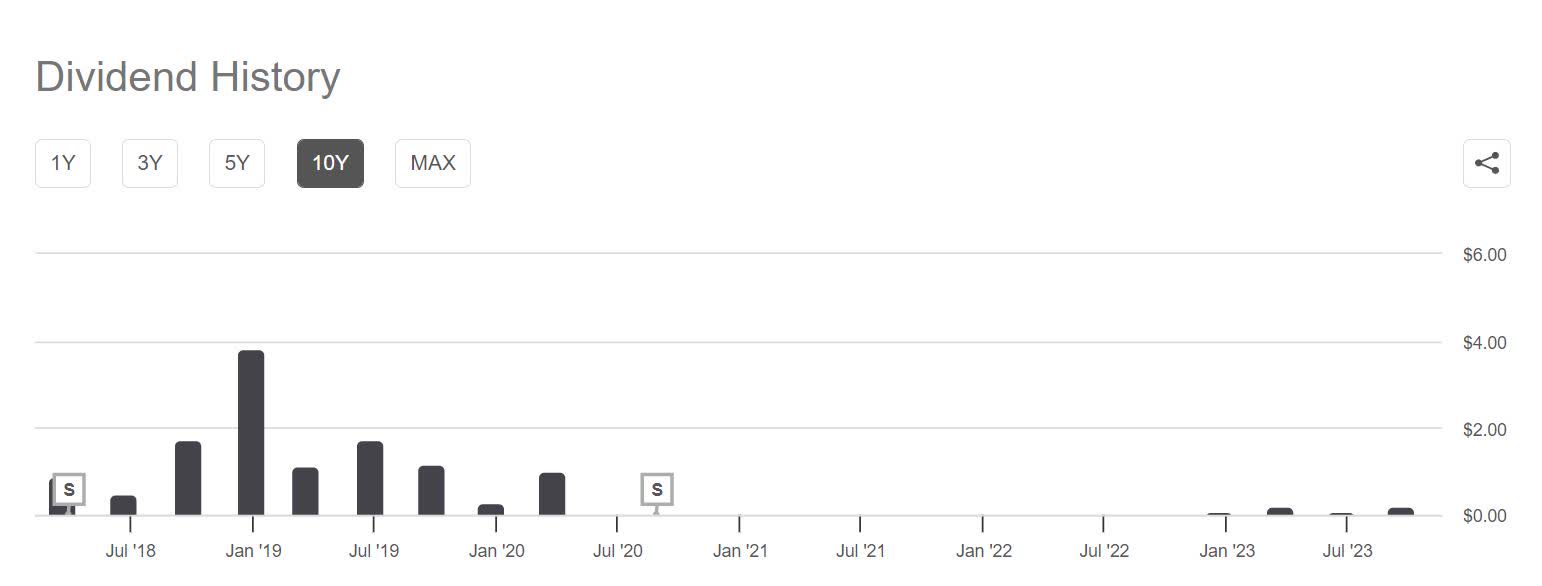
Both leveraged ETFs have been handing out distributions. These values will change over time, but LABU is currently paying a trailing yield of 0.28%, while LABD is paying 2.94%. Since this strategy has us shorting both positions, doing so requires paying out the distribution. Because the NAV of both LABU and LABD will change by any distribution amount, the net effect of paying the distributions should be zero.
LABU Distribution History (By Author) LABD Distribution History (By Author)
Expected Returns
I should note that I am assuming the last year of performance of the S&P Biotechnology Select Industry Index has been within normal behavior. The one-year chart above is showing the short couple up by 33.095%. The management fees and yield of both funds are already included in the price action, but borrowing fees are not.
The short LABU position has experienced a 36.48% gain, but has had to pay 0.707% in borrowing fees. That side of the couple is looking at a 35.773% net gain.
The short LABD position has experienced a 29.71% gain but has had to pay 8.45% in borrowing fees. That side of the couple is looking at an 21.26% net gain.
With both positions weighted evenly, this produces an estimate for annual returns of 28.52% for the low volatility couple.
Risks
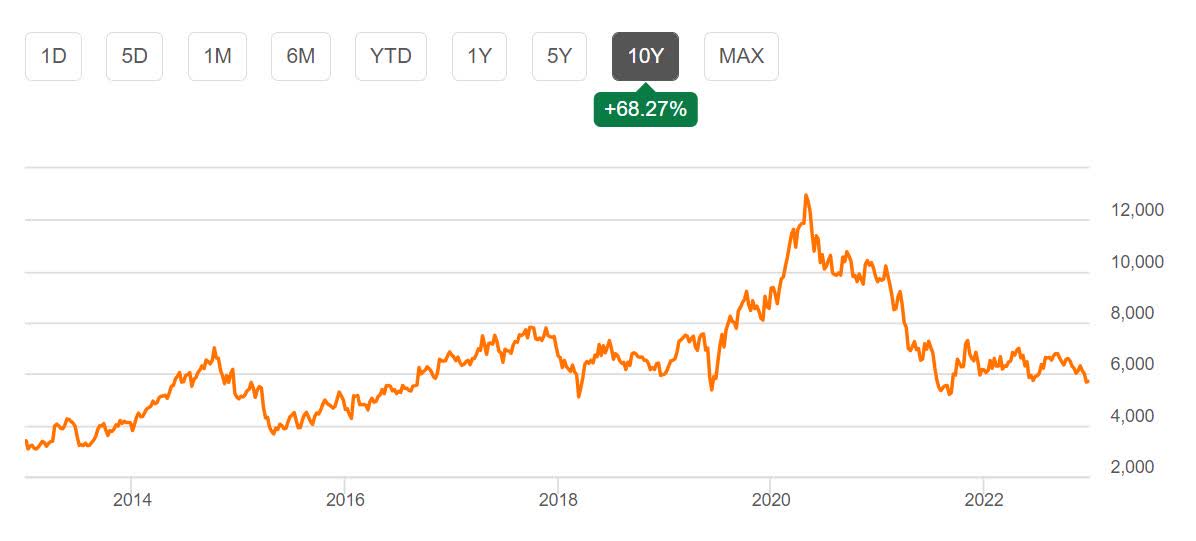
As mentioned above, shorting both funds produces a situation where the couple gains value when its underlying is trading in a range and loses value anytime it maintains a strong trend with few reversions. Below is a 10-Year chart for the S&P Biotechnology Select Industry Index. It experiences both strong trends and periods where it is volatile, yet range bound. Although some trends may be impossible to predict, if another global pandemic were to arrive this trade may become extremely unattractive.
SPSIBI 10-Year (Seeking Alpha)
The rate of erosion is dependent on the volatility of the S&P Biotechnology Select Industry Index. In addition to a risk from strong trends, gains may fall below expectations if the underlying were to enter a period of low volatility.
Even though the borrowing fees are currently manageable, they will vary over time. As the fees increase, the couple becomes less appealing. While this is less of an issue if the borrowing rates are only elevated for a short period of time, if they were to stay elevated, the long-term expectations for gains would have to be lowered.
Catalysts
If the underlying were to experience violent moves with more frequency in the future than it has in the past, the couple may perform better than expectations. Potentially, this becomes even more attractive if the violent moves maintain a range instead of establishing a trend.
Conclusions
I believe this LABU vs. LABD couple is a more attractive pairs trade than some of the others I have examined. The strongest trends in their underlying were as a result of a global pandemic, so if a new pandemic appears to be breaking out, the position could be closed. Outside the huge rally and drop caused by that event, the S&P Biotechnology Select Industry Index has maintained a high volatility range since 2018.
I began researching margin portfolios several months ago and was initially planning on generating cash flow from covered call ETFs, while mitigating their erosion by forming pairs trades and regularly rebalancing. I found the erosion rate gained from using short leveraged positions as hedges were attractive on their own. The more I research these double-short triple leveraged pairs trades, the more attractive I find them.
I suspect I am still 2 or 3 months from running low on high quality targets to research before I should design a rough draft of the portfolio and paper trade it to become more familiar with its mechanics. I am aiming to design a portfolio which I would feel comfortable running with significant levels of margin, then adding a safety factor by dialing down how much margin it is using while maintaining more of a cash cushion than is statistically necessary.
For further details see:
LABU And LABD: Another Attractive Double-Short Pairs Trade