LRCX - Lam Research: The Relationship Between Market Share And R&D Spend
2023-12-15 12:22:38 ET
Summary
- Equipment revenues have varied greatly over the past eight years, impacting market share among peers.
- Market share among semiconductor equipment companies has fluctuated, with Lam Research and Applied Materials losing share and ASML gaining share.
- Over the past five years, Lam's R&D spend has not kept pace with peers as the company has lost market share to ASML and Applied Materials.
- R&D spend as a percentage of revenue has been decreasing for all three companies.
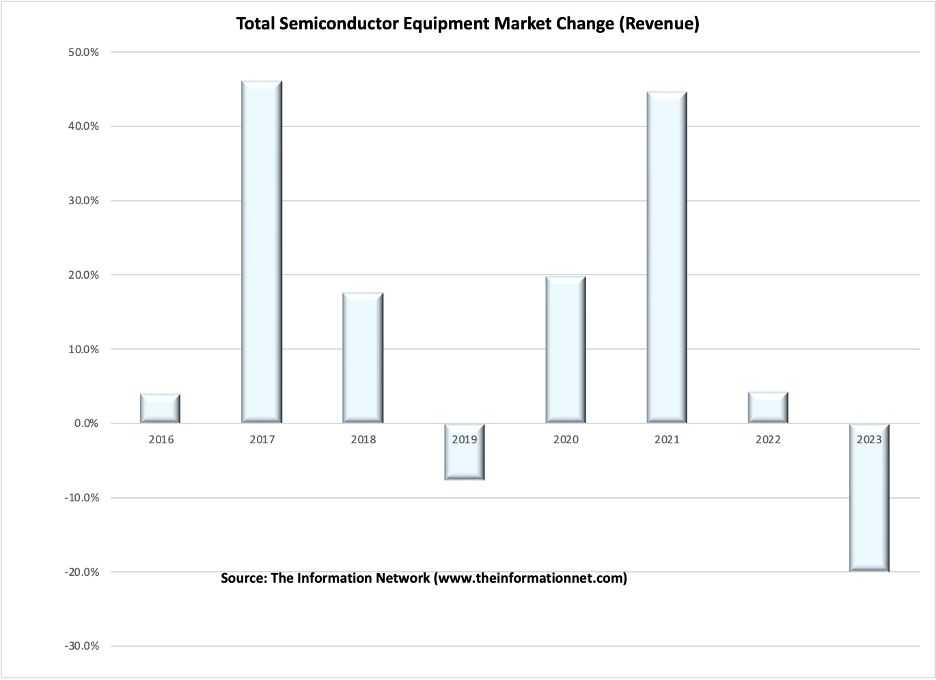
There are numerous factors they affect revenue growth and corresponding share of the market among peers. Over the past eight years, equipment revenues have varied greatly from year to year, as illustrated in Chart 1, according to The Information Network's report Global Semiconductor Equipment: Markets, Market Shares and Market Forecasts.
Chart 1
In this article, I discuss Lam Research ( LRCX ) and its relationship between R&D (research and development) spend and market share. I also compare this same relationship for Applied Materials ( AMAT ) and ASML ( ASML ), two top equipment suppliers.
R&D spend is not like capex spend, where results are manifested a year or so after the equipment is purchased. With R&D, products may never reach production, so the "R" may be upper case but the "d" lower case.
I am reminded by my days working at Bell Labs, the foremost research institution in the world at the time. Above the entrance to the auditorium in Murray Hill, NJ was this quote, which I still remember (but don't remember whom it is attributed to):
"Research is the effort of the mind to comprehend relationships which no one has previously known. And in its greatest exemplification, it is practical as well as theoretical, demanding common sense and uncommon ability."
This article also provides an insight into a company's strategy in planning. A key premise is the greater the R&D spend, the greater a company's market growth as it introduces new products in an assembly line fashion.
Market Share 2015-2023
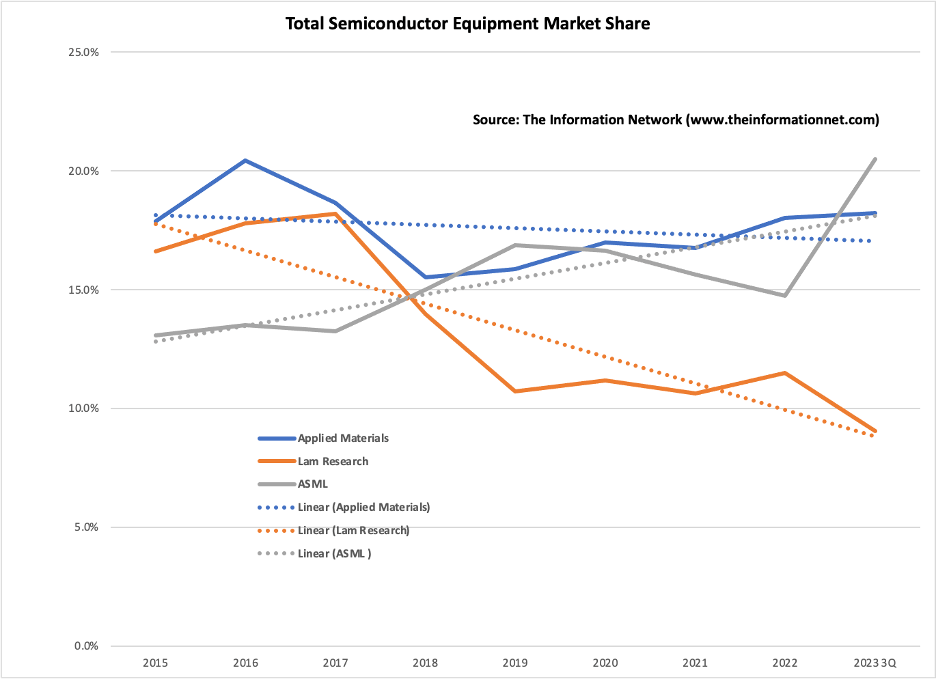
Chart 2 shows market share between 2015 and 2023 (estimated based on three quarters of revenue).
Lam Research had been losing share from the memory market crash in 2018-2019, and again in 2023 as memory companies drastically cut back purchases of equipment following the mark collapse in 2022.
Applied Materials' market share has been relatively flat over this period, and lost its #1 position to ASML in 2019 (despite taking $311 million from 2018 revenues and putting them into 2019) and will lose the lead in 2023 again to ASML. I discussed this in my December 5, 2023 Seeking Alpha article entitled " Applied Materials: Weak Earnings Means ASML Takes Over The #1 Equipment Spot In 2023 ."
But the important issue is the trendline, (blue dotted line) which has a downward slope, indicating the continued loss of market share to competitors.
Chart 2
ASML's share has been increasing from multiple sales of its EUV scanner, priced above $150 million and 2x the price of its DUV system. Revenues have also increased in the past few years as a result of Chinese companies hoarding DUV systems and ultimately paying for them in 2023) in expectation of U.S. sanctions prohibiting imports. Importantly, the trendline (grey dotted line) is up significantly for the company.
R&D Spend
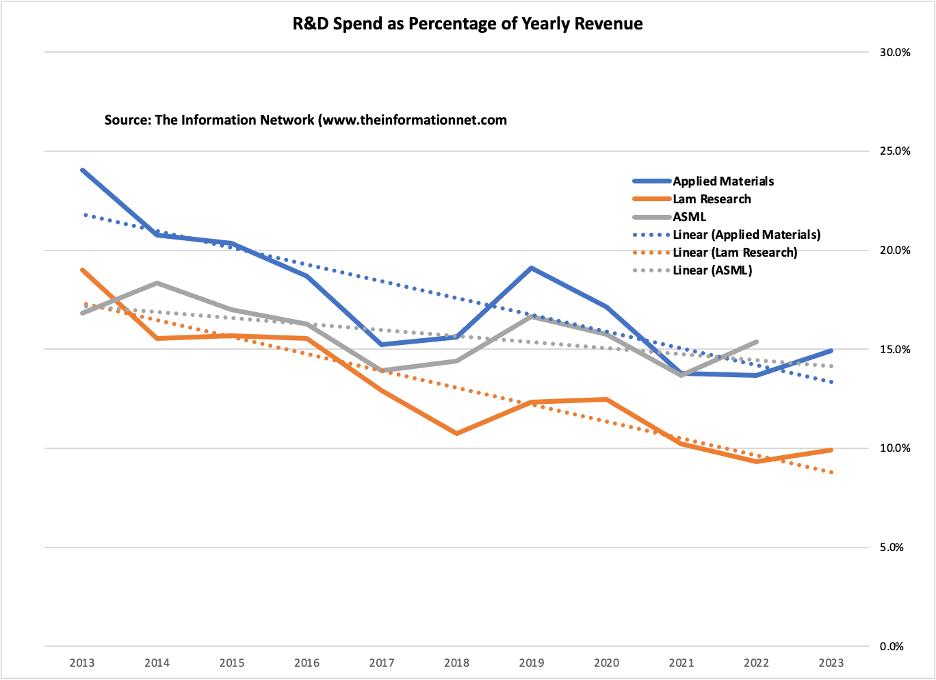
In Chart 3, I show R&D spend as a percentage of yearly revenue for the three semi cap companies between 2013 and 2023.
For Applied Materials, I only included the Semiconductor Systems and Display sectors but not Global Services, which doesn't need much R&D spend if any. In fiscal 2023, AMAT's ratio was 14.9%. But if Global Services was included, it would have been 11.7%.
It is interesting to note that the timelines of AMAT (blue dotted line) and LRCX (orange dotted line) are parallel and decreasing. AMAT's R&D spend in fiscal 2023 was $3,102 million versus $1,727 million for LRCX.
ASML's timeline (grey dotted line) has a less negative slope but comparable R&D spend. With ASML's fiscal year on a calendar year, Q4 2023 has not been reported.
Chart 3
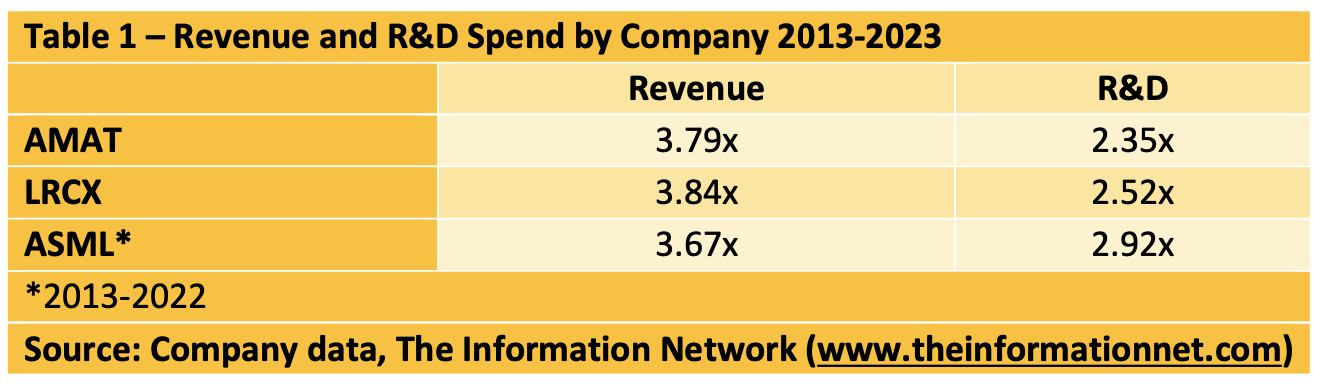
In Table 1, I compare actual Revenue and R&D changes between 2013 and 2023 (to 2022 for ASML). Of note, the three companies all increased revenues at a comparable rate over this 10-year period. At the same time, R&D spend for AMAT and LRCX are comparable, with ASML slightly higher.
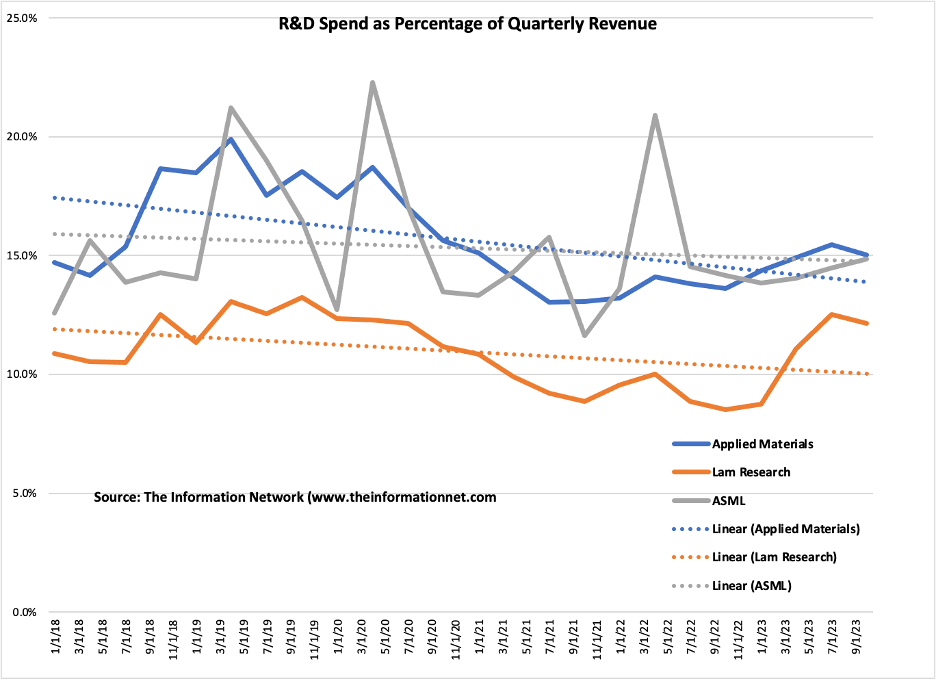
In Chart 4, I show R&D spend as a percentage of quarterly revenue for the three semi cap companies between 1/31/18 and 10/31/23.
For this five-year period, we see that ASML's trendline is flat, as the company expanded R&D spend. The trendlines of AMAT and LRCX are both negative, with the slope of AMAT more so, indicating a reduction of R&D compared to LRCX.
The rapid rise in the R&D ratio for LRCX in the past three quarters is not due to an increase in R&D spend, but to a decrease in revenues.
Chart 4
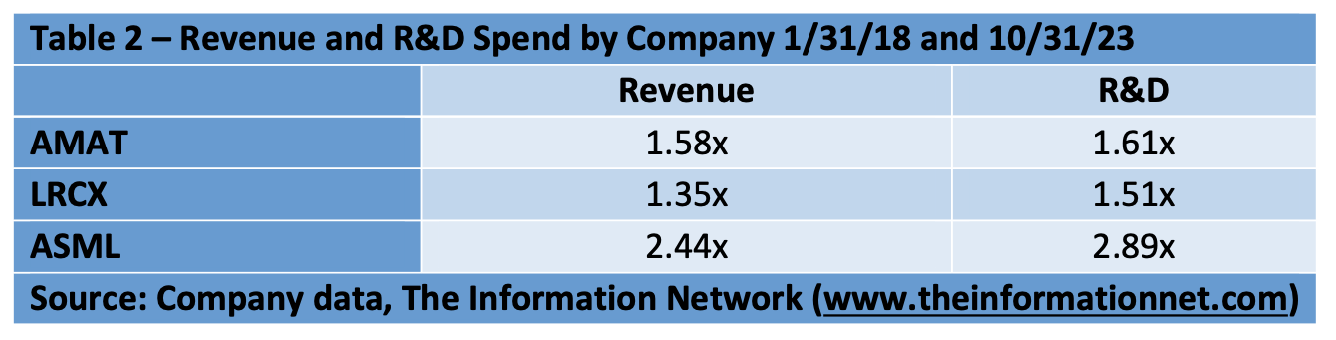
In Table 2, I compare actual Revenue and R&D changes between 1/31/18 and 10/31/23. Of note is that Revenues and R&D spend for AMAT and LRCX are comparable. However, ASML revenue growth during this 5-year period is 50% higher and R&D spend 85% higher.
Summary
Over the past 10 years, the three semiconductor equipment companies analyzed in this article have been reducing the amount of R&D spend as a percentage of revenues (Charts 3 and 4). What has happened is that R&D spend is increasing, but Revenue is increasing at a greater rate (Tables 1 and 2).
Comparing market share (Chart 2) with R&D as a percentage of revenue shows similar trends for LRCX and AMAT (Charts 3 and 4) - all trendlines have a negative slope.
ASML is different as it has a limited competition in i-line and DUV lithography systems, and no competition in EUV lithography. However, it is important to note that market share data in Chart 2 is for the entire semiconductor equipment industry, so any share loss is not necessarily against a single competitor. But YoY growth for a company, if less than the industry as a whole, will result in share loss. Thus, ASML's YoY revenue growth has been exceeding the overall market.
But Chart 5 shows that all these scholastic analyses I've done in this article do appear to matter to the Street. Over a 5-year period, the share price of LRCX has increased 453%, greater than AMAT at 380%, and ASML at 360%. These growth rates are directly opposite share price change.
Growth has outpaced the S&P Technology Sector ( IXT ), exhibiting a growth of just 189%.
YCharts
Chart 5
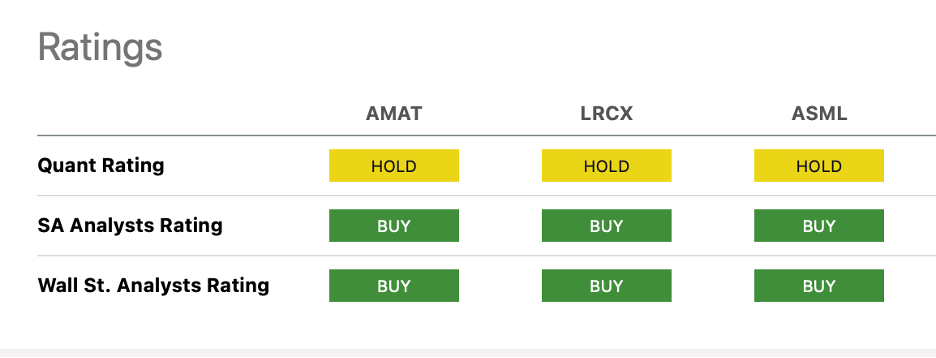
Chart 6 shows Seeking Alpha's Quant Ratings, which are a Hold for all three companies. I agree and reaffirm my Hold rating on LRCX.
Chart 6
For further details see:
Lam Research: The Relationship Between Market Share And R&D Spend