LNTH - Lantheus: Wedging Up To Resistance Testing Key Retracement Levels (Technical Analysis)
Summary
- Investors allocating on weakness within new-year rally.
- Stock wedging up to previous resistance marks, testing key retracement levels.
- Heavy inflows into LNTH equity into the New Year as well, correlating to the rally off lows.
- Net-net, reiterate buy, searching for short-term targets of ~$70 to confirm a continuation back to long-term range.
Investment Summary
Building on our previous buy thesis on Lantheus Holdings, Inc. ( LNTH ) the stock has congested sideways and now looks to have curled up of a bottom. We subsequently examined the price structure to understand if there was scope for additional allocation to maximise the upside potential. Here I'll run through an in-depth technical look using a blend of price studies and market generated data to guide positioning leading into the company's upcoming FY22' earnings.
Net-net, there are identifiable headwinds for LNTH, yet, we are long-term oriented investors and our fundamental findings continue to justify a buy rating. Read the previous publication here:
Analysis of LNTH price action
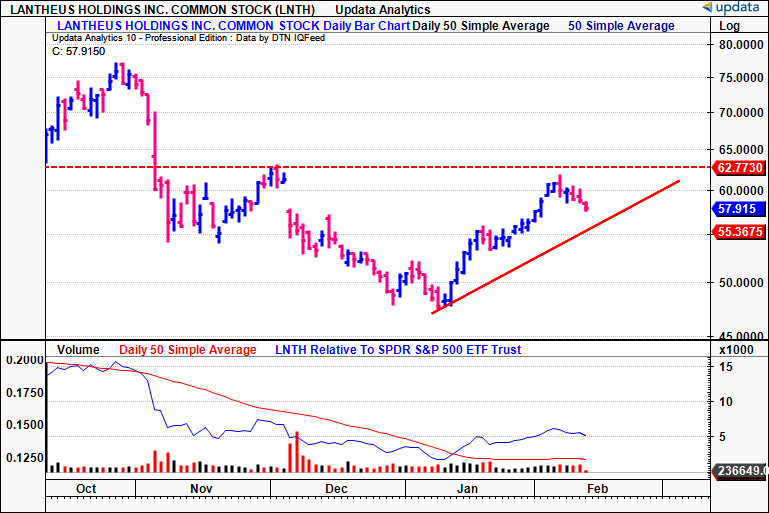
LNTH is pushing up off a 6-month low and forming an ascending triangle with the November FY22' high as its top. It is wedging up at the mouth, however faced resistance when attempting to break this mark in January. Looking at the daily chart below, volume spikes have been absent, and longs have accumulated at a slower pace than in previous rallies. Importantly, the stock filled its gap from November, and should it continue at the current trajectory there's scope for it to break above the resistance level shown.
Exhibit 1. LNTH wedging up in ascending triangle pushing toward resistance
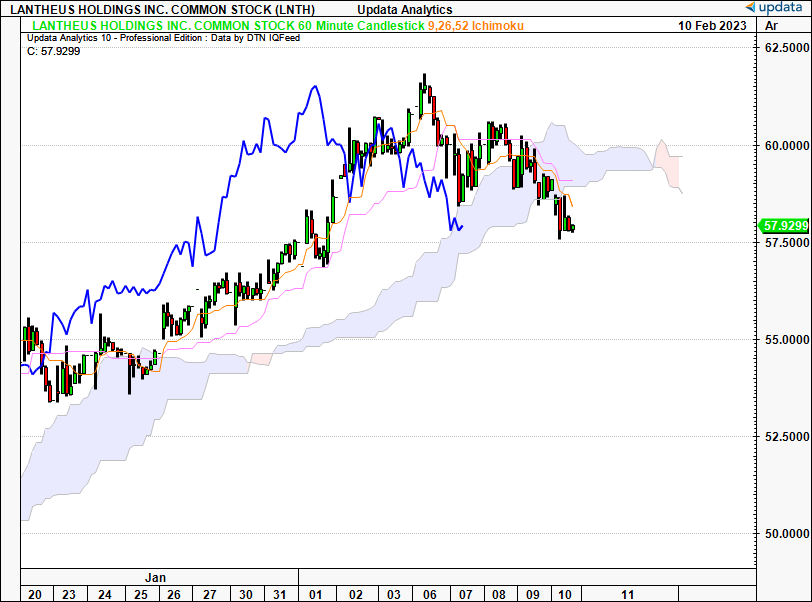
As to where we are within the trend, the answer depends on what time horizon we are looking at. In fact, as to price visibility looking ahead, this is a point we'll be alluding to constantly – i.e., Question: "w hat is the trend, and what are the targets? ", answer: " it depends on your time horizon ". There's no better trend indicators available than cloud charts, by estimation. Looking at the 60-minute chart, that looks to the coming days [short-term], the price line crossed the cloud back in February, whereas the lagging line is testing the cloud top. We're not yet ready to call this a reversal, until both lines have crossed. Note, back in January, LNTH pushed off the cloud top and this could bode in well for its propensity to move back up into the cloud. We are reluctant to allocate on the shorter-term time frame.
Exhibit 2. Price line crossed beneath the cloud on 60-minute frame
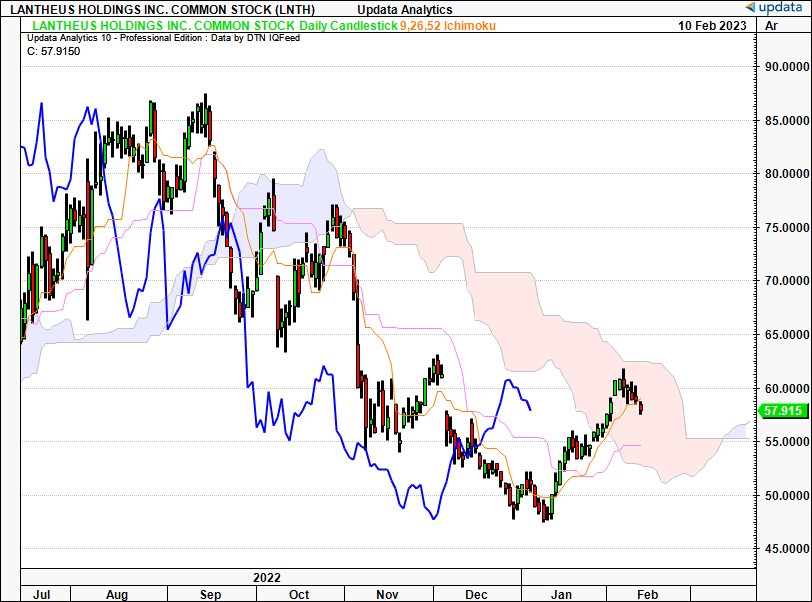
Moving to the daily chart, that takes a medium term horizon and looks to the coming weeks, the price line has crossed back up into the cloud, but hasn't broken the cloud top. The lagging line is still beneath the cloud. Both crossed to the downside back in September, testing the cloud, and failed 2x. Given the reversal in January we are looking for a continuation of the upside to see LNTH cross back into bullish territory in order to size up the position on the daily frame. We are neutral on this chart.
Exhibit 3. Trend curling up into the cloud on daily frame, lagging line yet to break the cloud base
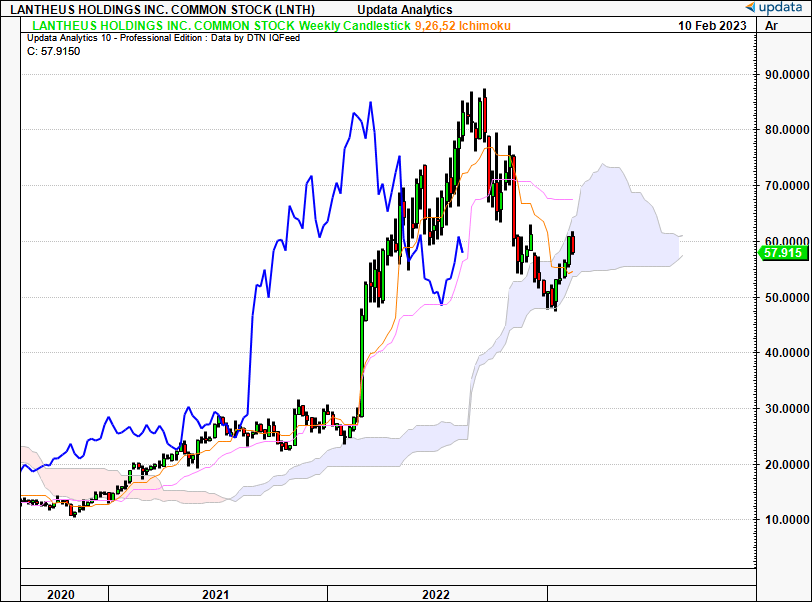
Finally, with the weekly chart, we are still bullish on the longer-term time frame. This looks to the coming months. Importantly, the lagging line is still positioned above the cloud, meaning we haven't yet turned bearish. Moreover, there's been good confluence to the cloud base with LNTH bouncing off this mark in January. It now tests the top of the cloud as resistance. We have support at ~$55 looking out in to March based on this chart.
Exhibit 4. Bullish reversal testing the cloud on weekly chart
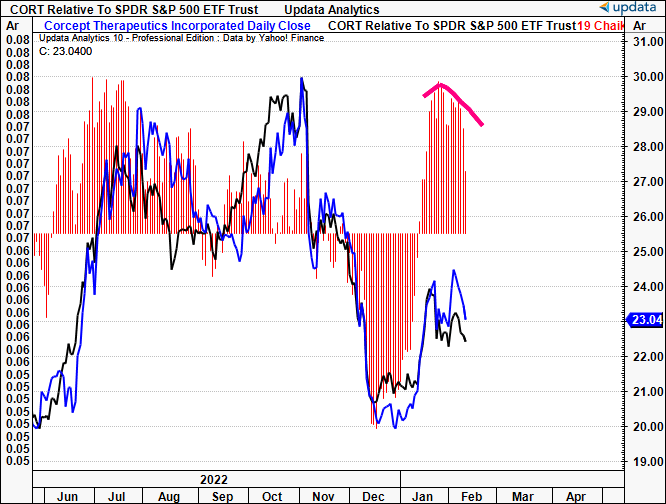
As to the money flows, investors have been buying this rally with a sharp reversal to inflows as of January. This came up from a period of heavy outflows where the stock bottomed. The rate of change in inflows has curled over in the last few days, yet, serves as good initial indication demand has arrived to fuel a further snapback rally. We are constructive on this particularly heading into the company's FY22' earnings.
Exhibit 5. Daily money flows into LNTH equity pushing to inflows
The quality of buyer has been a good indicator to work by as well. Judging from the negative value index ("NVI") shown below, it has shifted up in tandem with the price change. This is important, as the NVI typically demonstrates the presence of institutional/sophisticated buyers, as these investors are mandated to allocate to longs as a percentage of a stocks daily liquidity in dollar terms. Hence, if it ticks up on low-volume days, it indicates accumulation from funds/institutions, as the dollar volume will be low, meaning they can allocate larger relative positions. This tells us that sophisticated risk capital has participated in the rally.
Exhibit 6. Accumulation from funds/institutions looks to be apparent with this latest rally
Data: Updata
Market generated data to guide price visibility, positioning
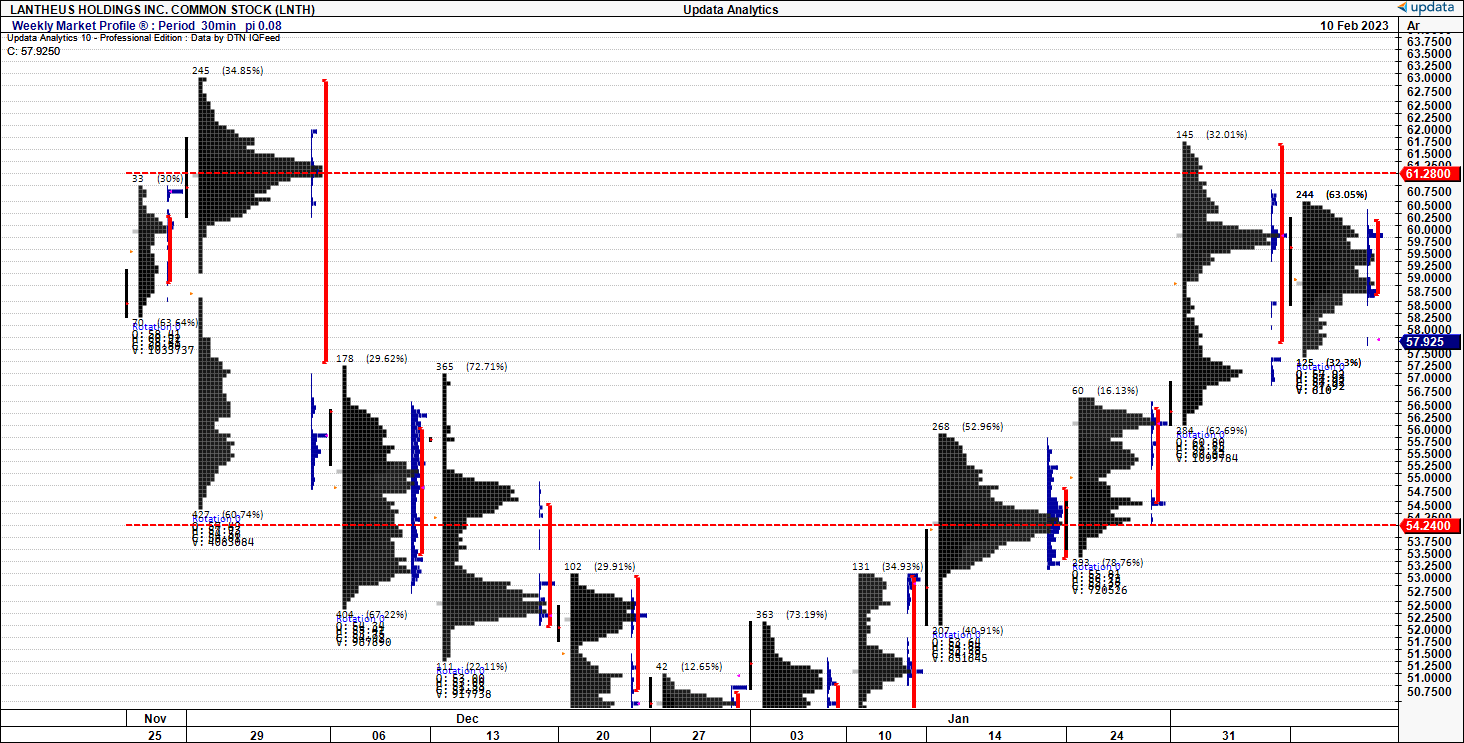
Turning to the weekly market profile, we've got a good view of the price structure and where to look for key buying points looking ahead. You'll see in Exhibit 7 that weekly price action has ticked up off lows through December. Key takeouts from this structure, is that the point of control ("POC") has made a swift recovery back to the POC of November. As a reminder, the POC is where the stock price spent the most time over each weekly period, and is a measure of the market's estimate of fair value. Subsequently, the market is gaining more confidence in rating LNTH back at its November marks.
Exhibit 7. Weekly POC shifting back to November range, market more comfortable in pricing LNTH at this mark
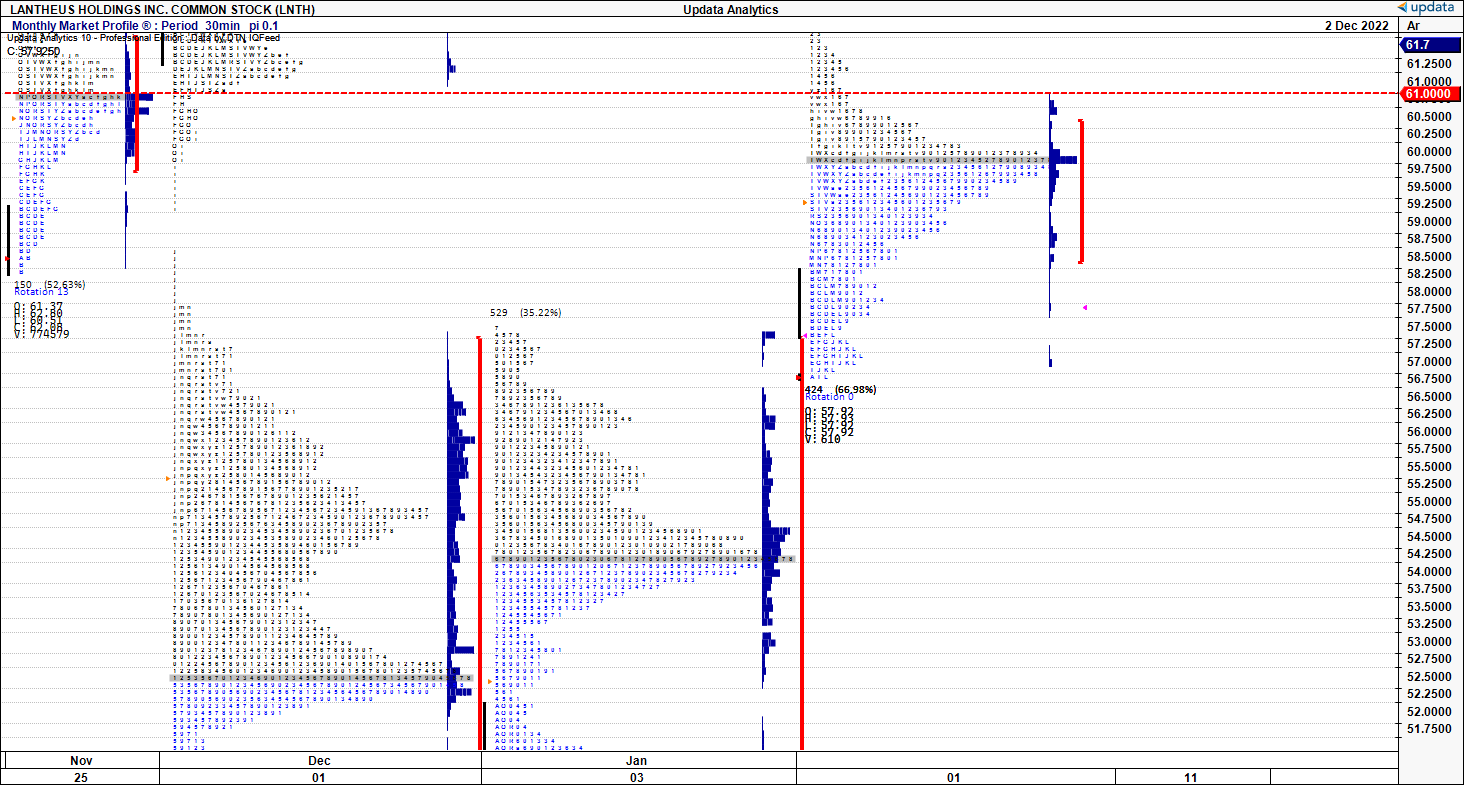
Looking in more detail at the monthly market profile, the distribution of value buyers has been heavily skewed below the POC in January and February. Again, this gives good evidence of the price structure reforming towards a November range, as there's strong demand below the market's equilibrium. Seeing the depth at which the time-price opportunities [blue zones] is distributed below the POC in January and February, and the bias below the POC, it shows that investors have been allocating on each point of weakness in the short-term rally. We believe there is confidence building from longs, and are happy to allocate on weakness based on this data.
Exhibit 8. Monthly market profile showing heavy demand skew below the Jan and Feb POC, showing investors are buying on weakness
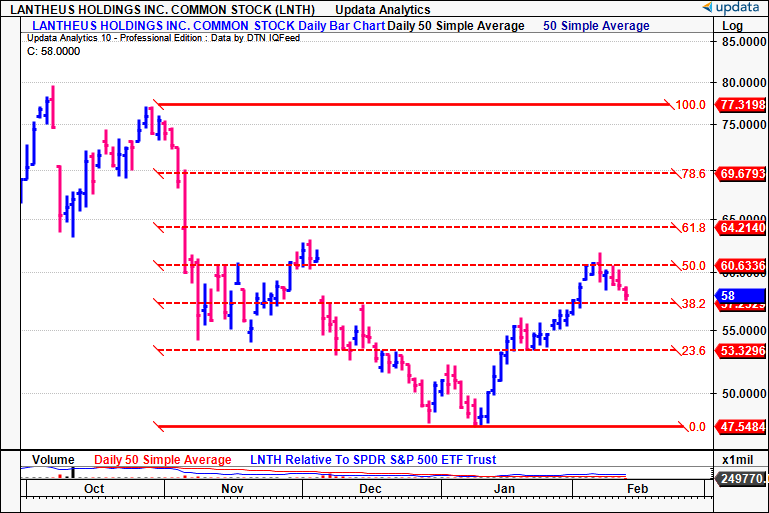
Looking to identifiable targets, tracing the fibs down from the last October high to the December and January double bottom, we see the stock has tested a 50% recovery of the downside. It failed to break through at this mark, however, and is now back testing the 38% channel. It filled the November gap, as mentioned, and needs to thrust off this mark in order for a continuation. Should it break higher, we are looking to $64 then $69, following by a $77 target range. If it breaks lower, the next targets are $53, then $47. The market profile shown above provides good evidence that investors are active in this most recent pullback, laying weight to the upside targets.
Exhibit 9. Looking for a break to $64, then $69
We subsequently have upside targets to $69 based on the new-year rally. This conforms to the fibonacci levels described above. Hence, we are looking for investors to allocate on this week's weakness [where the market profile indicated demand is entering in this fashion] and for LNTH to thrust off its current mark to the $69 level. We valued the stock with a long-term buy of $142, and have this target in mind if it pushes back to the ~$70 range.
Exhibit 10. Upside targets to $69
Data: Updata
In short
Based on the culmination of data presented in this report we believe there's scope for investors to keep adding on weakness if already long. This will be our strategy, looking for a medium-term re-rating back to $69 as confirmation we are pushing to our long-term price objective. We look forward to checking back in after LNTH's FY22' earnings towards the end of this month. Hence, reiterate LNTH as a long-term buy.
For further details see:
Lantheus: Wedging Up To Resistance, Testing Key Retracement Levels (Technical Analysis)