SHV - Largest Market Topping Signal Since August As Fed Considers 50 Bps Rate Hike
Summary
- February 21st triggered the first negative market signal in 2023 and the largest negative signal since August 2022.
- The last time the Momentum Gauges® turned negative from the highest peak positive levels since August, the S&P 500 declined -16.2% over the next 10 weeks.
- February averages the 2nd worst month of the year since 1927 and the second half of the month averages worse than the first half.
- Our early negative signal alerted on February 3rd and bear funds in the Active ETF portfolio have gained FNGD +19.9%, YANG +24.2%, DRV +19.3% and SQQQ +16.1%.
- Market indices and stock giants MSFT and AAPL are all testing key support levels in technical breakdown conditions.
Introduction
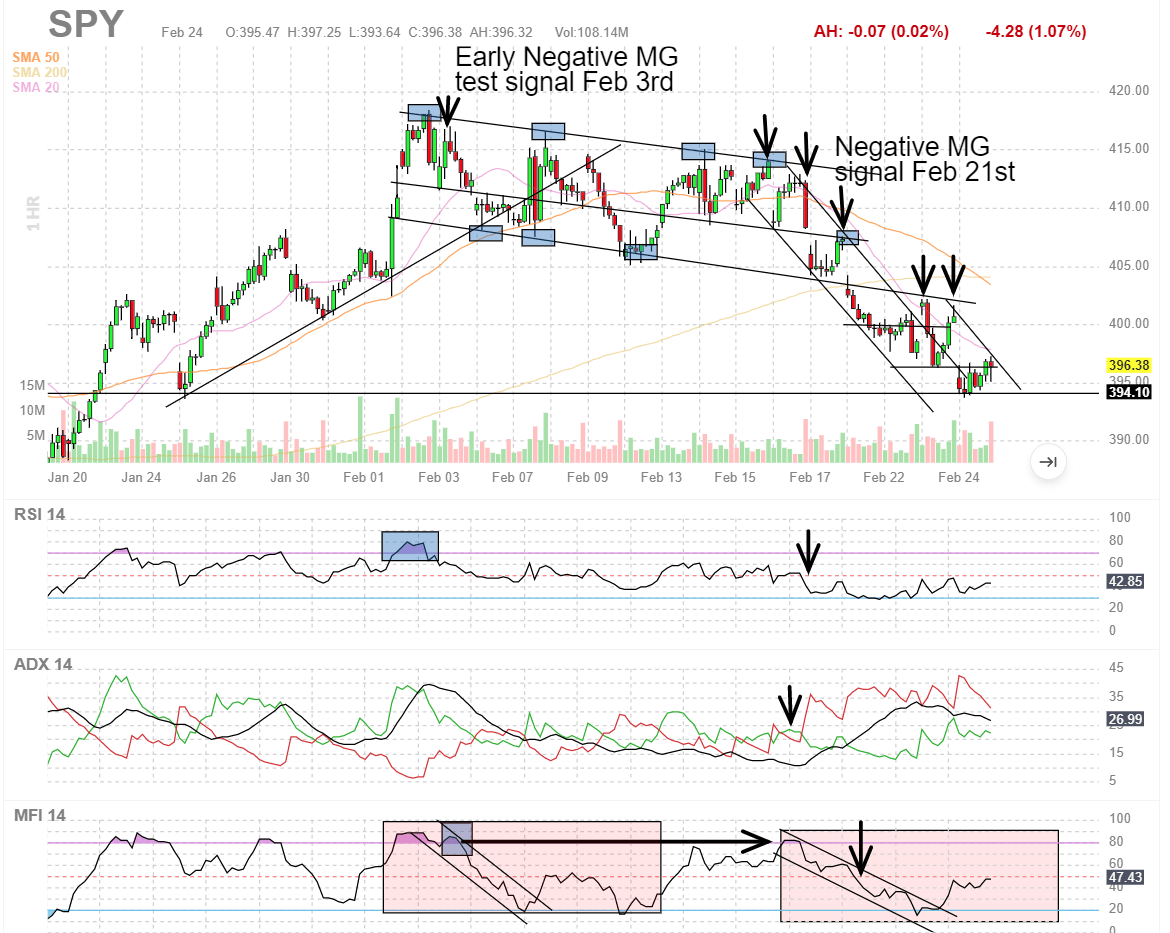
February 3rd marked an early negative Momentum Gauge® signal with an official negative signal on February 21st. This article builds on prior signal event articles with more explanations on how to benefit from one of the most popular features of the Value & Momentum Breakouts marketplace service. As more data points are collected, more insights are gained.
This article serves to answer key questions about the current negative signal and prepare readers for the potential of more downside risk in the short term.
Forecasting the Markets for 2023
Followers of my market articles and members of my community were well prepared for the largest weekly downturn of 2023 this past week. Many of us were positioned in bear funds from the early part of February, just based on the cyclical patterns of February I cautioned about last month:
- Cyclical Rally Faces A February Reckoning
- Forecasting The S&P 500 For 2023: Year Of The Fed-Pivot And More Record Volatility ( SP500 )
- Charting The Worst Market In Over 30 Years Of Trading Toward A Hard Landing
- September Validates 4th Major 2022 Momentum Gauge Topping Signal (Technical Analysis)
The current market conditions are consistent with my long-term forecast article for 2023 with declines until the Fed completely terminates their ongoing tightening policies. Fed pivot-buyers will continue to be disappointed as long as market liquidity continues to drain from the Fed and from sharp reductions in corporate buybacks.
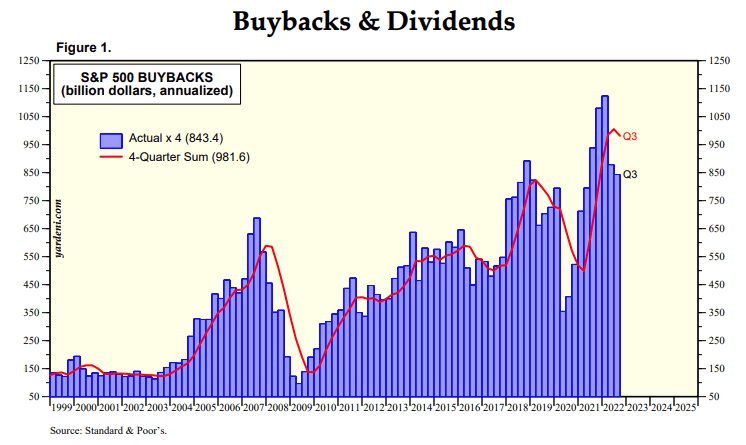
As corporate buybacks decline toward a 3rd consecutive quarter of lower share repurchases in a sharply rising interest rate environment, we are headed toward the largest declines in buybacks since late 2007. Some analysts have calculated that corporate buybacks account for as much as 11% of market gains over the past ten years.
Examining The Charts And Signals Of The Current Decline
The last negative signal we received was on December 5th that preceded a positive signal into January for a very exuberant rally to prior August levels. S&P 500 average valuations have been pushed back up to levels around 18.6 P/E nearly as high as the start of 2022 even as more than 25% of companies in the index for Q4 have missed estimates or guided lower for the year.
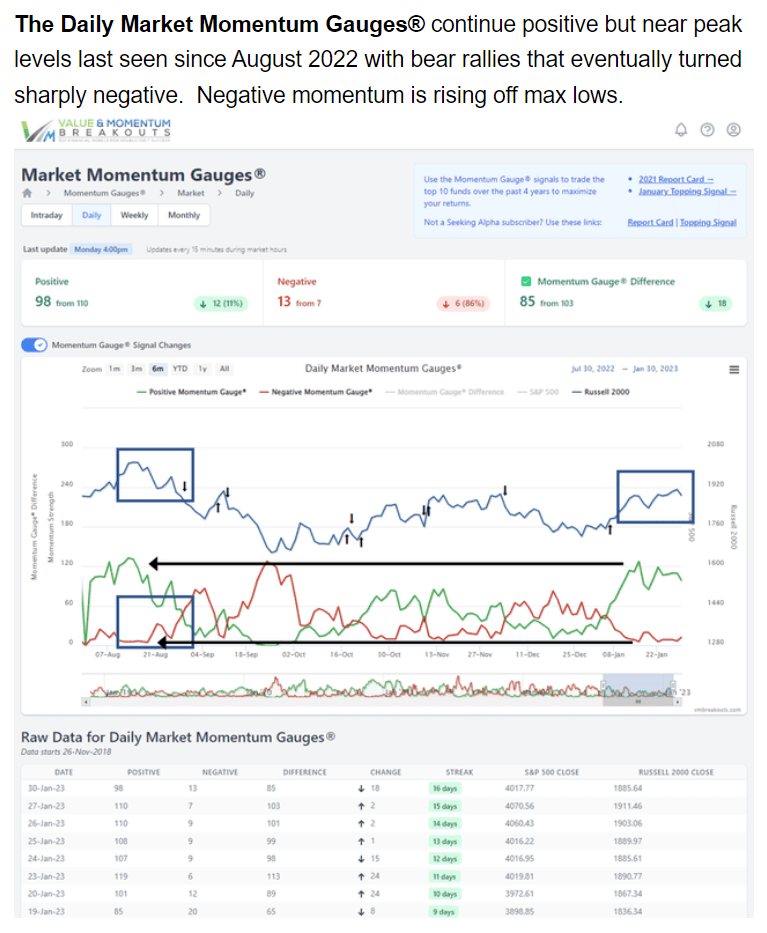
Back in January the daily momentum gauges were giving us strong early warning signals as I wrote about in my market articles. The green positive momentum values reached the highest levels since August, while the negative momentum was nearly at zero reflecting peak exuberance into January.
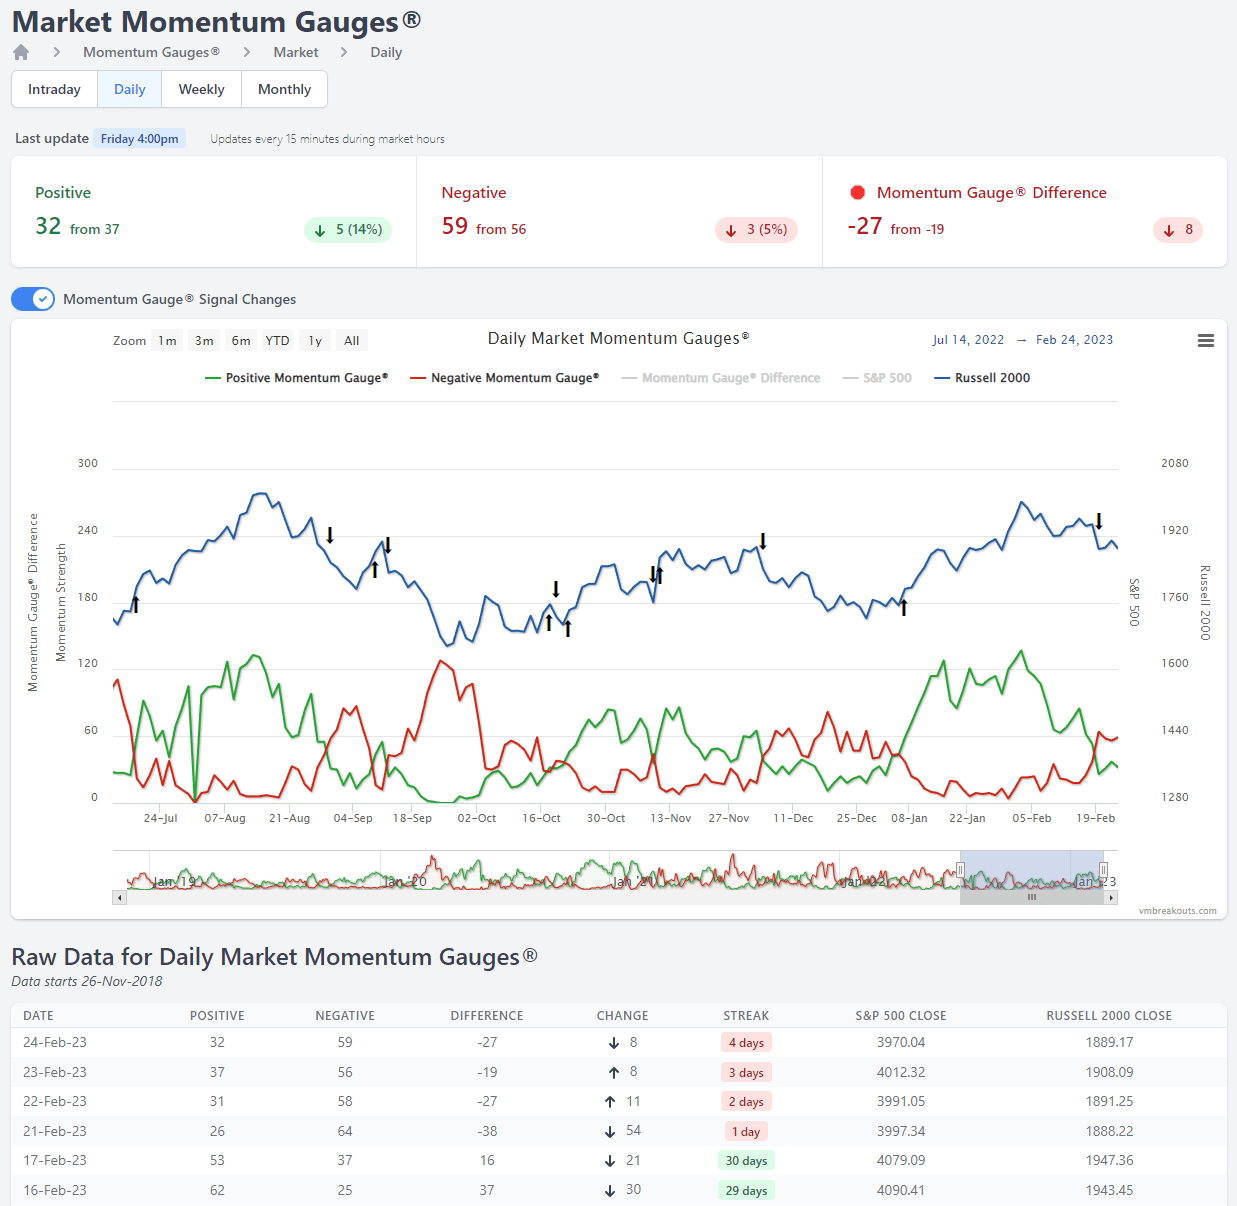
The gauges are shown below as they closed this Friday and officially turned negative at the start of the week. The early negative signal measured by 3 consecutive days of declining positive momentum began February 3rd, near the peak of the positive momentum. The negative momentum has now moved above the positive momentum in the signal shown below. The next question will be, "How high will negative momentum go this time before the market recovers and will it go as high as last September?"
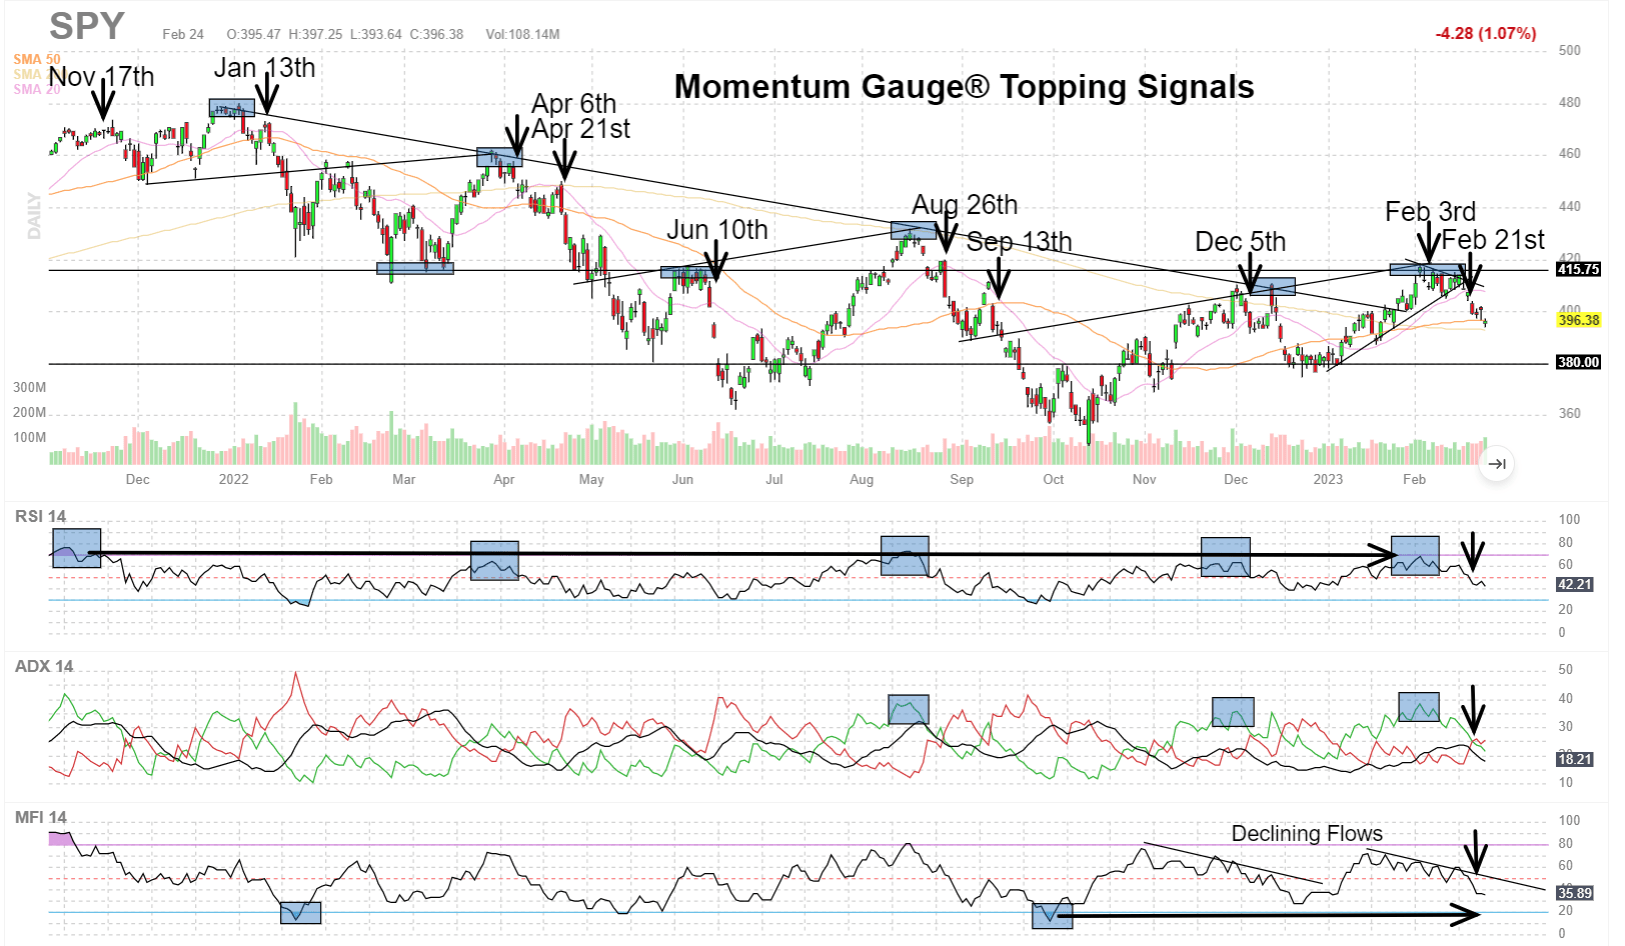
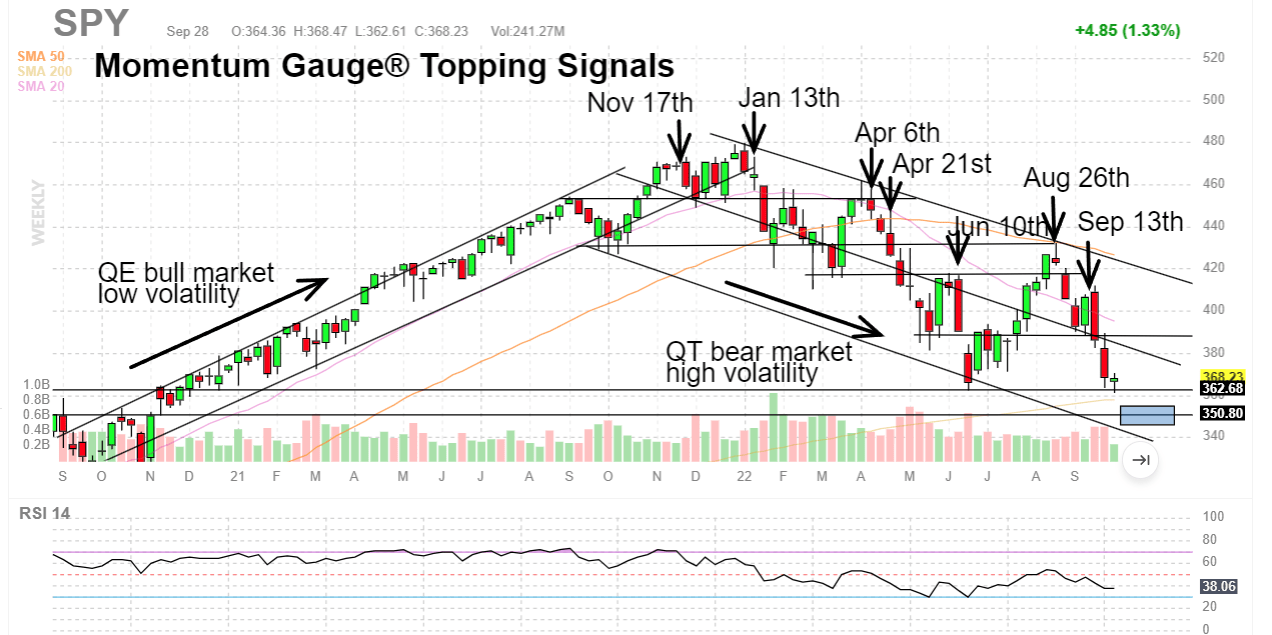
One of the other warning signals that caught my eye was that retail trader optimism spiked to the highest levels since the November Momentum Gauge topping signal in 2021. You can see on the ( SPY ) chart above that November 17th was a major topping signal with the peak levels of MFI market inflows that we have not seen since despite very high market exuberance lately.
Bloomberg
SPY intraday road map for February from a technical interpretation has been in breakdown conditions since the start of the February cycle. The market outflows have increased like prior patterns have documented with the second half of the month price declines worse than the first half on average.
As I always warn my community during these downturns, volatility is much higher in bear markets than in bull markets. We will see strong bear bounces but watch for continued lower highs and lower lows until the net outflows reverse. Another way to consider net outflows is to monitor funds with the largest weekly redemptions of funds.
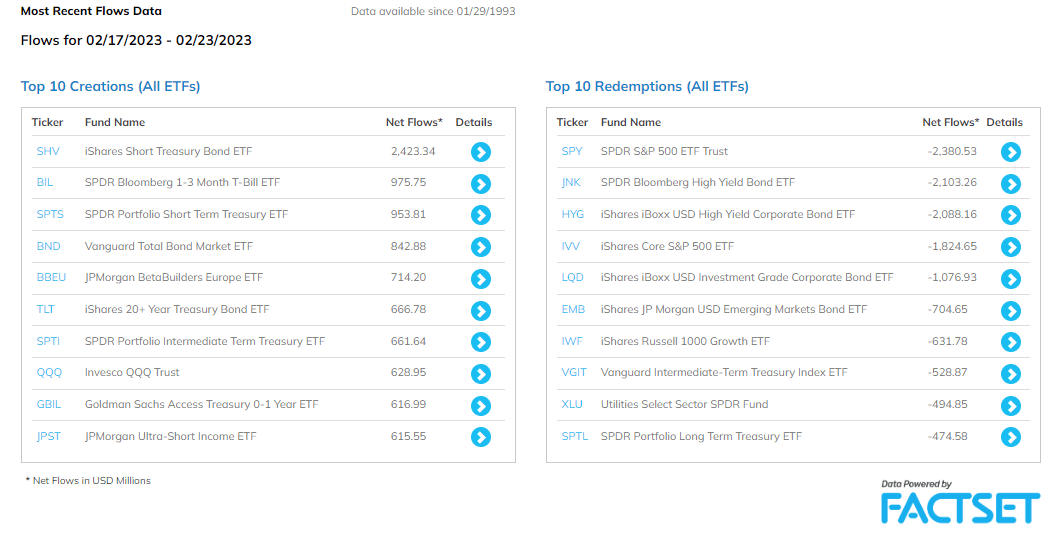
As you can see on this FactSet table SPY has been experiencing the largest outflows of any exchange traded fund of over -$2.3 billion in the most recent week and has been leading in outflows for at least the last two weeks. The highest inflows are heading toward iShares Short Treasury Bond fund ( SHV ) as investors expect treasury yields to continue to spike to the highest levels in 2023 as treasuries decline. Much of this decline in treasuries is due to the Fed continuing to rolloff and sell treasuries as part of the largest Quantitative Tightening (QT) event in US history.
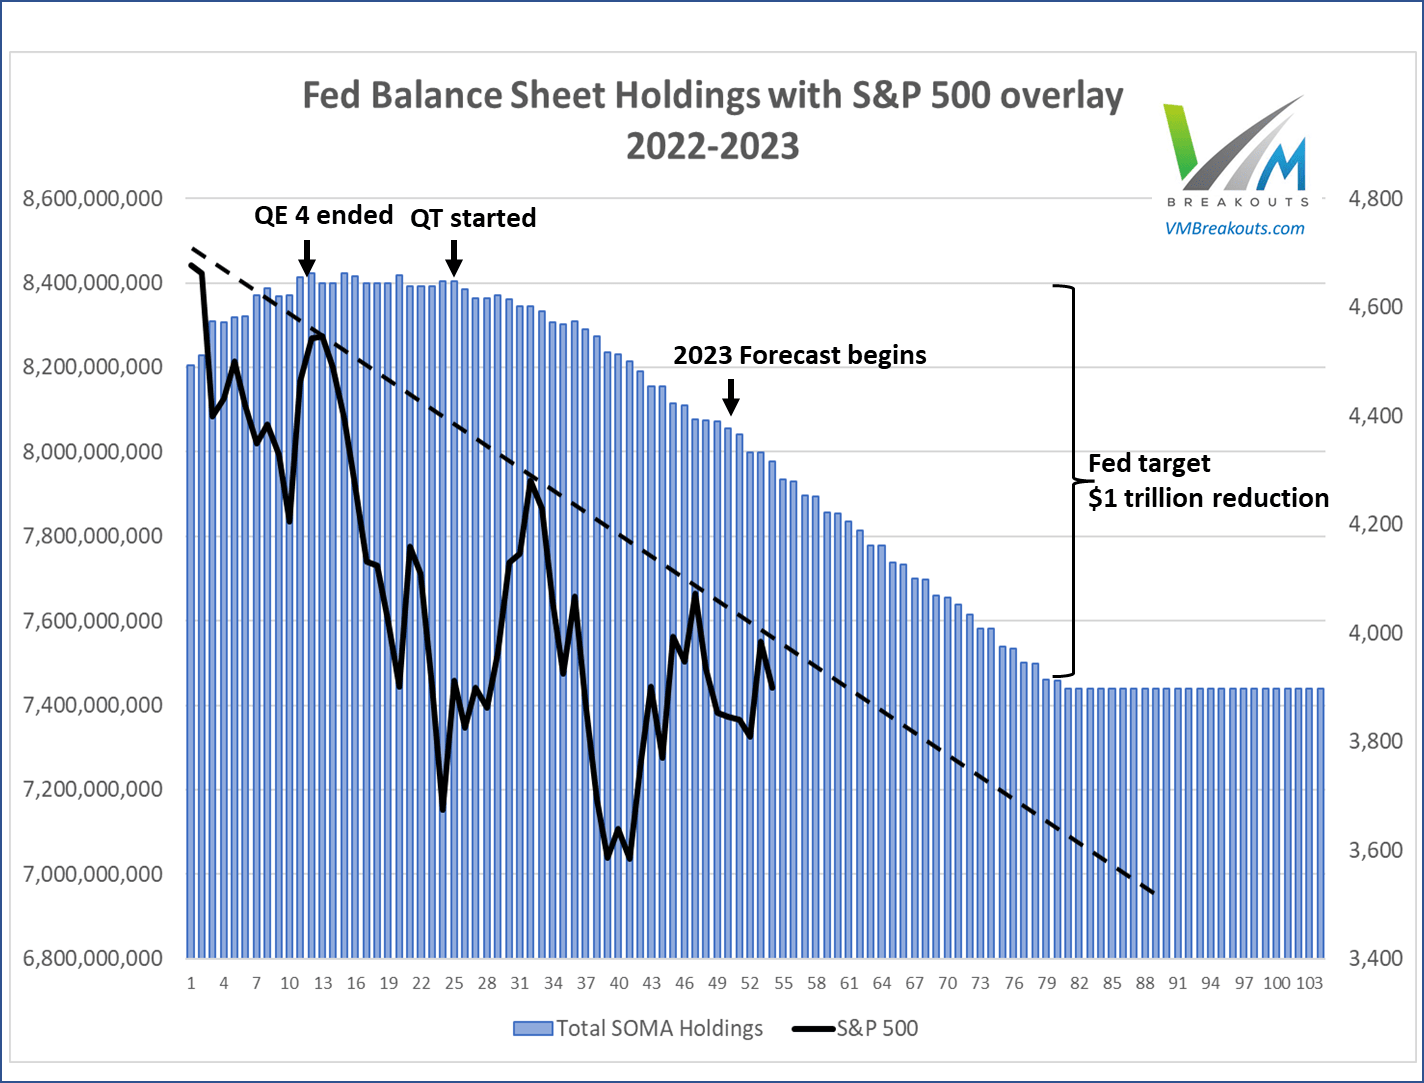
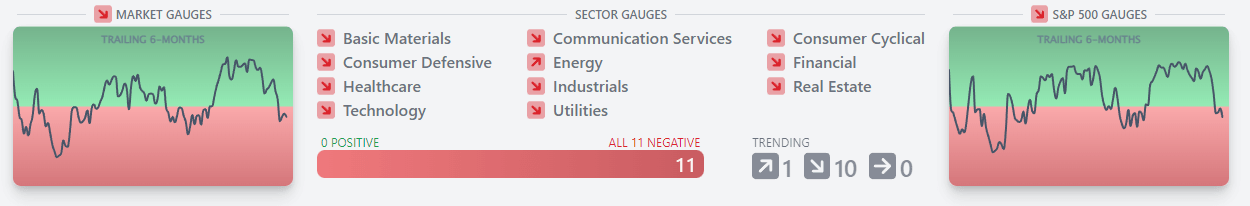
As my tracking chart on the Fed balance sheet shows, the Fed is still on pace to hit their $1 trillion balance sheet reduction target in late August. This draining of liquidity along with record declines in corporate buybacks is creating prolonged market weakness. That market weakness is hitting every sector on the sector gauges as shown below with momentum turning broadly negative across all the market sectors for the first time since last year.
We never know how long market outflows will continue. We do know that the last time the positive gauges peaked as high as August 2022 levels we saw 10 weeks of declines into September for over -16% declines in the S&P 500.
Another thing we know about current market conditions is that inflation printed much higher than expected in the recent CPI, PPI, and PCE data reports. Fed members have begun speaking openly about increasing rate hikes back up to 50 bps in March as current hikes are not having their desired effect.
The Fed's aggressive tightening policy with the fastest series of rate hikes and largest balance sheet reductions in history have a profound effect on markets. As an example, you can see how differently the market behaves when QE stimulus is being added versus when it begins to be removed.
The trading ranges get much larger in bear markets. This is largely due to high short positions and frequent short squeeze events that force investors with market downside concerns to cover their hedges. This process repeats as dip-buyers again reach another top of declining inflows and again the extreme shorting resumes in a whiplash effect. In contrast, bull markets are characterized by slow steady gains, almost boring, with fewer large breakout moves than we often see in bear market conditions.
We can see on the Microsoft ( MSFT ) chart below that price topped from the highest overbought conditions since August. The price has moved back into the negative channel from the 2021 November market peak and may be headed to 240/share next strong support.
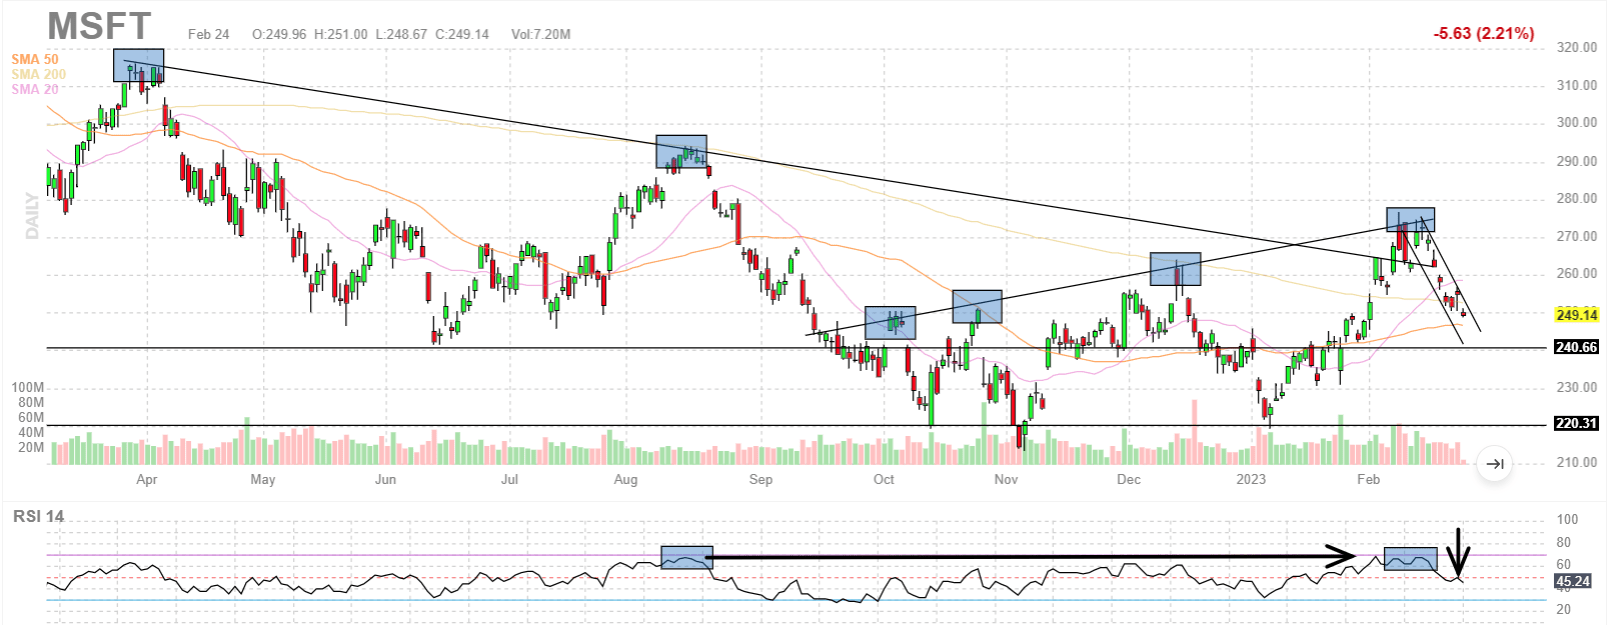
Evaluating the other market giant Apple ( AAPL ) shows us very similar indicators. These two stocks comprise the largest weightings on the major market indices and both show increasing downside weakness toward prior levels of support.
When reflecting on precarious market conditions, a look at major indices like the S&P 500 and the Dow Jones Industrial Average ( DJIA ) give us some additional indicators.
The Dow has given back all its gains for 2023 and broken below 33,000 support this week. Relative strength and advance/decline indicators have turned sharply negative for the first time in months with some similarities to the August 2022 peak around the 34,000 level.
In addition the weekly gauges for the broad market and the S&P 500 gauges have turned negative for the first time in more than 6 weeks. It takes a much larger signal to move weekly indicators that are now negative. We can capitalize on these momentum gauge signals by switching between bull/bear funds on our tracking pages.
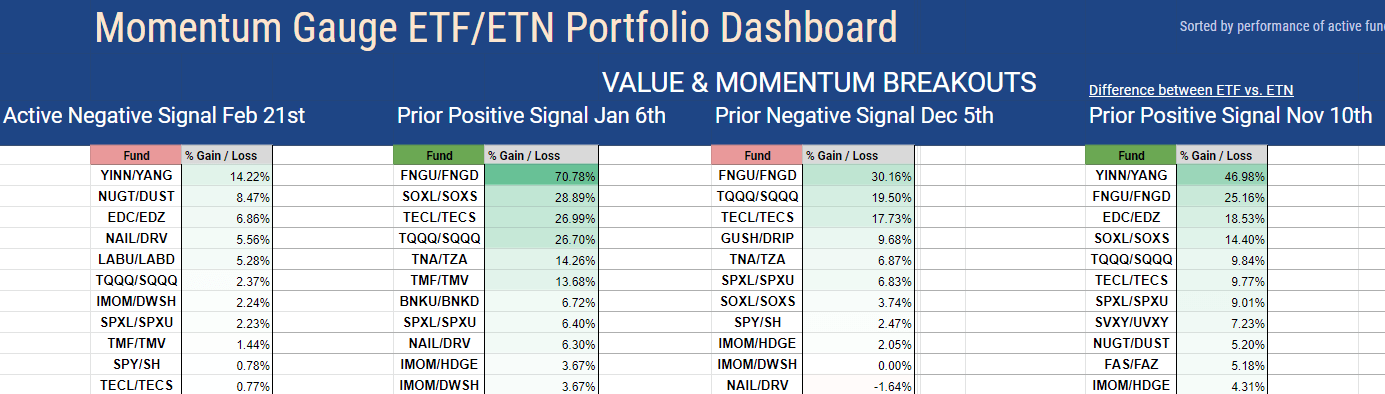
Even if readers did not act on the early negative Feb 3rd signal we are starting with strong positive gains in bear funds this week led by Direxion Daily FTSE China Bear 3X Shares ( YANG ) +14.2%, Direxion Daily Gold Miners Index Bear 2X Shares ( DUST ) +8.5%, Direxion Daily MSCI Emerging Markets Bear 3X Shares ( EDZ ) +6.8%, Direxion Daily Real Estate Bear 3X Shares ( DRV ) +5.5%, LABD +5.3%. For members of our trading community who moved on the earlier signals we are seeing much larger gains through February led by YANG +24.2% and MicroSectors FANG+ Index -3X Inverse Leveraged ETN ( FNGD ) +19.98%
Finally, the US dollar index fund ( UUP ) works as a very strong indicator of market conditions and especially for commodities like metals that are priced in dollars. We have been tracking the February breakout in very bearish conditions for markets as it moves to the highest levels of the year.
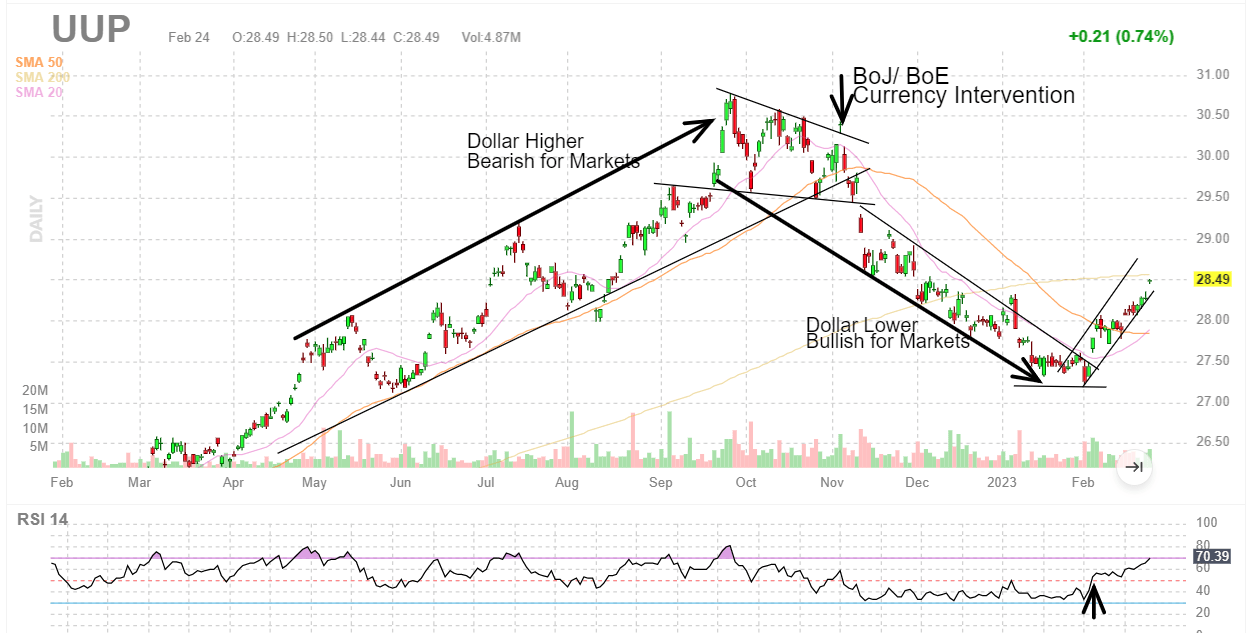
These indicators and others are key to navigating the markets for the best results.
Prior Negative Signals In Advance Of Major Downturns
One of the most popular uses for the gauges is to get advanced warning signals ahead of major market downturns in order to protect your investments. Examples of prior major market topping signals including the 2018 quantitative tightening (QT) correction and the 2020 Covid correction are shown below.
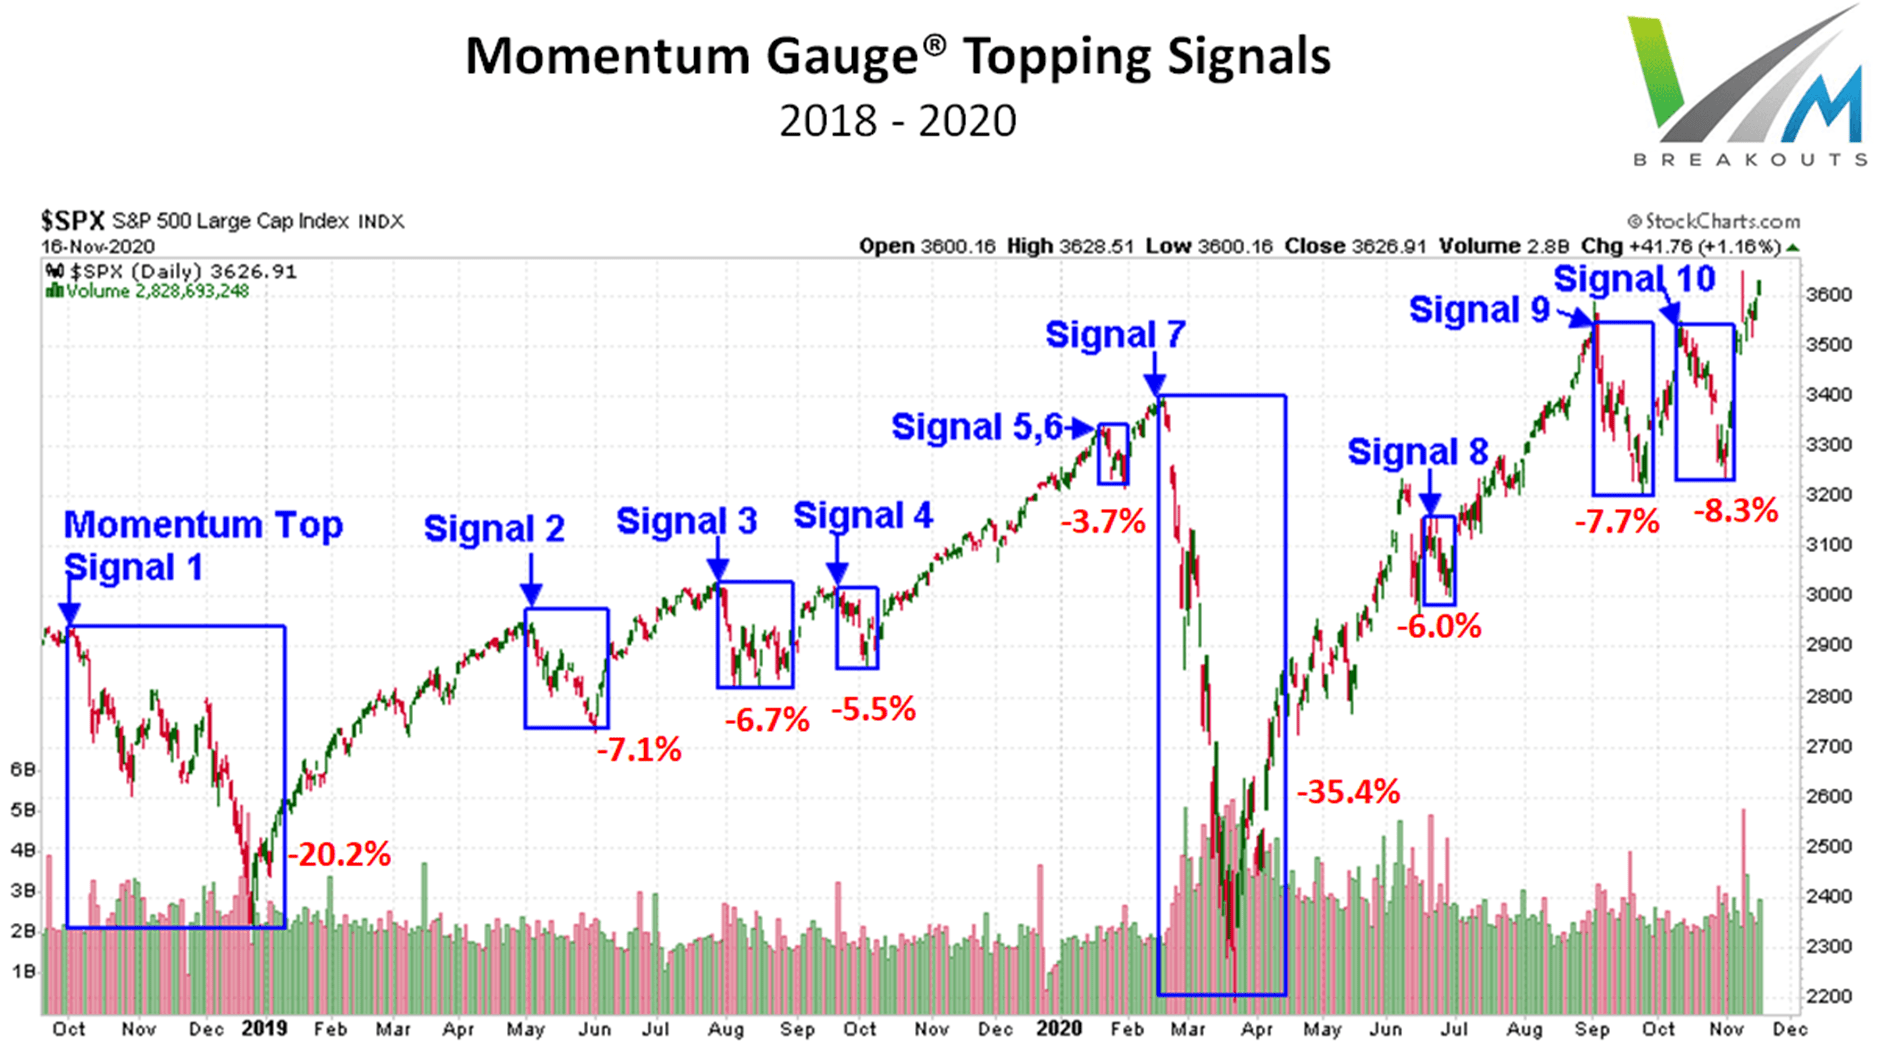
The point of this illustration is that a majority of all the signals detected so far were events exceeding -5% S&P 500 declines to as much as -35%, including one of the worst one month declines in history. I always publish many more current examples and signal articles throughout the year for anyone interested in following my market updates.
Review Of Prior Signals
- August 2022 Topping Signal September Validates 4th Major 2022 Momentum Gauge Topping Signal (Technical Analysis)
- Signal 22 (September 13th, 2022) Momentum Gauge Topping Signal: 3rd Negative Signal In 2022
- Signal 20 (January 13th, 2022) Momentum Gauge Topping Signal: The First Negative Signal In 2022
-
Signal 19 (November 17th, 2021) Momentum Gauge Topping Signal: The Second Largest 2021 Negative Signal To Date
- Signal 16 (June 17th, 2021) Momentum Gauge Topping Signal June 17: The Largest Negative Signal In 2021
- Signal 11 (January 29, 2021): First Negative Momentum Gauge® Signal For 2021: Reviewing The Signals | Seeking Alpha Marketplace
- Signal 9-10 (September 13, 2020): An Election Year Correction Signal And Only The 3rd Negative Weekly MG Signal In 2020
- Signal 8 (June 24, 2020): Evaluating The 8th Market Correction Signal On June 24th That Has Preceded Every Recent Decline
- Signal 7 (March 23, 2020): Revisiting The Signals That Forecasted Every Recent Decline, In Search Of Early Recovery Indicators
- Signals 4-6 (Jan 28, 2020) : Revisiting The Signals That Forecasted Every Major Downturn Since "Volmageddon": What's Next
- Signals 1-3 (Aug 8, 2019): These 3 Measures Forecasted Every Major Downturn Since QT Started: What's Next
Conclusion
The Momentum Gauges continue as part of an active research project that has delivered highly profitable results to many readers of my published financial articles. I continue to enhance the model as we gather more data over many more months and years. The current market conditions with increasing rate hikes and the largest Fed quantitative tightening program in history may contribute to weaker than average performance for 2023.
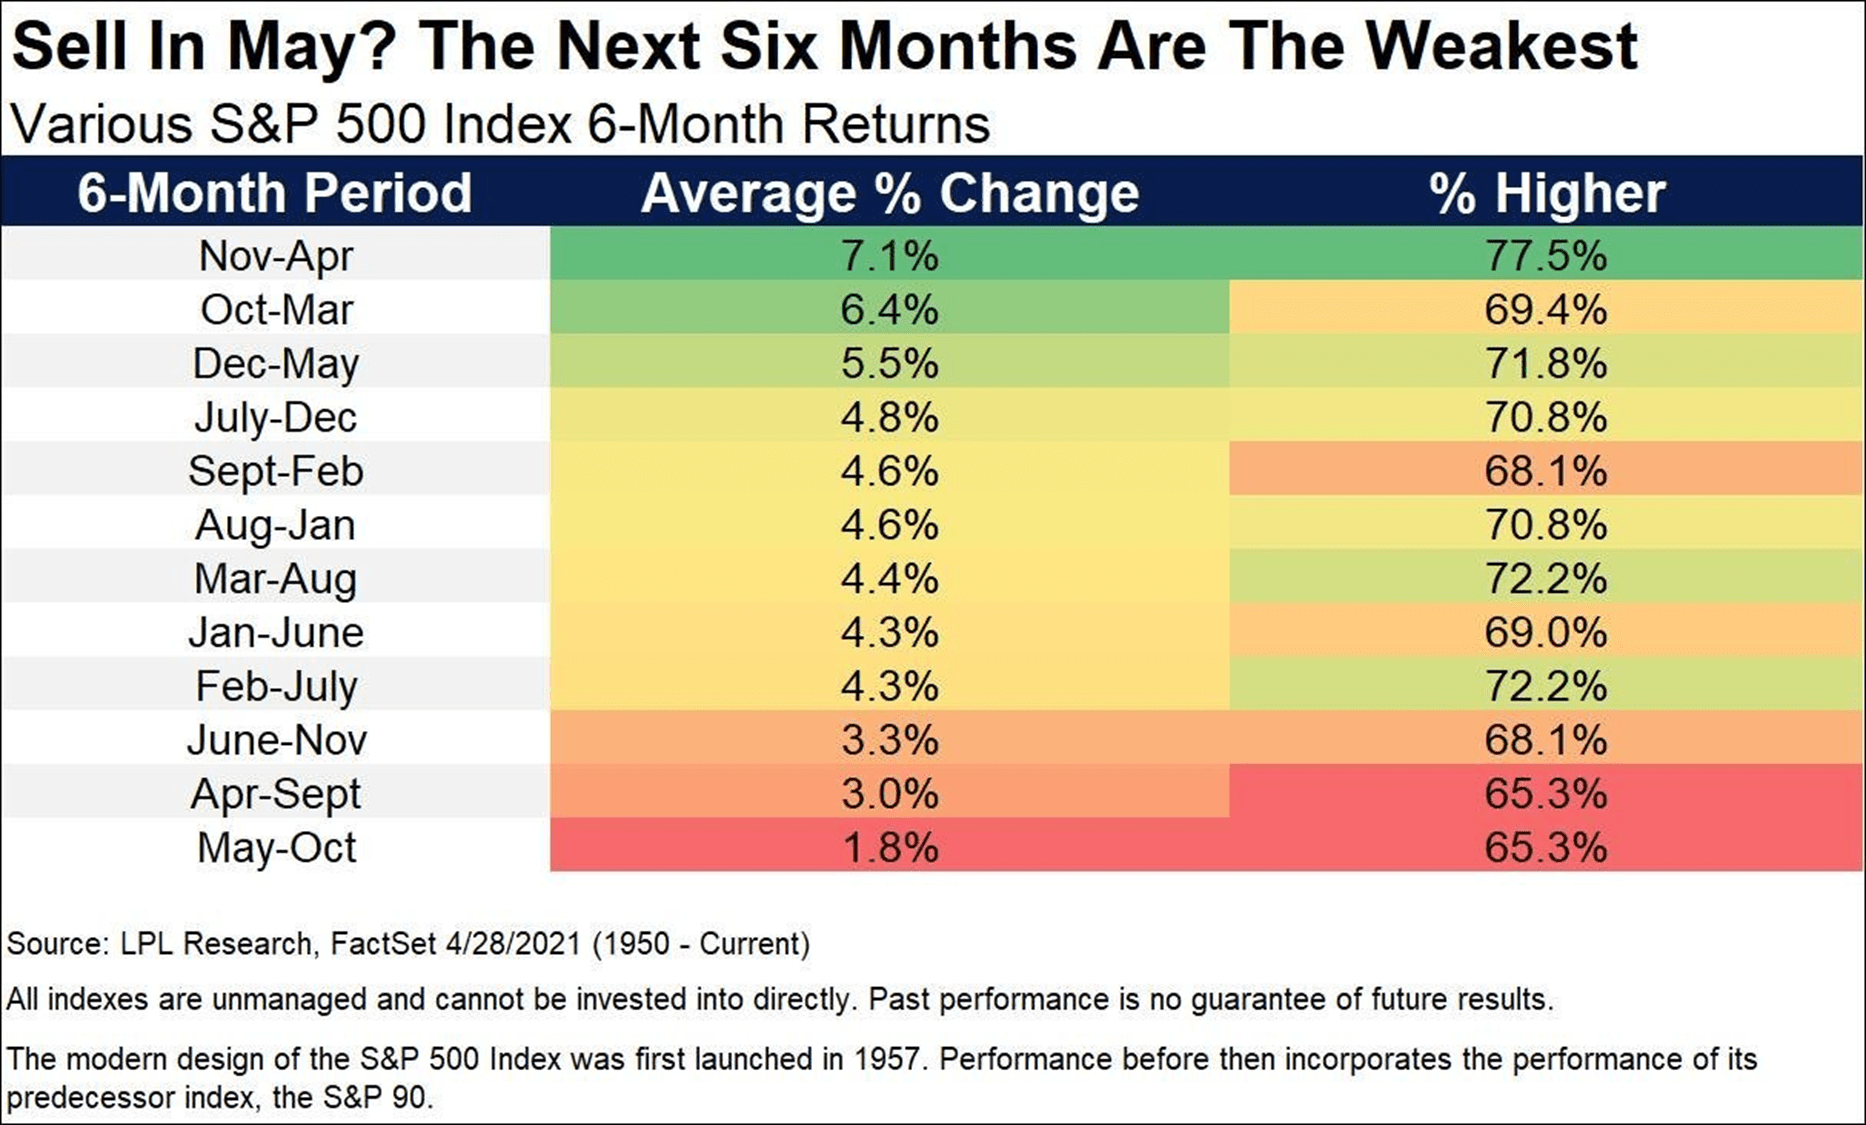
Historically, from 1950, the six-month period between February to July delivers below average returns for the S&P 500 relative to all six-month periods. The current Fed tightening conditions and approach of a potential recession are not factored and may further increase the market risks this year.
I hope this analysis provides you with additional market insight that benefits your trading in the year ahead.
All the very best to you!
JD Henning, PhD, MBA, CFE, CAMS
For further details see:
Largest Market Topping Signal Since August As Fed Considers 50 Bps Rate Hike