LDP - LDP: High Yielding Preferred Stock Fund That's Better Than HPF/HPI
Summary
- The LDP fund provides high current income through a portfolio of preferred stocks.
- It pays a high current yield of 7.6%.
- The LDP has superior risk adjusted returns compared to the HPF/HPI funds offered by John Hancock.
- However, investors should closely monitor the jump in ROC usage in 2022.
Recently, I reviewed a couple of preferred stock focused closed-end funds ("CEF") from John Hancock, namely the John Hancock Preferred Income Fund (HPI) and the John Hancock Preferred Income Fund II (HPF). My main conclusion was that a passive ETF like the Invesco Variable Rate Preferred ETF (VRP) appears to outperform the CEFs and I was worried about the sustainability of their distributions.
This article takes a look at another preferred stock focused CEF, the Cohen & Steers Limited Duration Preferred & Income Fund (LDP), to see how it compares to HPF/HPI and VRP.
I believe LDP's historical returns are comparable/superior to HPF/HPI. It also has better risk adjusted returns compared to the VRP. My main worry on the LDP is also regarding its distribution, as a sharp jump in ROC usage in 2022 and multiple distribution cuts in the past few years could be a warning sign.
Overall, I prefer the LDP over peer funds HPF/HPI due to LDP's better risk adjusted returns and more prudent distribution policies.
Fund Overview
The Cohen & Steers Limited Duration Preferred & Income Fund is a closed-end fund focused on high current income through investments in preferred stocks and other income securities.
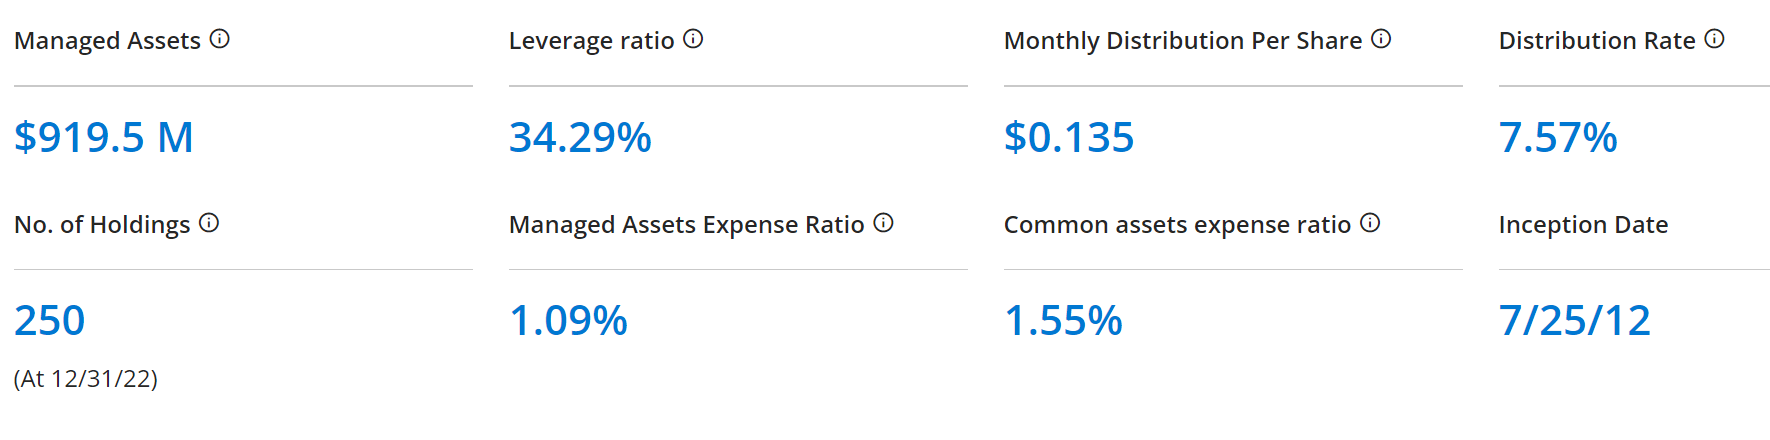
The LDP fund is popular with investors, with $920 million in managed assets (Figure 1). The fund charges a 1.55% expense ratio to common shareholders.
How Does Preferred Stock Fit Within A Portfolio
Within a company's capital structure, preferred stocks sit between bonds and common equity (Figure 2). They share common characteristics with both bonds and equity, and in the event of a bankruptcy, preferred shareholders' claims on the company's assets are superior to that of common shareholders, but subordinated to bondholders.
Figure 2 - Preferred shares sit between bonds and equity in a company's capital structure (corporatefinanceinstitute.com)
Like bonds, preferred stock usually pay a yield. However, unlike bonds, preferred dividends are not contractually guaranteed, so even if a company stops paying preferred dividends, the act will not push them into credit default or bankruptcy. Preferred stocks also typically pay a higher yield than bonds to compensate for the lower priority claim on assets.
Compared to common equity, preferred stock's appreciation potential is usually limited, as they trade like bonds and companies typically have call provisions to redeem preferred stocks at par. Preferred shareholders also typically do not get to vote when it comes to corporate matters.
Preferred Stock May Appeal To Income-Oriented Investors
Within a portfolio, preferred shares are sometimes thought of as a substitute for high-yield ("junk") bonds. Both asset classes pay higher yields than investment grade bonds and both are correlated to equity indices. However, like junk bonds, preferred stocks tend to do poorly during economic downturns as credit spreads widen.
In a recent article on the Invesco Variable Rate Preferred ETF, I compared the historical returns and risk of the VRP ETF versus the iShares iBoxx $ Investment Grade Corporate Bond ETF ( LQD ) representing corporate bonds, and the SPDR Bloomberg Barclays High Yield Bond ETF ( JNK ) representing junk bonds.
Using the historical period May 2014 (inception date of VRP) to December 2022, the VRP ETF had superior returns and comparable risk vs. corporate and junk bonds (Figure 2). VRP also had a higher distribution yield compared to LQD and JNK.
Figure 2 - VRP vs. LQD and JNK (Author created with Portfolio Visualizer)
Portfolio Holdings
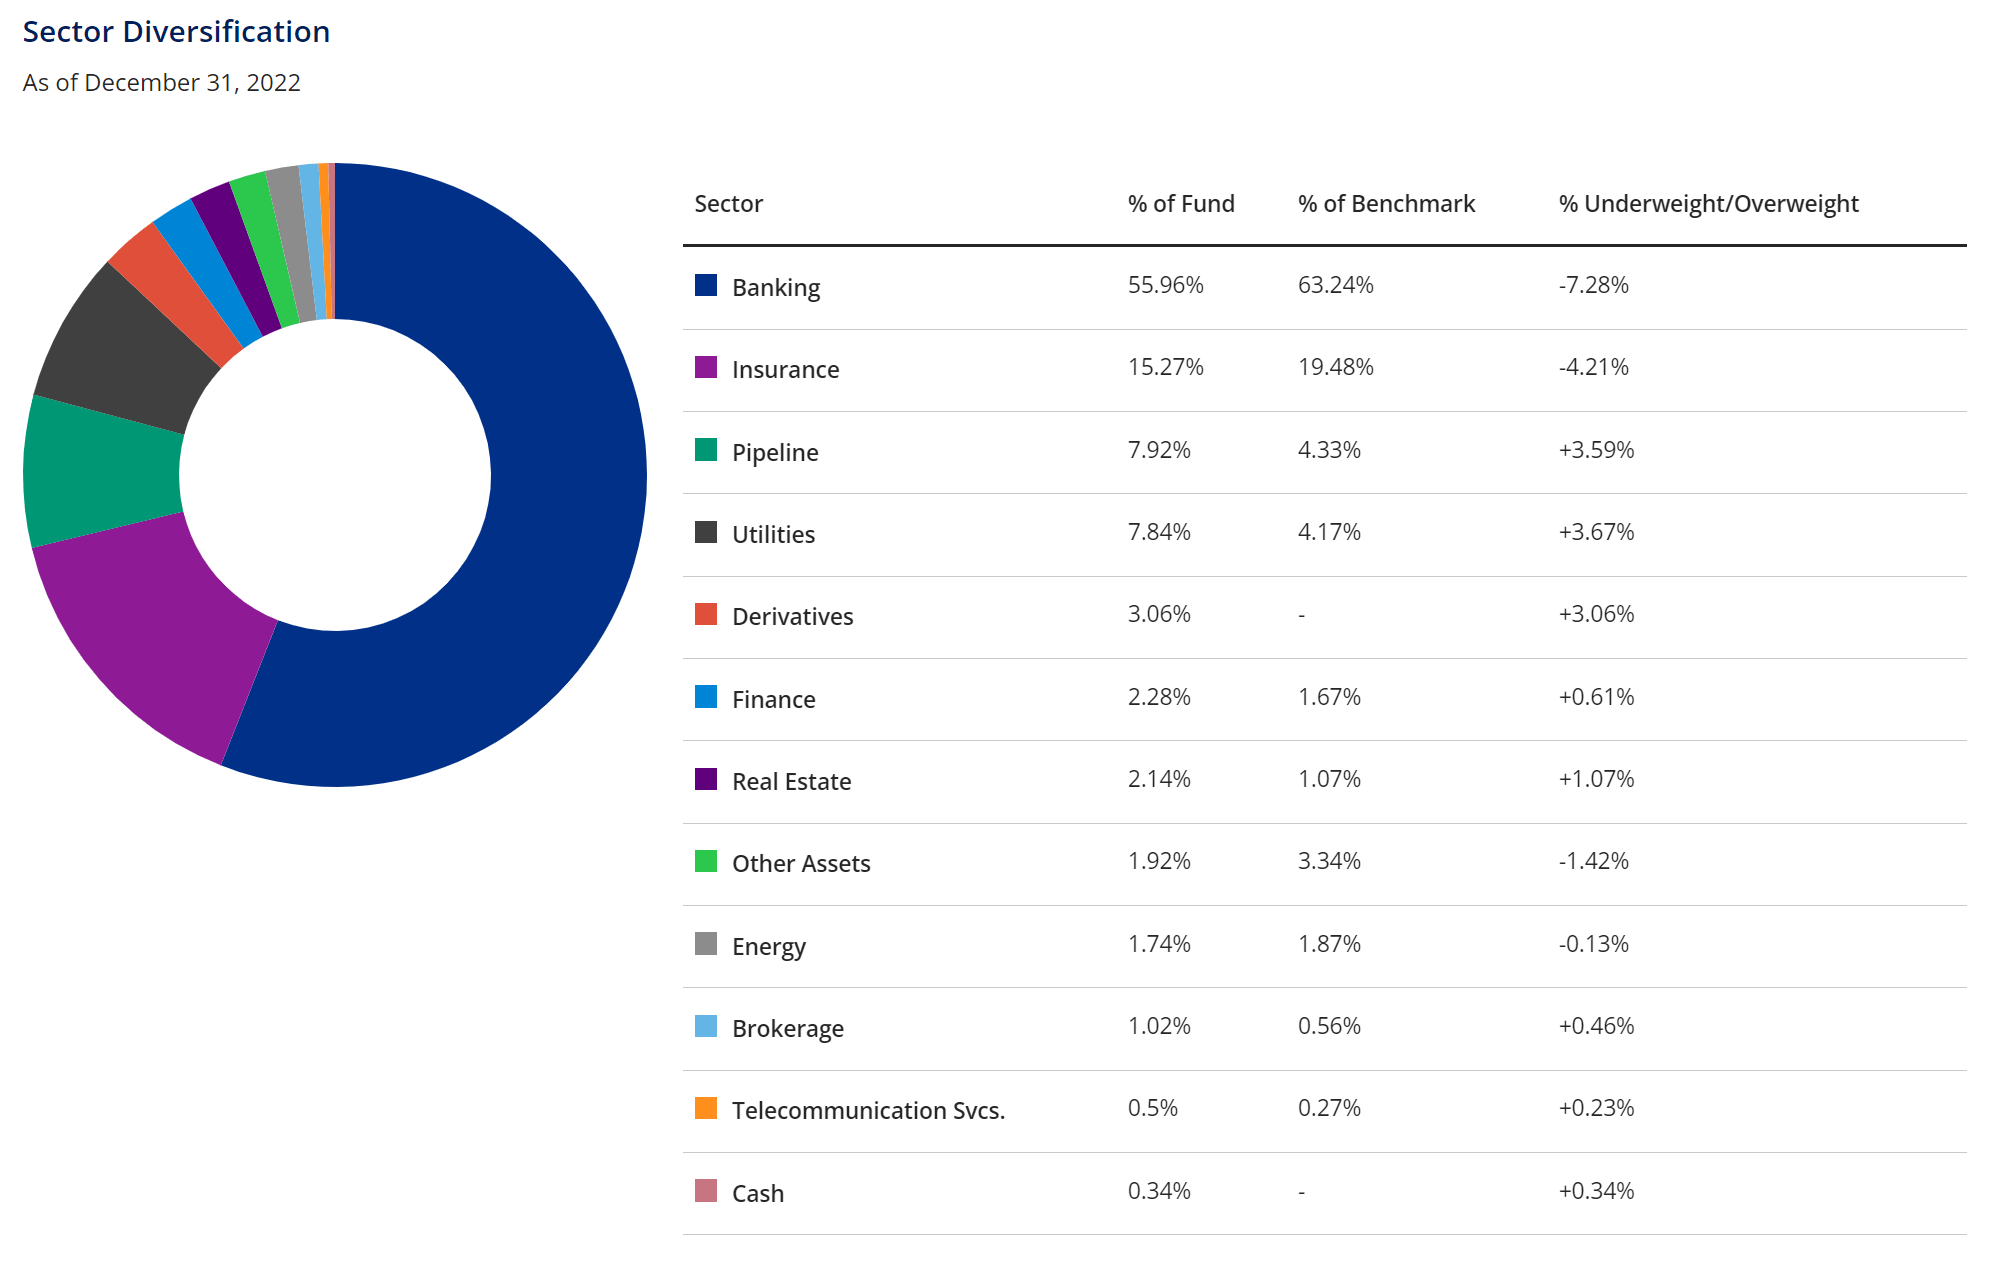
Coming back to the LDP fund, figure 3 shows the sector allocation of the fund. LDP is heavily geared towards the banking and insurance sectors, with 56% and 15% of the portfolio respectively, as those sectors tend to be heavy issuers of preferred stocks.
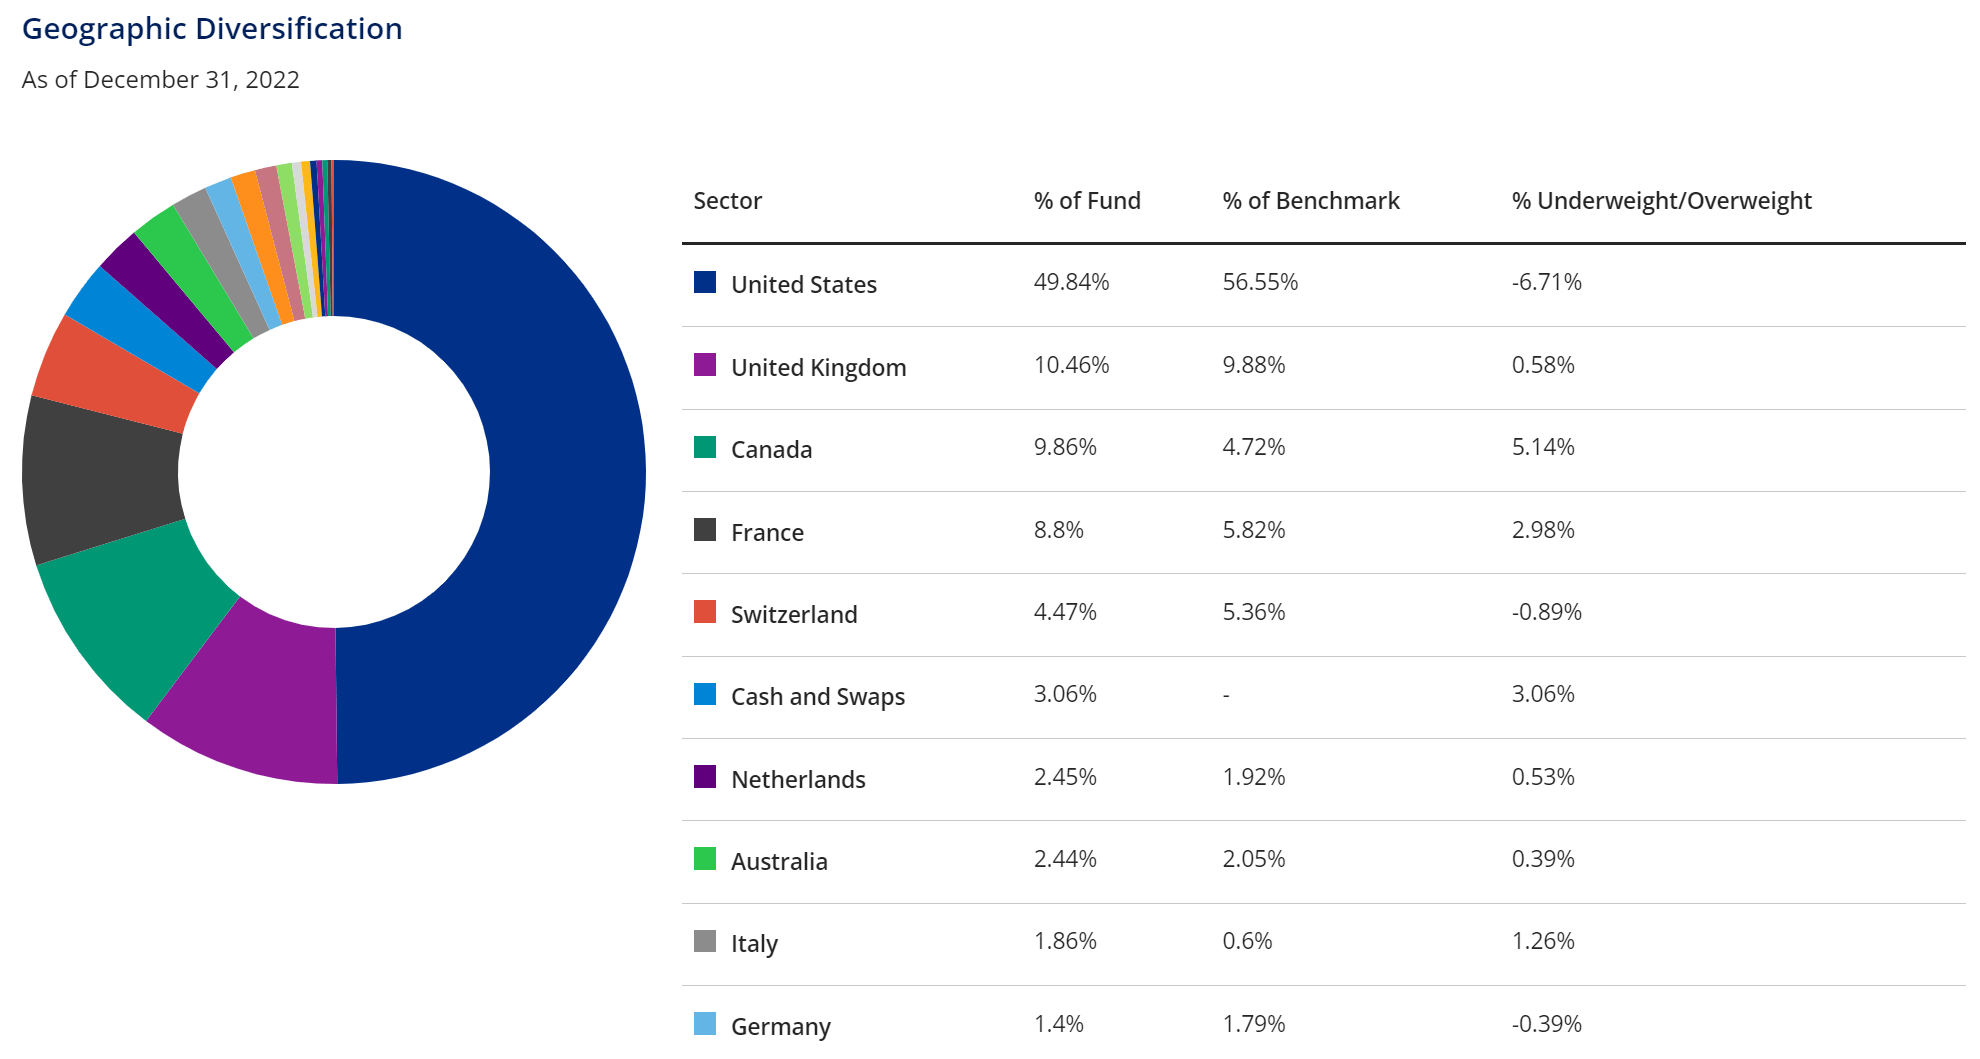
The LDP fund is also quite geographically diverse, with issuers in the U.S. representing only 50% of the fund's portfolio. The U.K. (10%) and Canada (10%) are the 2nd and 3rd largest geographical weights.
Returns
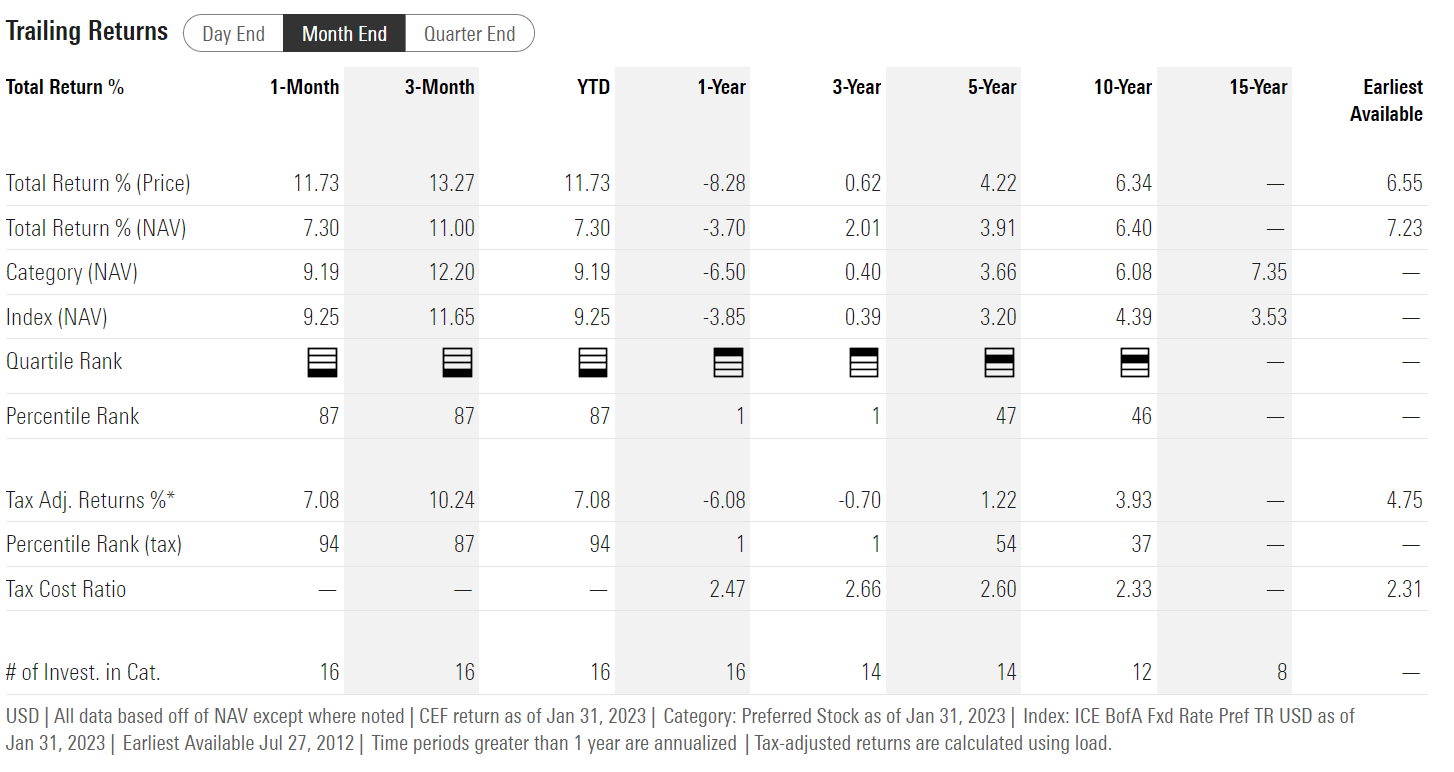
LDP has generated modest long-term returns, with 3/5/10Yr returns of 2.0%/3.9%/6.4% respectively to January 31, 2023.
Distribution & Yield
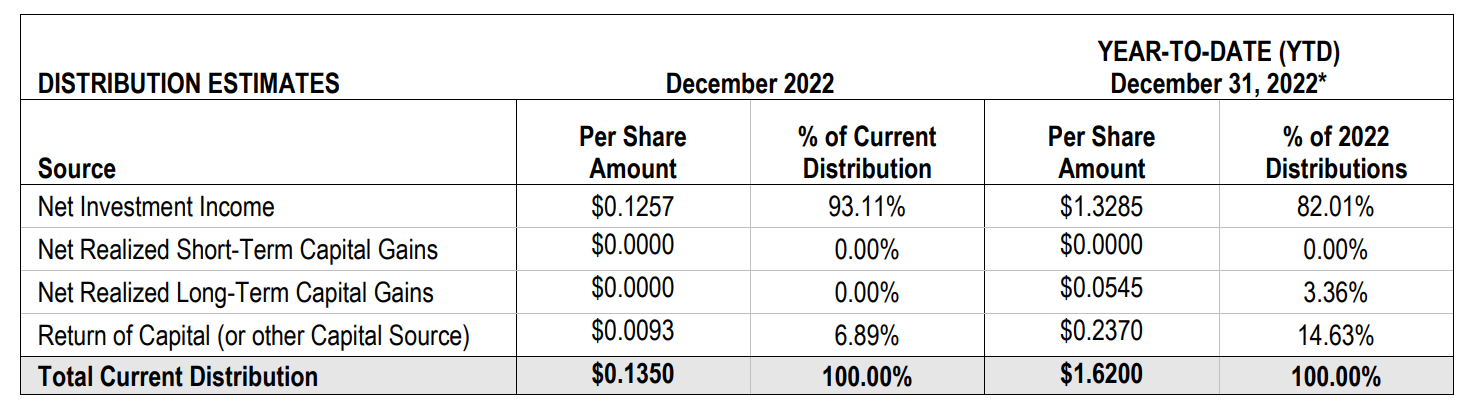
The LDP fund pays a high monthly distribution of $0.135 / share, or 7.6% forward distribution yield. On NAV, the yield is 7.2%.
Investors should note that LDP's distribution is ~80% funded through net investment income ("NII") with the rest from capital gains and return of capital ("ROC") (Figure 6).
Figure 6 - LDP's distribution is ~80% funded from NII (LDP December 2022 section 19 notice)
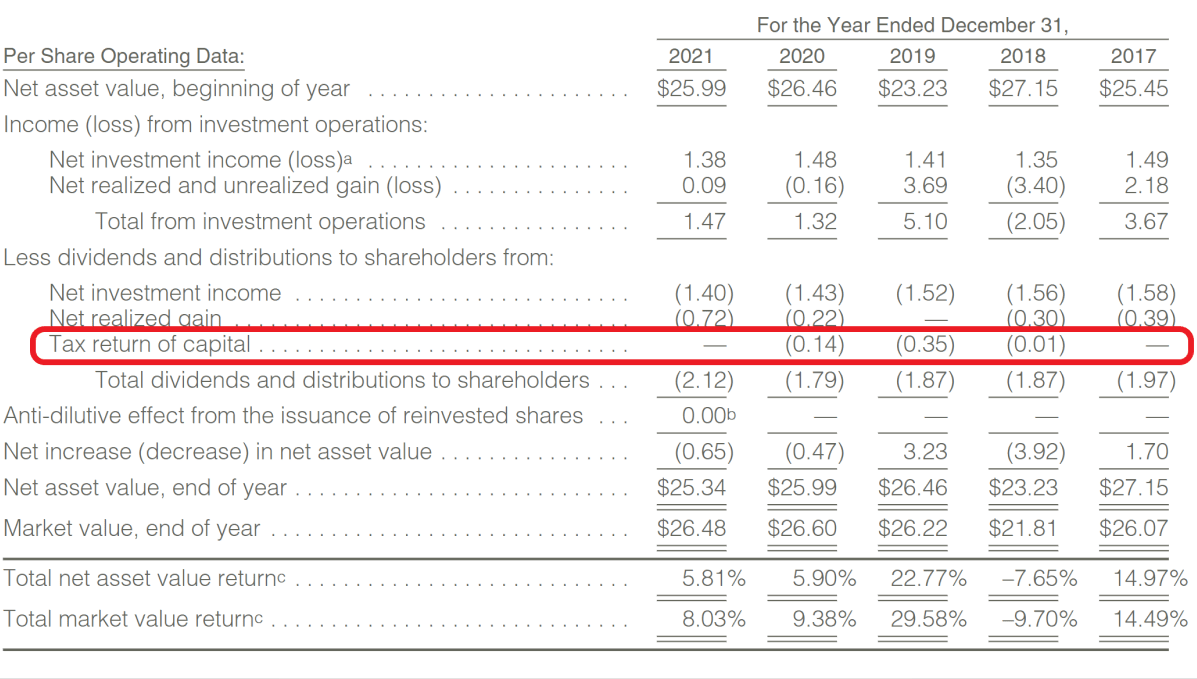
LDP's reliance on ROC is not high, totalling $0.50 / share between 2017 to 2021 or 5.2% of the $9.62 / share in distributions paid (Figure 7).
Heavy reliance on return of capital could be an indication of a fund not earning its distribution. Investors should monitor LDP's jump in ROC usage to 15% in 2022, to make sure this not a new trend going forward.
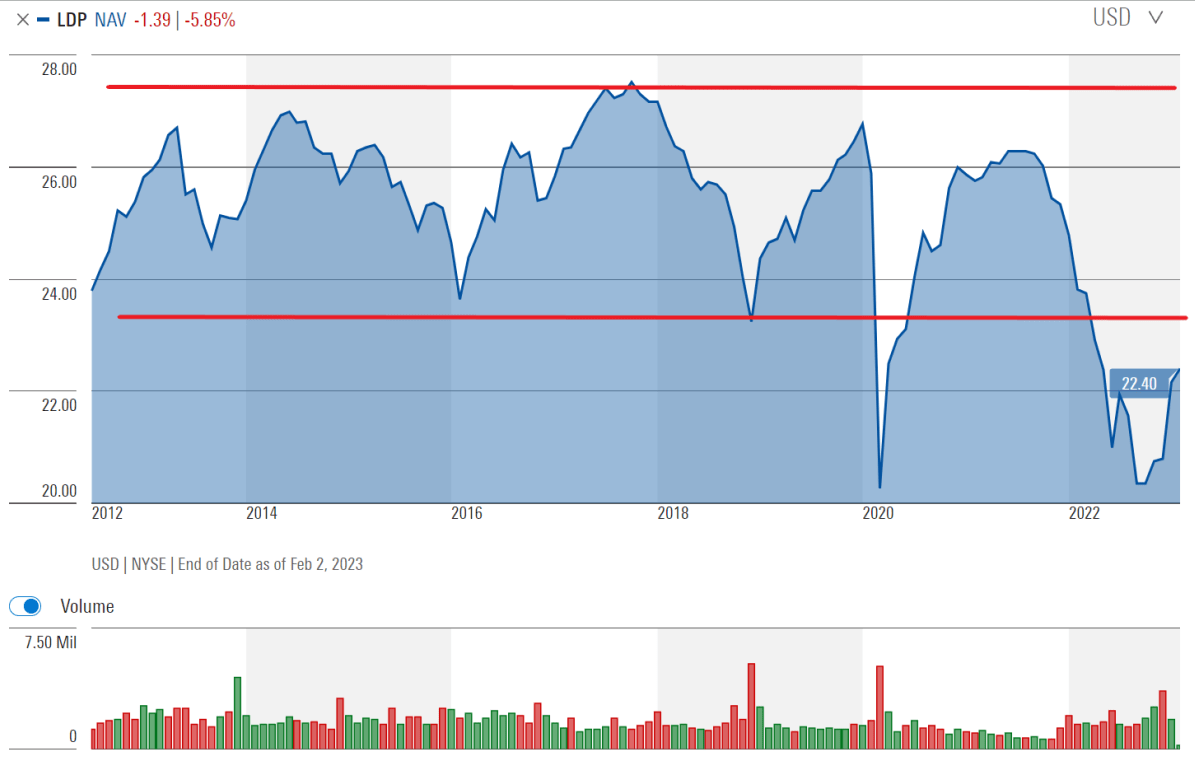
Long-term holders can also monitor LDP's NAV, to make sure the fund is not turning into an amortizing 'return of principal' fund. 'Return of principal' refers to investment funds that cannot earn their distributions and must liquidate a portion of its NAV every month to fund its distribution. Historically, LDP's NAV has ranged between ~$24 to $27 while paying out its high distribution yield, so it did not appear to be a concern (Figure 8).
However, LDP's jump in ROC usage in 2022 and poor investment performance in since mid-2021 raises a warning flag that merits monitoring. Readers who want to understand more about the 'return of principal' concept should read the whitepaper titled 'Return of Capital Demystified' by Eaton Vance or refer to one of my recent articles .
Distribution Has Been Trimmed Since 2020
Investors should note that the LDP fund has prudently reduced its distribution rate from $0.156 / month before 2020 to $0.143 and then $0.135 as of January 2022. While distribution cuts are painful for investors, at least it prevents the fund from entering into a significant (earnings - distribution) negative spiral where an increasingly greater percentage of the fund's distribution is funded by ROC, depleting the fund of income earning assets to fund future distributions.
LDP vs. Peers
In my recent HPF and HPI articles, I noted that the two John Hancock preferred stock CEFs were inferior to a passive fund like the VRP ETF. In particular, I was concerned that the HPF/HPI funds exhibited extremely high volatility for the asset class, and had long-term declining NAVs/distributions. How does the LDP fund compare against HPF/HPI and VRP?
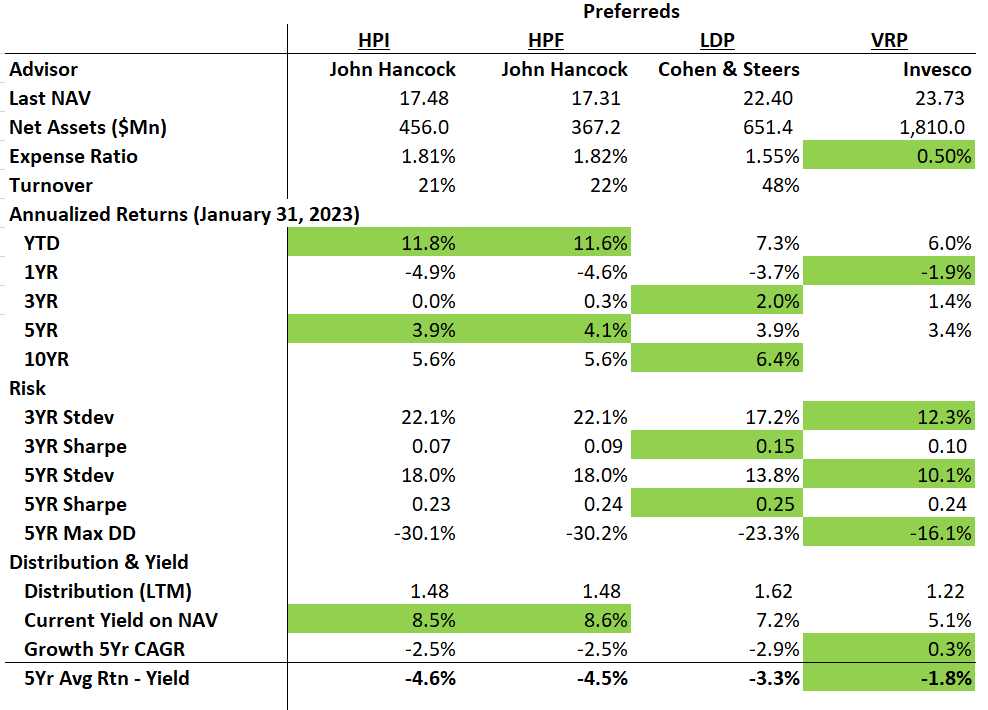
Figure 9 shows my proprietary scorecard comparing HPF/HPI vs. LDP and VRP. Obviously, the passive VRP ETF beats the active CEFs on costs.
Figure 9 - LDP vs. HPF/HPI and VRP (Author created with returns and risk metrics from morningstar.com and fund details and distribution from Seeking Alpha)
In terms of total returns, the LDP is no slouch, outperforming HPF/HPI on a 3 and 10Yr basis, and tying on 5Yr.
The LDP fund exhibits significantly lower volatility compared to the John Hancock funds. Even though LDP is more volatile than VRP, it actually has a better Sharpe Ratio due to higher returns.
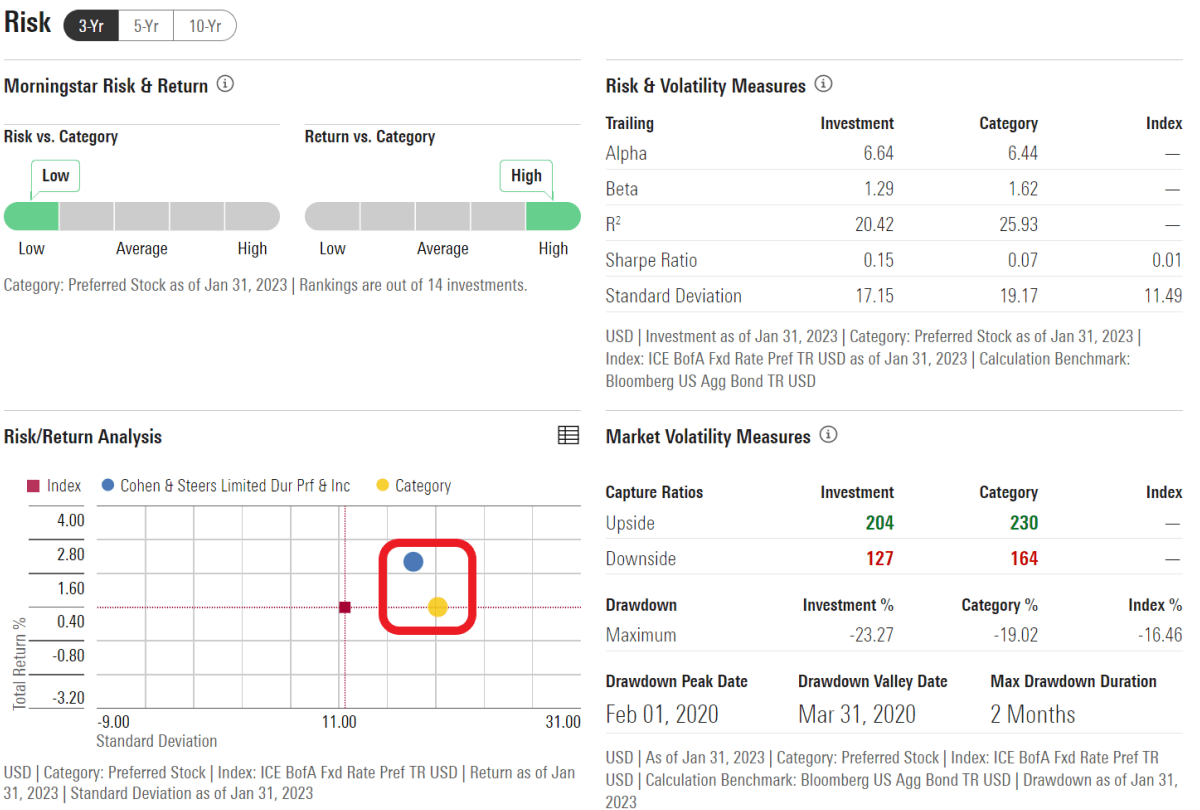
Importantly, unlike the John Hancock funds, the LDP fund has better returns and lower risk than the Preferred Stock peer category on Morningstar (Figure 10).
Figure 10 - LDP has superior risk adjusted returns vs. peers (morningstar.com)
Finally, in terms of distribution yields, although the John Hancock funds pay a higher current distribution yield, I think LDP is more prudent, as its earnings gap between its 5Yr average annual total returns and its current distribution yield is smaller.
Conclusion
The Cohen & Steers Limited Duration Preferred & Income Fund is a fairly popular CEF focused on generating high income through preferred stocks. It pays an attractive 7.6% distribution yield.
Historically, LDP's distribution appeared sustainable, as it did not have to rely heavily on ROC. However, a jump in ROC usage in 2022 and multiple distribution cuts in the past few years could be a warning sign.
Personally, I prefer the LDP over the peer funds offered by John Hancock due to LDP's better risk adjusted returns and more prudent distribution policies.
For further details see:
LDP: High Yielding Preferred Stock Fund That's Better Than HPF/HPI