ETRN - Legacy Ridge Capital Partners Equity Fund I 2023 Mid-Year Letter
2023-07-29 04:05:00 ET
Summary
- Legacy Ridge Capital Management are contrarian investment managers who believe successful results can be achieved through a focused, long-term investing.
- Legacy Ridge Capital's partnership returned 15.8% gross, 12.8% net, in the first half of 2023, outperforming the S&P 500 and the broader energy sector.
- Our portfolio remains largely unchanged, with three major positions comprising around 45% of the portfolio.
- We discuss the performance and potential of Equitrans Midstream and highlight Norway's experience with gas-to-EV fleet conversion.
| To June 30 th 2023: |
| LRCP Equity Fund I |
| S&P 500 |
| Russell 2000 |
| MSCI World Index |
| Gross |
| Trailing 6-month Total Return: |
| 15.8% |
| 16.9% |
| 8.1% |
| 15.4% |
| Trailing 1.5-yr Total Return: |
| 30.2% |
| -4.2% |
| -14.1% |
| -5.0% |
| Trailing 2.5-yr Total Return: |
| 84.6% |
| 23.2% |
| -1.3% |
| 16.2% |
| Trailing 3.5-yr Total Return: |
| 104.2% |
| 45.7% |
| 18.5% |
| 35.4% |
| Trailing 4.5-yr Total Return: |
| 109.4% |
| 91.8% |
| 48.5% |
| 73.3% |
| Trailing 5.5-yr Total Return: |
| 101.3% |
| 83.4% |
| 30.5% |
| 61.3% |
| The figures above are on a cumulative basis, are gross of performance fees, and are unaudited. Future results will also be presented on a cumulative basis in this section. Annual results will be illustrated below for those who wish to measure us based on 12-month cycles. However, we view the cumulative results as most meaningful since we are trying to build wealth far into the future and the annual results are only important in as much as they contribute to a 3, 5, 10, and 20-year track record. |
| Annual/Interim Results: |
| LRCP Equity Fund I |
| S&P 500 Energy |
| AMZ |
| XAL |
| Gross |
| 1H23: |
| 15.8% |
| -5.4% |
| 9.6% |
| 50.2% |
| 2022: |
| 12.5% |
| 64.2% |
| 30.5% |
| -35.0% |
| 2021: |
| 41.8% |
| 53.3% |
| 39.9% |
| -1.7% |
| 2020: |
| 10.6% |
| -33.7% |
| -28.8% |
| -24.2% |
| 2019: |
| 2.5% |
| 11.8% |
| 6.5% |
| 21.3% |
| 2018: |
| -3.8% |
| -18.1% |
| -12.4% |
| -22.4% |
| To reiterate, our goal is to have good absolute returns first and foremost, which should lead to good relative returns versus the broader markets. However, I also think it’s important to highlight the performance of the primary sectors in which we feel we have an advantage and in which we invest. There is no reason to present this other than for transparency reasons. Owning a highly concentrated portfolio will prevent our results from looking like anything we compare them to in most years, but knowing the performance of energy broadly, midstream energy specifically, and North American airlines will add some context for those partners who wish to do some higher-level analysis. Please see the accompanying disclaimer & footnotes at the end of the letter for a broader description of each of these indices. |
RESULTS FOR 1H 2023
Our partnership returned 15.8% gross, 12.8% net, of accrued performance fees through the first 6-months of the year versus the S&P 500 up over 16% and the broader energy sector down over 5%. While neither benchmark is necessarily correlated to the performance of our companies, and Nate and I do our best to not pay much attention to the results, I find it fascinating how short-lived last year’s freak out lasted. Valuation and free cash flow have been tossed aside once again. As a Tesla ( TSLA ) and Google ( GOOG , GOOGL ) stock owning neighbor of mine told me in 2021, ‘I bought them because they’re big companies and everyone seems to like them’ . Never mind she started investing out of boredom during the pandemic, but this takes Peter Lynch’s buy what you know investment philosophy to the extreme. No doubt 2022 was painful for her, but the bounce in her step these days leaves little doubt…FAANG is back baby!
This “ nothing to see here, let’s move on ” mentality is not only a disease afflicting the investment management world, but society writ large. We at Legacy Ridge Capital spent months focused on the implications of Russia’s invasion of Ukraine, let alone the weeks spent writing about it in last year’s first half letter, but the world has moved on. Energy crisis averted! Or so mainstream media and commodity prices would lead one to believe. We’re not so sure. It does appear that European governments were relatively successful in securing additional LNG cargoes, temporarily transitioning to an all-the-above approach with respect to feedstocks—including coal—and helped suppress electricity demand from businesses and residences alike. A warm winter certainly helped too, but it appears to be a short-term win for European policymakers at the very least.
Not much has changed in our portfolio. Our 3 biggest positions comprise ~45% of the portfolio, 15% is in cash or equivalents, and we have 7 middling positions, some of which are what’s carried our overall returns so far this year.
Most Valuable Pipeline (per mile at least)
Equitrans Midstream ( ETRN ) is a small position in the fund—less than 6%—and has been a decent contributor to performance YTD, but it hasn’t been a smooth ride in the least. ETRN is the operator and majority owner of the Mountain Valley Pipeline (MVP), a 303-mile natural gas pipeline proposed in 2014, approved by the FERC in 2017, and started construction in 2018. The estimated build cost was $3.5 billion, and the estimated completion date was early 2019. Now 4+ years behind schedule due to litigation and $3.1 billion OVER budget, and we might have line of sight to flowing gas by year-end 2023.
Maybe. Section 324 of the Fiscal Responsibility Act expedited the completion of MVP by approving all remaining permits and by directing all appeals to the validity of the law to DC district courts. But it appears not even an act of Congress can get the final 10% of the project across the finish line. The 4 th Circuit Court has once again issued a stay to halt construction as they consider arguments from environmental groups that the debt ceiling negotiation was unconstitutional.
We started buying ETRN in February 2022 around $7 a share and averaged down when presented the opportunity, resulting in an average cost basis of $6.87 on the common equity. In addition, we added call options to take advantage of the excess volatility, including Jan 24’ $5 strikes for $.55 per contract this past April when the stock fell to $4.60. While I’m generally opposed to catalyst driven investment theses, for some reason the math on this one made sense to me. In the event MVP was scrapped we thought the existing assets were worth $6 - $7 a share, and that the company could possibly maintain the dividend, or would for at least another several quarters, which provided a high-single-digit yield. In other words, at a mid-single-digit entry price we thought our downside was extremely limited.
We also thought there was even odds MVP would eventually get approval since it was over 90% complete and had started to gather bipartisan congressional support. Swing Democrat Joe Manchin was a big proponent of the project because it originates in his home state of West Virginia, and he had received support from the White House for broader permit reform coming out of the Inflation Reduction Act negotiations. Logic suggested it was getting done despite constant roadblocks erected by the 4 th Circuit.
If/when MVP is completed we think the stock is worth $10 or more. So, our probability weighted valuation had us somewhere around 5% downside (including dividends) at the time of purchase, and 50%+ upside (including dividends) over 1-2 years. A risk/reward we found favorable.
On July 17 th ETRN submitted an emergency request to the US Supreme Court asking it to overturn the 4 th Circuit’s stay. As we go to press the stock is ~$9 a share while we wait to hear from SCOTUS. With the stock up 95% from the April low, we’ve completely exited our option position but are holding onto the common for the time being.
Regardless of what happens with MVP and the circus surrounding it, the drama highlights how hard it is to build interstate infrastructure in this country and how valuable existing assets are. At a cost of $22 million per mile built, MVP makes us feel great about the high replacement cost implied for our other holdings and the downside protection that affords us. Enterprise Products’ ( EPD ) 50,000 miles of pipeline alone would be worth as much as NVIDIA using this simple math, while all EPD’s assets (pipes, fractionation towers, storage tanks, export docks, etc.) are currently only worth 7% of NVIDIA! Of course, the math is much too simplistic and pipes in Texas and many other states are easier and less costly to build than those on the East coast, but our hand grenade approach to investing—as opposed to horseshoe—suggests we’re well within range of some decent value!
Norway vs the World, a very short case study
The imminent demise of fossil fuels is a popular bear thesis against most of the stocks we own and each headline proclaiming such grabs our attention. We’re certain it’s coming, but probably not in our children’s lifetimes (and I have a kindergartner!), let alone our own, and thus, might be a touch beyond our investment horizon. But just as the promise of free cash flow 10-years out can cause “name-your- favorite-tech-company” to command nosebleed values, the assumption of no free cash flow 50-years out can cause “name-your-favorite-energy-company” to command strikingly low values—so we’re always on the hunt for data that challenges our theses.
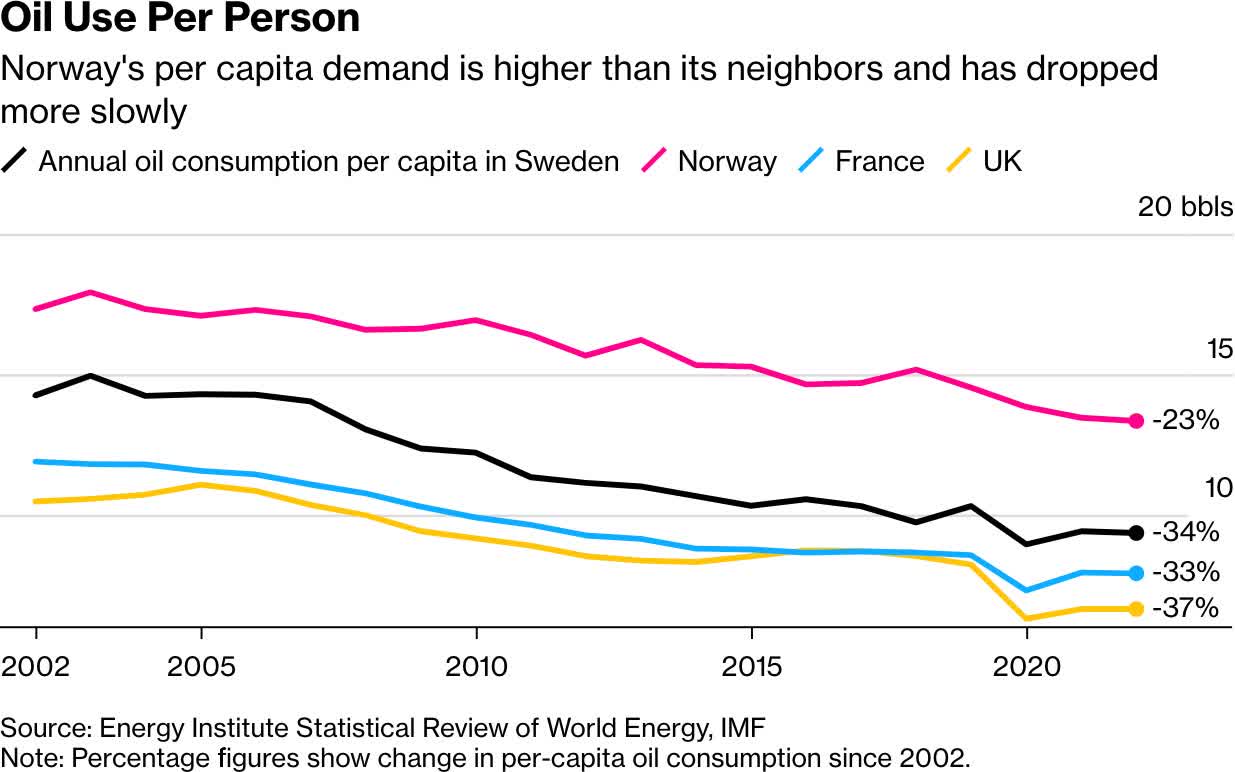
A recent Bloomberg article more confirmed than challenged our views, but it did provide some heart skipping graphs for an energy investor and encouraged me to dig into a bit more data. The article highlighted Norway, which, through generous tax incentives, is the global trailblazer in gas-to-EV fleet conversion. As a percentage of total passenger vehicle sales, EV’s have grown from 3% of annual sales in 2012, to 80% in 2022. As a result, gasoline demand is down 37% since 2013 and over 20% of the Norwegian auto fleet is electric today.
Taken together, these graphs spell impending doom for oil producers, refineries, gas stations and hydrocarbon focused investment funds. But what’s the bigger picture, and why might Norway’s experience not necessarily be the roadmap for the rest of the world? Here are a few data points to help answer that question and generate new ones:
- Over the same period total Norwegian liquids consumption (crude oil and NGLs) declined from 229 thousand barrels a day to 201 thousand barrels a day, only down 12% vs. the 37% illustrated above. (And that could be an aberration since they consumed 216 thousand barrels a day in 2021 and it’s not clear why Norway declined so much 2022/2021, which was unique to them.) Diesel and Jet Fuel usage has continued to grow, helping offset some of the decline in gasoline consumption.
- Norway’s population is 5.4mn, .06% of the global total. Norway does not have a lot of people, which makes it easier to push and achieve transformational policies.
- The per capita GDP of Norway is just under $90,000 per the most recent statistics versus $12,235 for the rest of the world. Norway is very wealthy and can afford subsidies and Norwegians can generally afford new EVs.
- From 2012-2022 per capita primary energy consumption, measured in gigajoules, has declined from 403 to 348 in Norway, while the rest of the world has grown from 73.7 to 75.7. Africa’s per capita primary energy consumption is 14, India’s is 26 and China’s is 112. Half of the world’s population uses a fraction of the energy the average Norwegian uses. Norwegians use a lot more energy than billions of energy starved people.
- The average human on earth consumes the equivalent of 4.4 barrels of oil per year vs. 14 barrels per Norwegian. Africa uses 1.3, India uses 1.4, China uses 3.7. It’s not just clean energy those Norwegians are using.
- Norway generates 8.3x more electricity per capita than the global average. A continent like Africa generates 6x more electricity than Norway but has 230x more people. Norwegians use 24x more electricity than Africans. Many people still just want lights to turn on, let alone power their non- existent vehicle.
- Norway’s oil production declined 0.1% per annum from 2012 – 2022 (again the 2021 data suggest 2022 could be an aberration since oil production would show 6% growth if measured to 2021 instead of 2022) and they produce 60% of all the oil produced in Europe. Ironic the subsidies are funded by oil.
And lastly:
- EV sales as a percentage of annual vehicle sales in China were 35% in June, and the United States managed to grow to 7.2%, after a 45% y/y increase in sales in the first quarter of 2023. The two largest passenger vehicle fleets in the world have some work to do to catch Norway.
Storylines and agendas get pushed by those with their hands on the levers, but the bigger picture doesn’t always match the snippet of information presented.
As always, thank you for your patience and long-term mindset. It allows us to do what we do. And congratulations to my hometown Denver Nuggets on the 2023 NBA Championship! We strive to be as excellent and humble as our MVP, Nikola Jokic.
Best Regards,
Kristopher P. Kelley
Disclaimer & FootnotesThis letter is for informational purposes only and does not reflect all of the positions bought, sold, or held by Legacy Ridge Capital Partners Equity Fund I, LP. Any performance data is historical in nature and is not an indication of future results. All investments involve risk, including the loss of principal. Legacy Ridge Capital Management LLC disclaims any duty to provide updates to the information contained within this letter. This letter may include forward-looking statements. These forward-looking statements involve known and unknown risks, uncertainties, assumptions and other factors which may cause actual results and performance to be materially different from any future results and/or performance expressed or implied by such forward looking statements. Performance for 2018 is provided by Richey May & Associates, our auditor, and was provided via a Performance Review for a separate account that was transferred into the Fund and constituted 100% of the assets of the Fund as of November 1, 2018. Results are net of fund expenses. All performance related figures for the Partnership are unaudited. Indices are provided as market indicators only. It should not be assumed that any investment vehicles managed by Legacy Ridge Capital Management will, or intend to, match provided indices in holdings, volatility or style. Index returns supplied are believed to be accurate and reliable. The S&P 500 is a market capitalization weighted index that measures the performance of the 500 largest US based companies. The Russell 2000 Index is a market capitalization weighted index that measures the performance of the smallest 2000 stocks in the Russell 3000 Index and is a common benchmark for smaller companies. The MSCI World Index is a market capitalization weighted index that is designed to be a broad measure of equity-market performance throughout the world. It is comprised of stocks from 23 developed countries and 24 emerging markets. The AMZ is an index provided by Alerian and measures the return of 32 Master Limited Partnerships on a total return basis. The S&P 500 Energy sub-index comprises those companies included in the S&P 500 that are classified as members of the GICS energy sector. There are currently 28 constituents in the S&P 500 Energy sub-index. The XAL is the NYSE Arca Airline Index. There are currently 14 constituents in the XAL, with most domiciled in the US. This letter does not constitute an offer or solicitation to buy an interest in Legacy Ridge Capital Partners Equity Fund I, LP. Such an offer may only be made pursuant to the delivery of an approved confidential private offering memorandum to an investor. This reporting does not include certain information that should be considered relevant to an investment in Legacy Ridge Capital Managements investment vehicles, including, but not limited to significant risk factors and complex tax considerations. For more information please refer to the appropriate Memorandum and read it carefully before you invest. |
Editor's Note: The summary bullets for this article were chosen by Seeking Alpha editors.
For further details see:
Legacy Ridge Capital Partners Equity Fund I 2023 Mid-Year Letter