TPX - Leggett & Platt: Dividend Growth Could Be At Risk In 2023
Summary
- Leggett & Platt designs, develops and manufactures products and components for homes and automobiles.
- Q3 recorded a significant decrease in margins on the bidding segment.
- Fundamentals in terms of growth and cash flow continue to be good.
Leggett & Platt, Incorporated ( LEG ) is part of the very small circle of the Dividend Kings and this is because, for 50 consecutive years, it has increased the annual dividend. The company, therefore, represents a historical icon, a reality of absolute excellence when referring to the ability to repay shareholders consistently, sustainably, and at a very high-interest rate.
In terms of revenue, growth has also been constant and sustained in the last 10 years and even if the last Q3 saw a slight decline, it is not such to create particular concerns. What is most worrying is the marginality, above all in the bedding segment. If we look at the EBIT Margin for Q3, we notice how this fell to double digits and that the causes could be structural within the company itself. This possible problem could generate a drop in profits in the coming quarters as well and therefore invalidate a cash flow sufficient to guarantee further dividend growth. Analyzing the cash flow we also see that in recent years the CapEx has been significantly lowered, perhaps precisely to favor the continuity of the dividend. And this could represent a risk in the long run. Although the share price evaluation seems to be good, I prefer to wait for confirmation regarding the recovery of margins before opening a long position. My rate is Hold.
General Overview
Leggett & Platt designs develop and manufactures products and components for homes and automobiles. The company, founded in 1883, today could be defined as a globally diversified producer with the most famous product based on steel coil bedspring.
The business activity is divided into three main segments:
- Bedding represents the founding activity of the company with the production of steel coil bedsprings. The company can increase value to customers along the entire supply chain from raw materials to final delivery.
- Specialized Products for automotive, aerospace, and material handling industries represent the most interesting sector in the last period. The products are based on comfort in automobiles, on special piping for the aerospace sector, and on the production of hydraulic cylinders for lifting systems. These are products and services with high added value that have completed the company's business diversification over the years.
- Furniture, Flooring & Textile is the business segment made up of products used in homes and workplaces. The company manufactures and markets components for comfort and style.
Leggett & Platt has an international footprint and, in addition to operations in the US which account for the majority of revenue (64%), it competes in the markets of Europe, China, Canada, and Mexico.
The main business strategy is imprinted on Creating Shareholder Value through earnings growth and capital allocation. The strategic use of cash is based on (in order of importance): organic growth, dividend, acquisitions, and share repurchase. In terms of revenue growth, the official company target is 6-9%.
Financial and Highlights
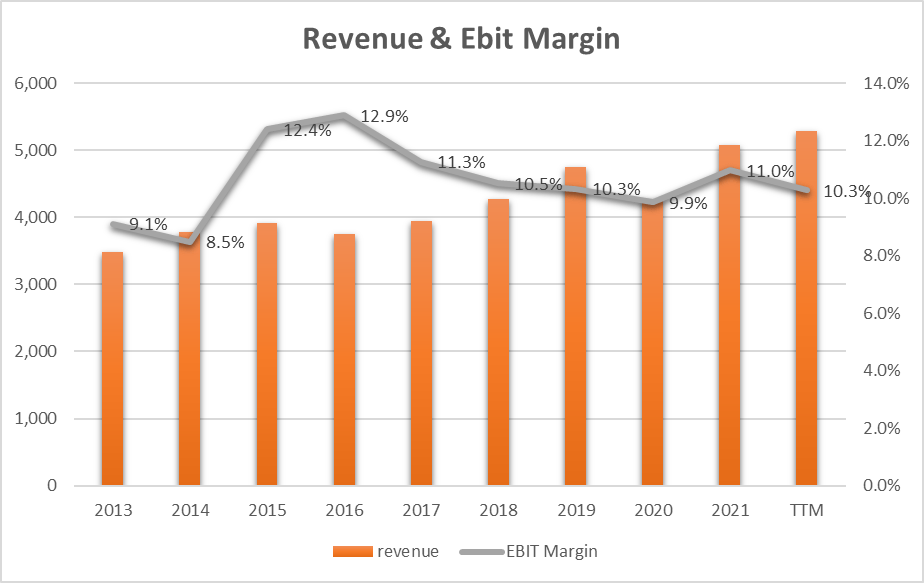
In the last 10 years, Revenue has grown by 4.8% ((CAGR)) and this represents a slightly lower figure than the company's official target (5-6%). The EBIT Margin instead stands at 10.3% ((TTM)) in line with the pre-pandemic years but down compared to 2021 (11%).
The decrease in the latest EBIT margin data requires further investigation and looking at the 2022 Quarters we can see how up to Q2 (11.1%) the data remained in line with the previous year. On the other hand, Q3 marked a heavy decline (8.7%).
Going into the details of Q3, we note that Revenue decreased slightly compared to Q3-21 (-2%) and this alone cannot lead to such a high decrease in margins. Listening to the latest earnings call :
EBIT decreased 21% versus third quarter 2021, primarily from lower volume, lower overhead absorption from reduced production and operational inefficiencies in specialty foam, partially offset by metal margin expansion. Earnings per share decreased 27% versus the third quarter 2021
we note that there are two main components of this decline: lower volume and operational inefficiencies related to specialty foam.
Related to the lower volume we can state that home furniture demand is slowing down following the slowdown in demand from the final consumer and also as a result of the high inventories in the stores. All of this is impacting production in the plants and creating inefficiencies, especially relating to fixed costs.
Other causes can be found in the last earnings call :
You'll recall when Leggett acquired ECS, it was 4 companies that were being brought together, and that was in 2019. So our integration efforts were underway and then really had to be paused once we entered the pandemic. … But specifically, during the pandemic, like everybody else, we were really struggling with labor and also had a difficult time obtaining chemicals. And our priority really became to service as much business as we possibly could during that time. And frankly, we developed some production inefficiencies during that time with those efforts, primarily that's around our labor usage and efficiency and then also our material scrap.
It seems that the company is still working on inefficiencies related to acquisitions made in 2019... I don't think this can be a reliable explanation as the adverse results would have also been seen in Q1 and Q2 of 2022 and this has not happened. I guess that there may be probably structural causes related to production capacity that fails to reduce fixed costs in the event of a decline in demand.
Free Cash Flow, Dividend, and CapEx
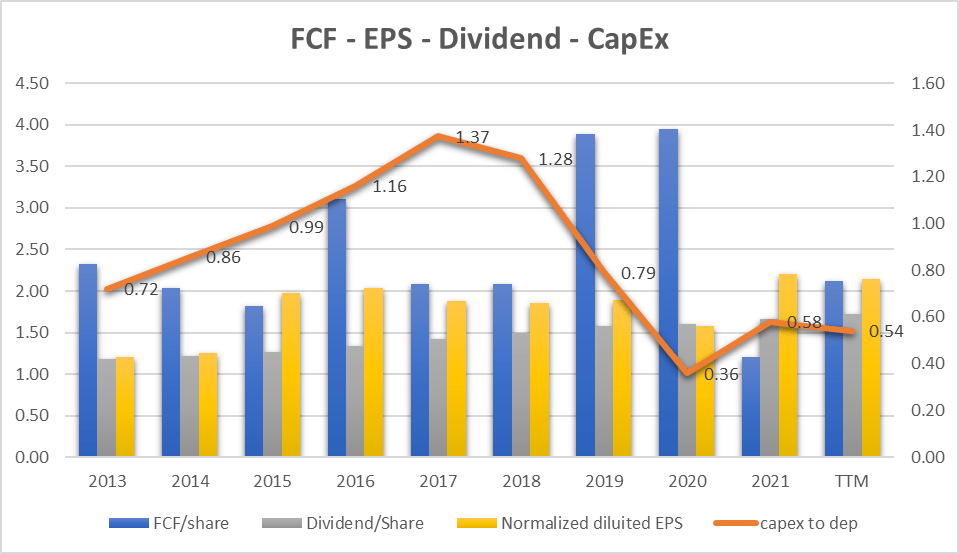
The yellow bars represent the EPS trend and we can see how this is constant and even growing (6.6% CAGR) over the last 10 years. The Free Cash Flow per share (blue bars), on the other hand, does not have the same constant trend but has an irregular trend. In particular, we can see how 2020 saw a peak of FCF/Share ($3.95), and the following year the figure collapsed ($1.21) to the lowest value in the last 10 years. The explanation for this must be found in the management of the inventory which just broke out in 2021.
The dividends (grey bars) are instead constant and growing and closely follow the EPS. This, over the years, underlines the financial stability and sustainability of the dividend.
The orange line represents the ratio between CapEx and Depreciation. We can see that until 2018 the figure was higher than 1 and with a stable/increasing trend. From 2020 to today, the ratio is expected to be much lower than unity (0.54) and this could indicate a serious lack of investments necessary to maintain production assets. In other words, the business is fairly constant, revenue is growing and there are no plausible reasons to understand how the CapEx/Dep ratio could have halved in the last two/three years.
Dividend sustainability
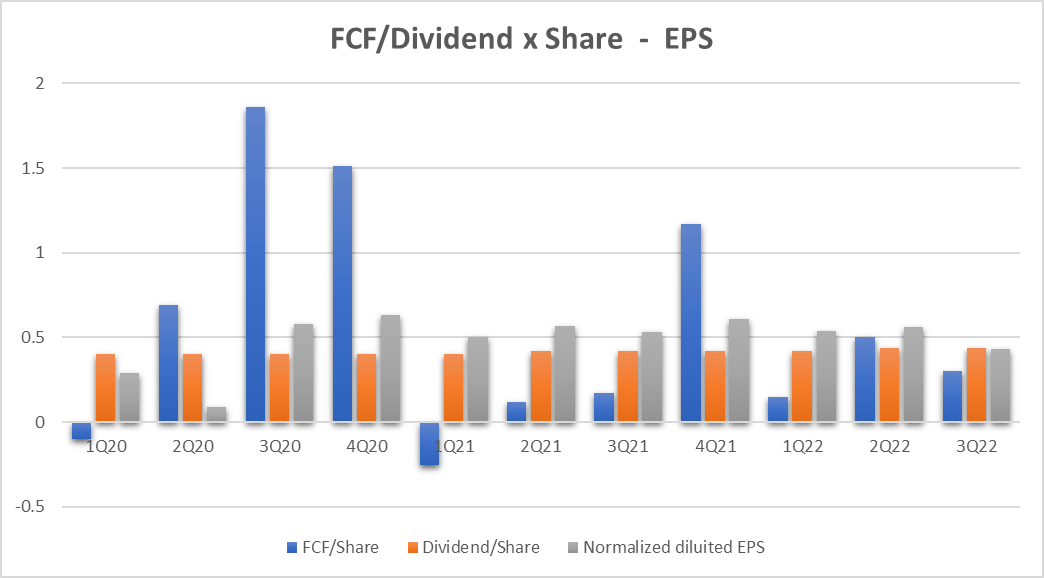
The graph shows the trend of the Free Cash Flow, the EPS, and the dividend at the Quarter level. We can see how in 2020 the blue bars ((FCF)) were high and allowed for the payment of the dividend. 2021, as we saw in the previous paragraph, saw the use of Cash Flow for inventory management, and this caused a significant decrease in the blue bars. Moving on to 2022, we note that the downward trend is continuing also following the decline (especially in Q3) of EPS. The conditions of financial sustainability of the dividend are therefore becoming thinner and in Q3 the Cash Flow is not such as to support the dividend paid.
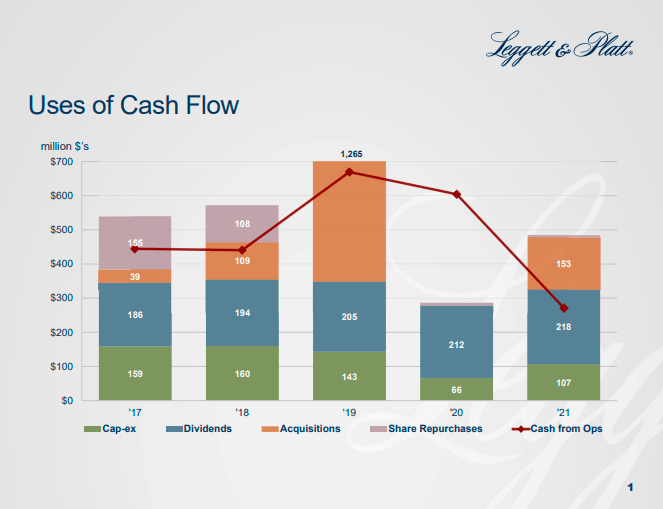
The following graph shows the company's use of cash flow:
We can see how until 2020 the red line (Cash from operations) allowed the full disbursement of the dividend (blue part of the bars) and that in 2021 (due to the inventory) the Cash from Operations dropped for the first time below the limit of the blue bar. Another fact to note is the decrease, in the last two years, of the cash allocated to CapEx (green part) perhaps precisely to allow for the disbursement of the dividend.
Valuation
Earnings Power Value Model
Assuming that the cash profit remains constant over the long term, I use the EPV (earnings power value) method to calculate the share price
The method starts with EBIT. The second step is to add depreciation and amortization and then subtract stay-in-business CAPEX.
The result is the Cash Trading Profit
I then subtract the taxes by calculating the amount using the actual tax rate that the company pays.
The result is the After-Tax Cash Trading Profit
At least to calculate the total company enterprise value I divide the After-Tax Cash Profit by the interest Rate I define as fine for this kind of Company (LEG is a medium-risk company so I decided to use 10%)
The result is the Total Company Earnings Power Value. Dividing the result by the total number of shares we find the value per single share.
The table below shows the calculation for LEG
| EBIT |
| 542.90 |
| Dep & amort |
| 177.90 |
| CAPEX |
| -96.30 |
| Cash Trading Profit |
| 624.50 |
| TAX |
| 22.60% |
| TAX |
| -141.137 |
| After TAX cash profit |
| 483.36 |
| Interest Rate |
| 10% |
| EPV |
| 4833.63 |
| Share in issue |
| 132.6 |
| EPV per share |
| 36.5 |
$36.5 represents the share price valuation using the EPV method. If we compare the data with the current market price ($34) we see that the current price could be seen as fair.
FCF/Share Model
To define a maximum buying price, I use also a formula based on FCF/Share and interest rate.
The formula is:
Maximum buying price = Cash profit per Share/interest rate – 20% (safety discount)
If TTM Cash Profit per share is $2.12
Interest Rate=inflation Rate = 7.1%
Maximum price before Safety discount = 2.12/7.1%= $28.3
The maximum price at 20% discount = $23.6
Under the FCF/Share analysis, it seems that the actual price of $34 is overrated.
Peer Comparison
To compare ENGIY with similar companies in terms of market capitalization in the Home Furnishings industry I have defined the following peers:
- Tempur Sealy International, Inc. ( TPX )
- Mohawk Industries, Inc. ( MHK )
- La-Z-Boy Incorporated ( LZB )
- Ethan Allen Interiors Inc. ( ETD )
- Purple Innovation, Inc. ( PRPL )
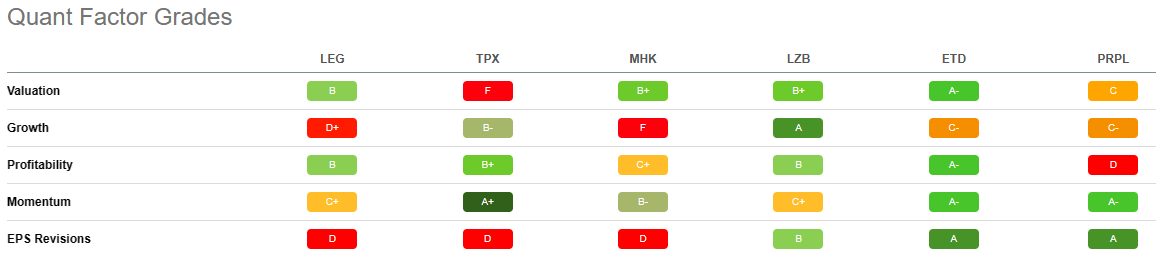
Using Seeking Alpha's Quant Ratings we have a ‘Hold’ verdict related to the ‘Strong Buy’ or ‘Buy’ rating of other companies.
Under the Quant Factor Grades point of view, we can see how LEG has no area where we can find the best grade if compared with peers. Only in Valuation and Profitability, the grade is ‘B’ and represents the best factors for LEG. Growth and EPS Revisions turn on an alarm bell, especially when compared with other companies. This comparison allows us to understand how at this moment LEG has all the ratios, not in the best shape and it could be a sign for the investment thesis.
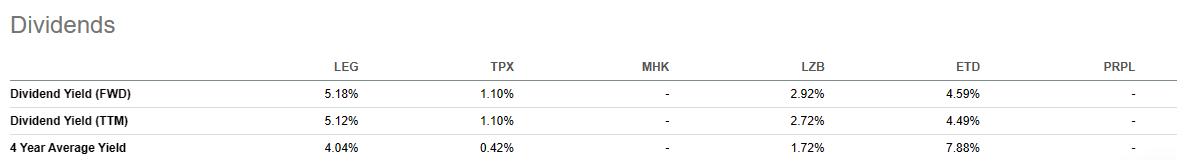
Only if we look at the dividend can we underline how LEG is the best solution especially if we take into account consistency and long-term growth.
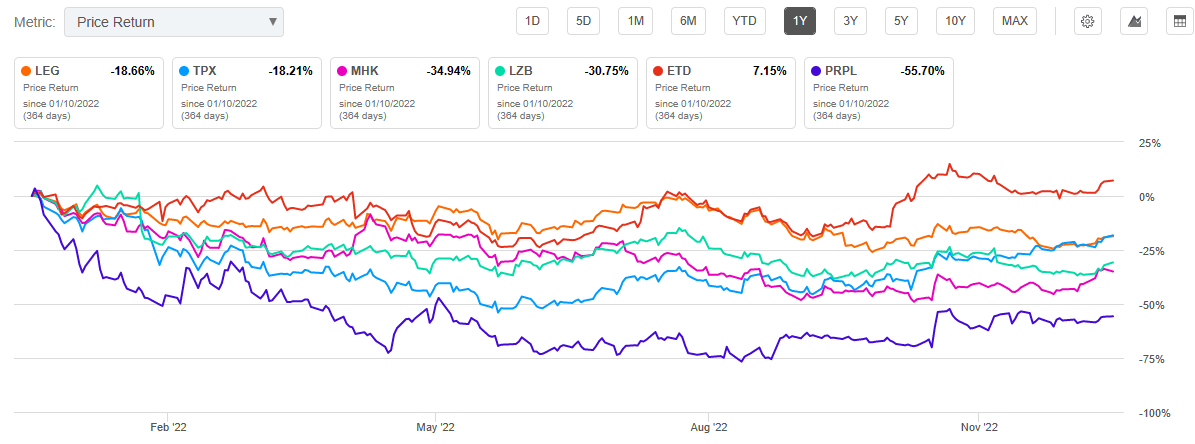
precisely for this reason the market probably did not penalize the share price in the last year where we can record that LEG had the second-best performance together with TPX (-18%). ETD which also has a 'Strong Buy' grade from Seeking Alpha managed instead to outperform the market with an outstanding +7.15%.
Bedding segment profitability and CapEx could be the main risks factors
Beyond the contingent market situation which sees market demand suffer for household supplies, we have noted that there are structural problems inherent in the bedding segment's margins and more precisely linked to the fixed costs of the production plants.
The company is intervening in this general context as we can read in the latest earnings call :
We continue to focus on the things we can control and are taking actions to mitigate the impact of this challenging environment by aligning cost production levels and inventory with demand. We also are evaluating near-term opportunities with our customers and are working with them on new product developments. And we are continuing to build out our existing businesses through acquisitions.
The need to align production costs with demand is a fundamental element for the profitability of the next quarters and in my opinion, represents a high potential risk.
Another aspect that could damage the Free Cash Flow, in the long run, is represented by the level of CapEx that the company is allocating for business continuity. It seems that this level is too low in recent years and this can represent a real risk to profitability.
Bottom Line
Leggett & Platt, Incorporated is a historic company with a long track record of growing dividends. The development was made possible thanks to organic growth and also to targeted acquisitions above all in the emerging segment of specialized products. Cash Flow has been and is today the flagship of the company's financial solidity. Only the last 2022 Q3 highlighted a drop in demand inherent in the historic bedding segment and this highlighted a probable area of company intervention: the reorganization of industrial costs. Another aspect that in my opinion deserves attention is the level of CapEx which could be too low. The valuation of the share price is fair and could represent a good entry point in the long term. The sustainability of the dividend is instead tested by the company's ability to solve the profitability problems of the bedding sector. Waiting to find signs of improvement within the company itself, my rate is currently on Hold.
For further details see:
Leggett & Platt: Dividend Growth Could Be At Risk In 2023