LEN - Lennar Vs. KB Home: The Key Metric You Need To Know Before You Buy
2023-09-22 11:15:12 ET
Summary
- The article provides an overview of the business of homebuilder Lennar Corporation and its much smaller competitor KB Home.
- In addition to looking at the businesses, their operating footprint, profitability and financial strength, I highlight key risks to consider before investing in Lennar or KB Home stock.
- I share my view on Lennar Corp. and KB Home amid the current macroeconomic environment.
- I also discuss why I would not buy KBH or LEN stock at this time and explain an important and widely overlooked metric related to buying homebuilder stocks.
Introduction
Homebuilder stocks have had a fantastic run since their 2022 lows, and especially since the March 2020 plunge. Lennar Corporation (LEN) (LEN.B) has gained nearly 70% since its 52-week low, while smaller competitor KB Home (KBH) has nearly doubled. From their pandemic lows, both stocks have roughly quadrupled. As it looks more and more like interest rates will stay "higher for longer," the question of the future prospects for homebuilding stocks is an interesting one to look into.
In this article, I provide an overview of Lennar and KB Home. In addition to looking at their operating footprint, profitability and financial stability, I will also discuss some key risks to consider before investing in homebuilders, against the backdrop of the current macro environment. I explain why I'm not interested in buying either stock at this time, despite what appear to be compelling valuations at first glance. In addition, I present an important and relatively rarely considered ratio that I take into account when timing the purchase of stocks such as KBH or LEN.
Lennar Vs. KB Home: Business Overview, Operating Footprint, And Profitability
Lennar Corp. is the second-largest homebuilder in the U.S. by market capitalization ($32.5 billion based on LEN and LEN.B weighted average shares) after D.R. Horton, Inc. ( DHI ). Lennar is also No. 2 in the United States in terms of homes delivered, revenues and net profits. KBH is only about 12% as large as LEN in terms of market capitalization or 16% in terms of enterprise value, which means that the company is more leveraged.
Both homebuilders are well diversified geographically. KB Home has four reporting segments:
- West Coast, comprising California, Idaho, and Washington
- Southwest, comprising Arizona and Nevada
- Central, comprising Colorado and Texas
- Southeast, comprising Florida and North Carolina.
Lennar has a much larger geographic footprint, with operations in:
- Arizona, California, Colorado, Idaho, Nevada, Oregon, Utah and Washington (West segment)
- Texas (individual segment)
- Georgia, Illinois, Indiana, Maryland, Minnesota, North Carolina, Tennessee and Virginia (Central segment)
- Alabama, Florida, New Jersey, Pennsylvania, and South Carolina (East segment).
As an aside, the company reports a small number of homes in a fifth segment (referred to as Other), which I have not included in the following illustration due to its insignificant size (e.g., 0.05% of new orders in the third quarter and 0.03% of backlog at the end of the third quarter).
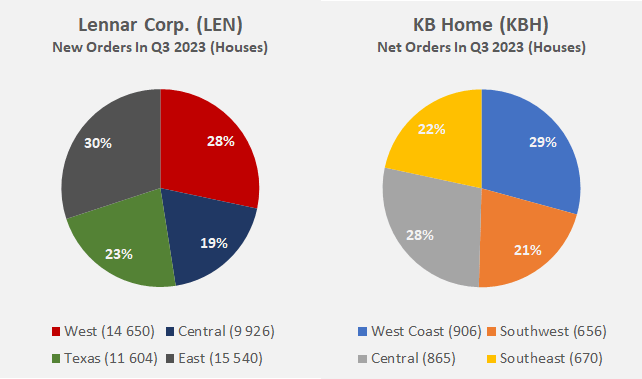
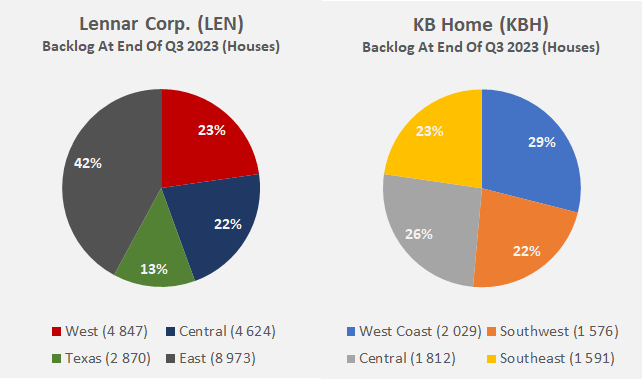
Figure 1: Lennar Corp. (LEN) versus KB Home (KBH): Q3 2023 new orders (own work, based on company filings) Figure 2: Lennar Corp. (LEN) versus KB Home (KBH): Backlog at the end of Q3 2023 (own work, based on company filings)
Looking at new orders in the third quarter of 2023, KBH's much stronger commitment to the western part of the U.S. is evident (Figure 1). KB Home's West Coast and Southwest segments together accounted for 50% of new orders and 51% of backlog, respectively, at the end of the third quarter and compare best with Lennar's West segment, which accounted for only 28% of new orders and 23% of the company's backlog. Personally, I like Lennar's diversification and commitment to the southeastern states better than KBH's focus on the western U.S. and California in particular for demographic reasons. In addition to the more favorable demographics in the Southeast, I am somewhat concerned by the fact that income growth in California has been quite low and real estate prices in the western part of the country are still comparatively high (as evidenced by existing home prices , for example). Conversely, it should be mentioned that California suffers from an acute housing shortage .
What I really like about KBH is its focus on first-time homebuyers and its "Built to Order" process, which improves revenue visibility and reduces the magnitude of impairment charges if housing demand declines sharply. By comparison, D.R. Horton is focused on building homes in line with anticipated demand, leaving the company much more exposed to market risks and, as a result, potentially excessive impairment charges. In return, as long as the forecasts are accurate, one can expect peer group-beating returns.
With Lennar, I tend to view its exposure to multifamily assets negatively, as they are comparatively difficult to sell and typically have longer lead times. That being said, the company had previously announced its intention to spin off these and some other non-core assets as Quarterra Group, Inc., but due to unfavorable market conditions, the transaction was postponed to a date yet to be determined (see remarks by Executive Chairman Miller's during the fourth quarter 2022 earnings call).
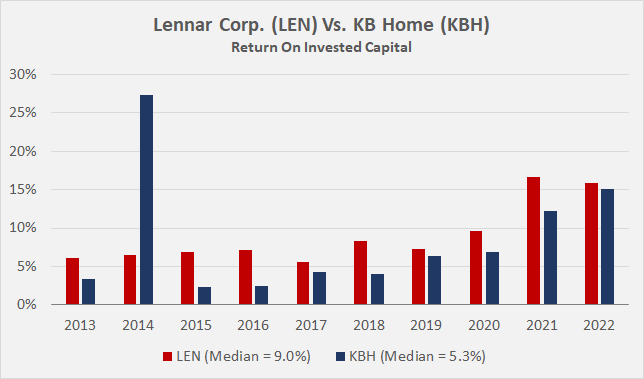
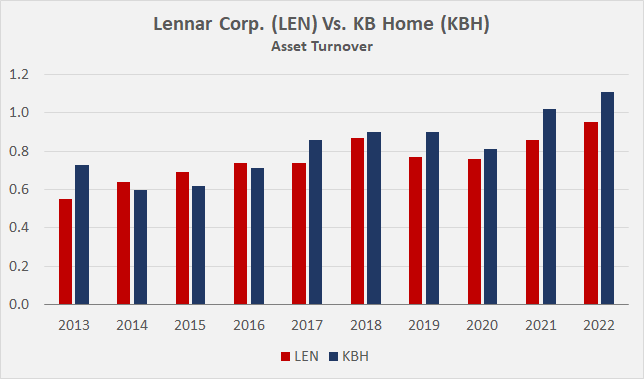
Returns on invested capital ((ROIC)) are cyclical by nature, and the above-average profitability - largely due to low interest rate-driven demand since the pandemic - is readily apparent from Figure 3 and the greatly improved asset turnover over the years (Figure 4). As an aside, KBH's 2014 ROIC of over 25% should not be over-interpreted, as it was largely the result of a $823 million income tax benefit in that year.
Figure 3: Lennar Corp. (LEN) versus KB Home (KBH): Return on invested capital since 2013 (own work, based on data from Morningstar) Figure 4: Lennar Corp. (LEN) versus KB Home (KBH): Asset turnover since 2013 (own work, based on data from Morningstar)
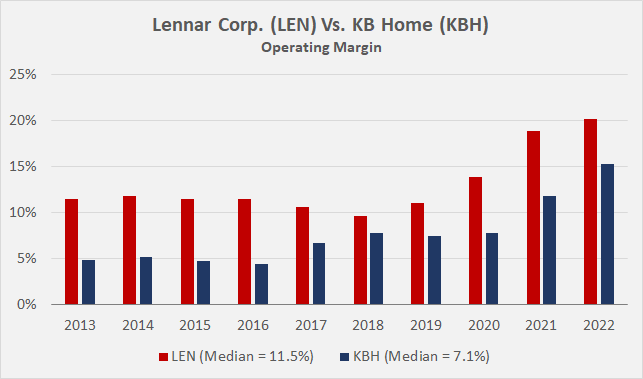
Lennar's significantly better median return on invested capital and higher median (and average) operating margin (Figure 5) confirms its better scale and the associated benefits.
Figure 5: Lennar Corp. (LEN) versus KB Home (KBH): Operating margins since 2013 (own work, based on data from Morningstar)
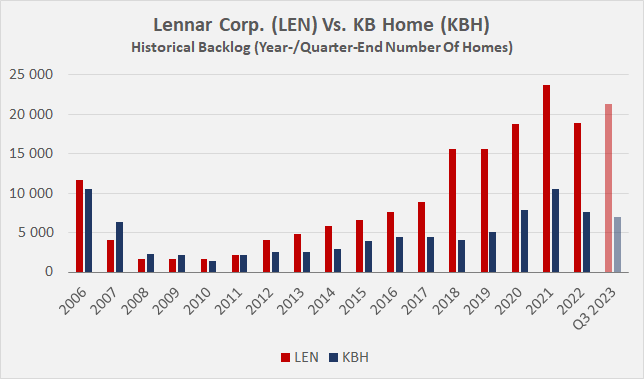
All that said, given that interest rates are likely to remain high for an extended period, it is only reasonable to expect profitability ratios to return to somewhat more modest levels. Backlogs, and thus earnings prospects, are still very solid at both LEN and KBI (Figure 6), but a look at the years leading up to the Great Recession confirms that things can change quite quickly. However, given the current undersupply of new homes in the U.S. (more on that later), I find it difficult to envision a scenario in which homebuilders' profitability collapses, backlogs evaporate, and significant impairments must be taken - unless of course in a deep and prolonged recession.
Figure 6: Lennar Corp. (LEN) versus KB Home (KBH): Year-/quarter-end backlog since 2006 (own work, based on data from Morningstar)
LEN And KBH Shareholder Returns
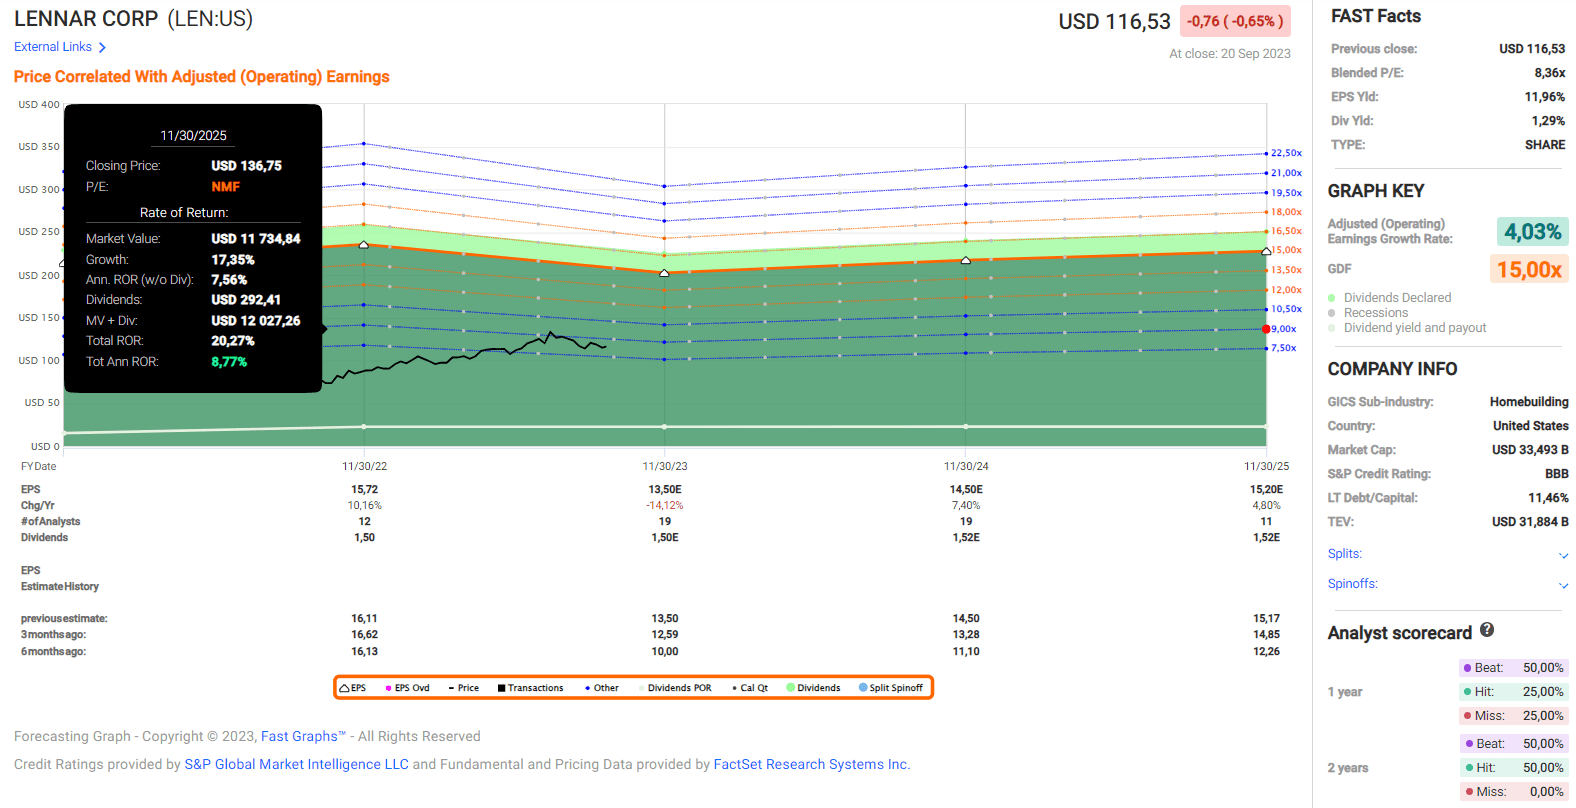
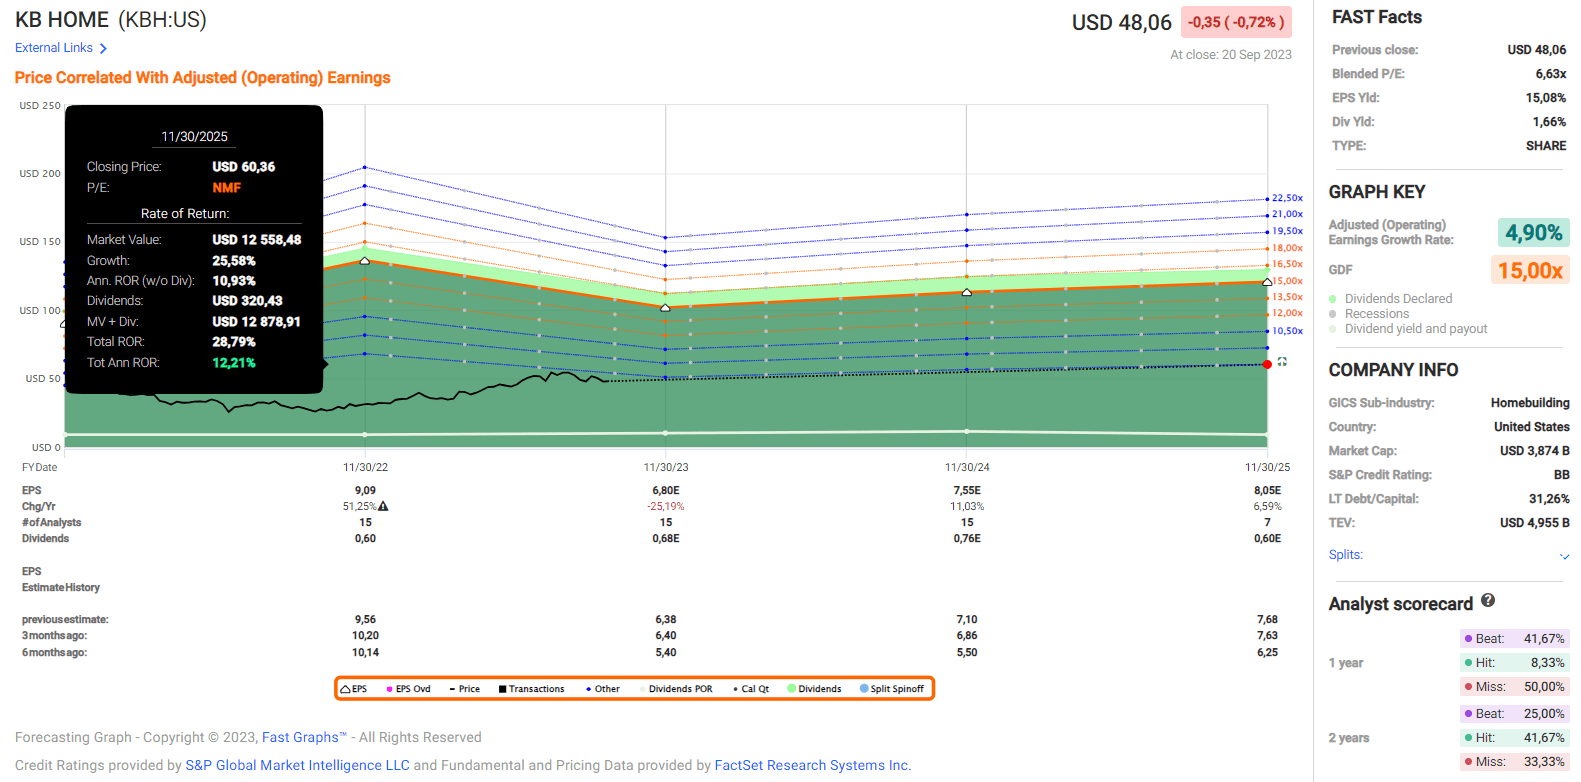
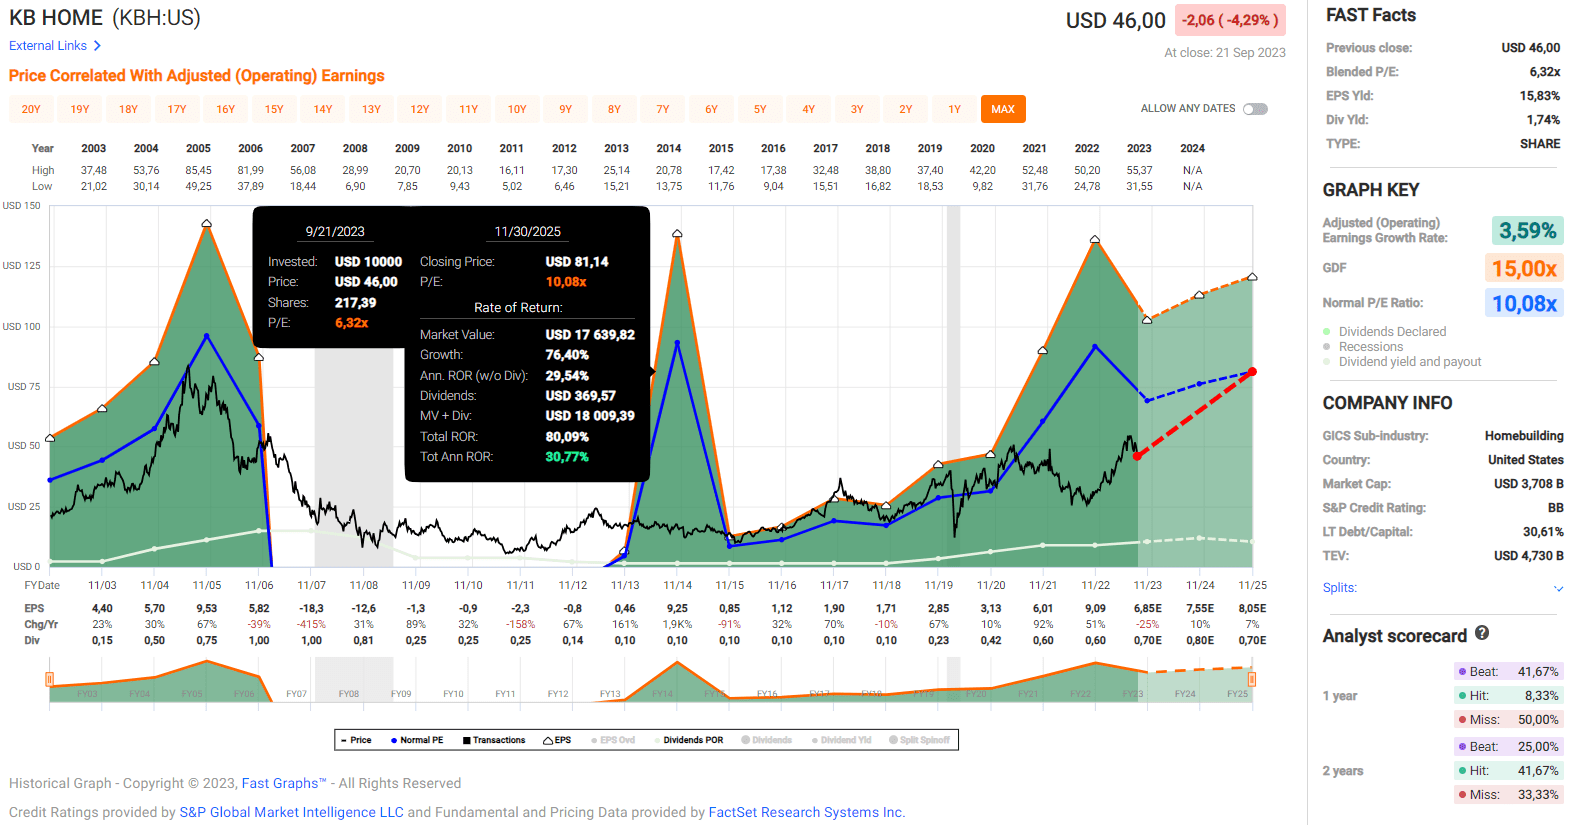
Over the past 20 years, LEN stock has yielded returns similar to the S&P 500 (SPY) (8.5% and 8.7% CAGR, including dividends) and slightly underperformed the index over the past 10 years (11.6% and 12.2%, respectively), according to FAST Graphs. Smaller rival KBH has lagged SPY significantly over the past 20 years (4.7% CAGR), while recent returns have been much better (10-year CAGR of 12.5%). While the 2024 and 2025 growth projections for both homebuilders are good, I would take the numbers (Figure 7 and Figure 8) with a grain of salt, as it is inherently difficult (or impossible) to make accurate long-term forecasts for the housing market.
Figure 7: Lennar Corp. (LEN): FAST Graphs forecasting chart (FAST Graphs tool) Figure 8: KB Home (KBH): FAST Graphs forecasting chart (FAST Graphs tool)
Both companies pay a quarterly dividend. The yields on LEN and KBH are currently 1.3% and 1.7%, respectively, well below the current interest rate on long-term government bonds (e.g. 4.3% for the 10-Year Treasury ). And while KBH's recent 33.3% dividend increase suggests that the stock represents an excellent opportunity for dividend growth investors, it is important to remember that both homebuilders have adjusted their dividends based on operating performance. Both companies had to cut their dividends by 75% in 2008, and since then dividends have been held constant for several years. In my opinion, however, this is to be expected for such cyclical companies and should not be taken as a sign of financial instability (see below).
In addition to dividends, Lennar and KB Home at times buy back their own shares, improving earnings per share ratios. Given their cyclicality, buybacks tend to occur when the business fire on all cylinders and their shares are comparatively expensive. For example, KBH has repurchased about 5.7 million shares so far in 2023 for $250 million, or nearly 7% of the weighted average diluted shares outstanding during the quarter. Lennar has repurchased 7 million shares for approximately $763 million over the past nine months - 2.5% of the weighted average shares outstanding during the quarter.
However, unlike other companies such as Lowe's Companies (LOW) or The Home Depot (HD) - which have significantly increased their debt in order to retire shares at valuations that were quite lofty - I would not call KBH and LEN's share repurchases imprudent from a financial stability perspective.
A Look At The Financial Stability Of Homebuilders Lennar Corp. And KB Home
As mentioned above, KB Home's balance sheet is somewhat more leveraged than Lennar's. While a long-term debt to capital ratio of around 30% is not yet a concern, it is important to recognize that the valuation of assets on the balance sheet depends on market conditions, so a low debt to capital ratio is not necessarily a sign of ultimate financial stability. Personally, I only use the ratio to compare members of a particular peer group, and in that context I naturally feel more comfortable with Lennar's significantly lower debt-to-capital ratio of currently only about 12%. D.R. Horton is somewhat less conservatively financed from this perspective, with a ratio of 20%.
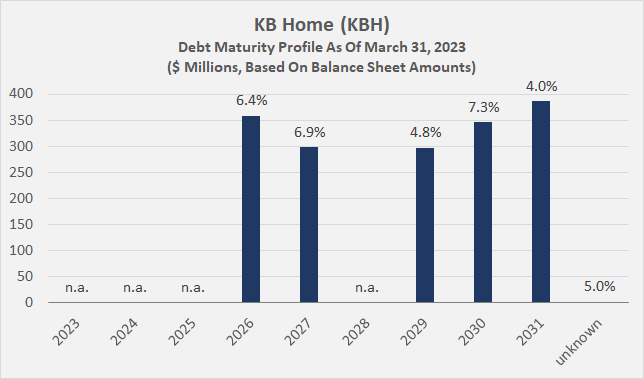
Lennar's long-term debt is currently rated BBB by Moody's after being upgraded one notch in August 2022; the rating is currently not under review and has a stable outlook. In contrast, KB Home is rated non-investment grade ( Ba2 ), but the rating has been upgraded by one notch in May 2021. In June 2022, the outlook for the company's corporate family rating was changed to positive . However, the significant rating difference indicates that the smaller homebuilder has to pay more interest on its debt, resulting in weaker earnings and cash flow profitability, especially in the current interest rate environment. Consider, for example, the $350 million 2030 Notes issued in June 2022 with an interest rate of 7.25%.
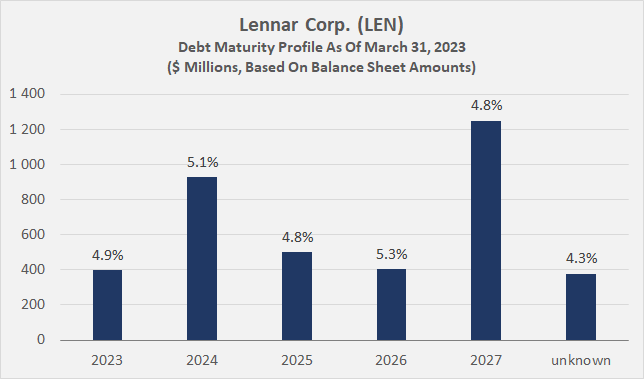
That being said, KBH's maturity profile is not a concern at this point, as the homebuilder does not need to refinance debt until 2026 (Figure 9) and its unsecured revolving facility was undrawn at the end of Q3 (p. 3, Q3 2023 earnings release ). Lennar's maturity profile theoretically looks more worrisome, with $1.3 billion maturing by 2024 and its generally shorter-term maturities (Figure 10). However, it is important to remember that Lennar's strong recurring free cash flow of approximately $3.0 billion annually (average for fiscal years 2020 through 2022) puts it in a very comfortable position, as does its comparatively much lower weighted-average interest rate.
As an aside, please note that the maturity profiles are based on second quarter data, as the most recent data was not available at the time of writing. Also, I had to estimate the interest rate on a small portion of Lennar's debt because the actual interest rate was not reported in the 10-Q.
Figure 9: KB Home (KBH): Debt maturity profile as of March 31, 2023 (own work, based on company filings) Figure 10: Lennar Corp. (LEN): Debt maturity profile as of March 31, 2023 (own work, based on company filings)
All in all, I think both balance sheets are solid, and neither KBH nor LEN appear to be overleveraged. Dividends are well covered by free cash flow, but investors should expect the companies to hold their payouts constant if the demand situation deteriorates. I don't think dividend cuts are on the horizon, but it's still important not to take homebuilders' dividends for granted given their cyclicality.
Cyclical downturns are also usually accompanied by impairments. In my opinion, homebuilders' balance sheets look "too good" during periods of high demand, while they tend to look worse than they are at the bottom of the cycle. However, I would caution readers not to take the Great Recession as a blueprint for the next downturn, as KBH is heavily focused on first-time homebuyers and its "Built to Order" process, while Lennar's land acquisition strategy is much more conservative than it was two decades ago. The lower asset intensity of the businesses - by historical standards - is also reflected in the improved returns on invested capital, although most of the increase in profitability is definitely attributable to the improved demand situation (see above).
Key Risks To Consider Before Investing In LEN Or KBH Stock
The most important risk to consider when investing in homebuilders is, of course, a downturn in the housing market. As explained earlier, a drop in demand has a negative impact on the earnings and balance sheet of homebuilders due to the value adjustments that are then required. Therefore, it is advisable to take a close look at debt covenants and associated limits and how they are calculated. If they are based on the equity ratio or debt-to-capital ratios, it is advisable to perform scenario analyses taking into account impairment charges on the company's assets. Because of the more dynamic approach, I think KBH is better equipped to deal with a downturn than, for example, D.R. Horton, with its emphasis on anticipated demand.
The negative impact of the sharp rise in interest rates on homebuilders cannot be explained away. In general, the number of mortgage applications is inversely correlated with the interest rate on the 30-year fixed-rate mortgage, which is now the highest it has been in over 20 years ( currently 7.6% ). The composite index published weekly by the Mortgage Bankers Association recently fell below 200, a level not seen since the 1990s. The inverse correlation of mortgage applications and interest rates is also underscored by a recent report from online real estate broker Redfin (RDFN), which found that homebuyers are increasingly getting cold feet. Nearly 16% of home sales contracts that went under contract in August were canceled - a 140 basis point increase from a year ago. Housing starts also show modest signs of weakness, having decline 11% sequentially and nearly 15% year-over-year in August. However, building permits fell just 2.7% year-over-year in August.
However, by historical standards, I would argue that housing starts are still at a robust level. Both Lennar and KB Home reported very solid numbers in the third quarter as well. Slowing demand for buydowns suggests prospective homeowners are increasingly getting accustomed to higher interest rates, and KBH management confirmed a solid demand outlook in the Q3 2023 earnings call due to low existing home sales, but also limited availability of new homes in a price range that appeals to Millennials and Gen-Z first-time buyers.
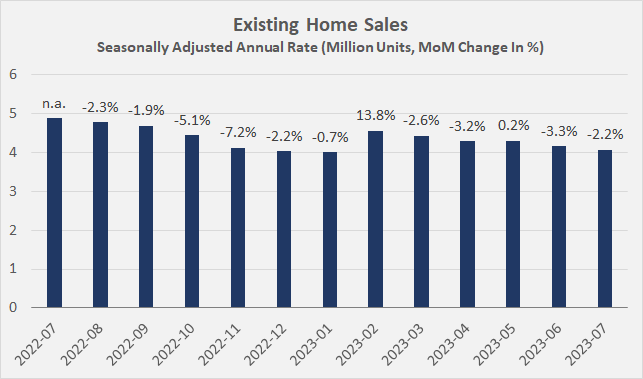
The downward trend in existing home sales - a tailwind for homebuilders - is due in significant part to existing homeowners with a fixed-rate mortgage, who are understandably reluctant to sell because they know they have secured very favorable rates. Existing home sales in 2022 (5.03 million) were well below the numbers for 2021 and 2020 (6.12 million and 5.64 million, respectively), and the trend remains intact for 2023 (Figure 11). The impact of weakness in existing home sales should not be underestimated. As I explained in this article , the percentage of adjustable-rate mortgages in the U.S. is very low, which puts existing homeowners in a much better position than those in European countries such as Poland, Portugal, and Belgium.
Figure 11: Existing home sales in the U.S. since August 2022 (own work, based on data from the National Association of Realtors)
In addition to a downturn in the housing market and a "higher for longer" interest rate environment, which would result in increasing refinancing at problematic rates over the long run, sticky consumer price inflation is another risk, but one that I would not overstate. Consider also the buying activity by private equity firms and other institutional investors for rental purposes, which I expect to offset a potential decline in demand from individuals. However, KB Home appears to be at a disadvantage in this regard due to its focus on single-family homes.
ESG risks are important to consider as well, especially in light of potential lending constraints. However, after reviewing the latest annual reports (see, e.g., p. 20, 2022 LEN 10-K and especially p. 13 et seq., 2022 KBH 10-K ), I do not consider them material for either company. Lennar was rated CIS-2 (second-best rating based on good corporate governance) and KB Home was rated CIS-3 by Moody's in August 2023.
Conclusion – Why I Wouldn't Buy LEN Stock Or KBH Stock At This Time
Lennar and KB Home are both well-run homebuilders whose stocks are - rightly - in an unexpected bull market , as fellow contributor Leo Nelissen so aptly put it in his recent article on KBH . Both companies continue to report solid results, driven by an acute undersupply of new homes and growing demand from Millennials and Gen-Zs, despite the interest-rate-driven decline in mortgage applications.
Lennar and KB Home are benefiting from a tight existing home market, which is not surprising given high mortgage rates and the resulting reluctance of existing homeowners to sell their property. However, weak supply in this segment bodes well not only for homebuilders like Lennar and KB Home, but also for home improvement retailers like The Home Depot and Lowe's Companies due to strong renovation demand, one reason why I started building a position in both stocks last year and this year, respectively.
Both companies are well diversified, but as a conservative investor, I prefer Lennar's broader footprint. While KB Home's focus on built-to-order homes suggests that the company is better insulated against market downturns and thus asset devaluations, I would not over-interpret this risk with Lennar, as the company has become much more conservative in its land acquisition strategy over the years. Since a downturn in the housing market is the most important risk to consider, I also prefer Lennar from a balance sheet and credit rating perspective. I would feel much more comfortable owning shares of an investment grade rated company in a recession.
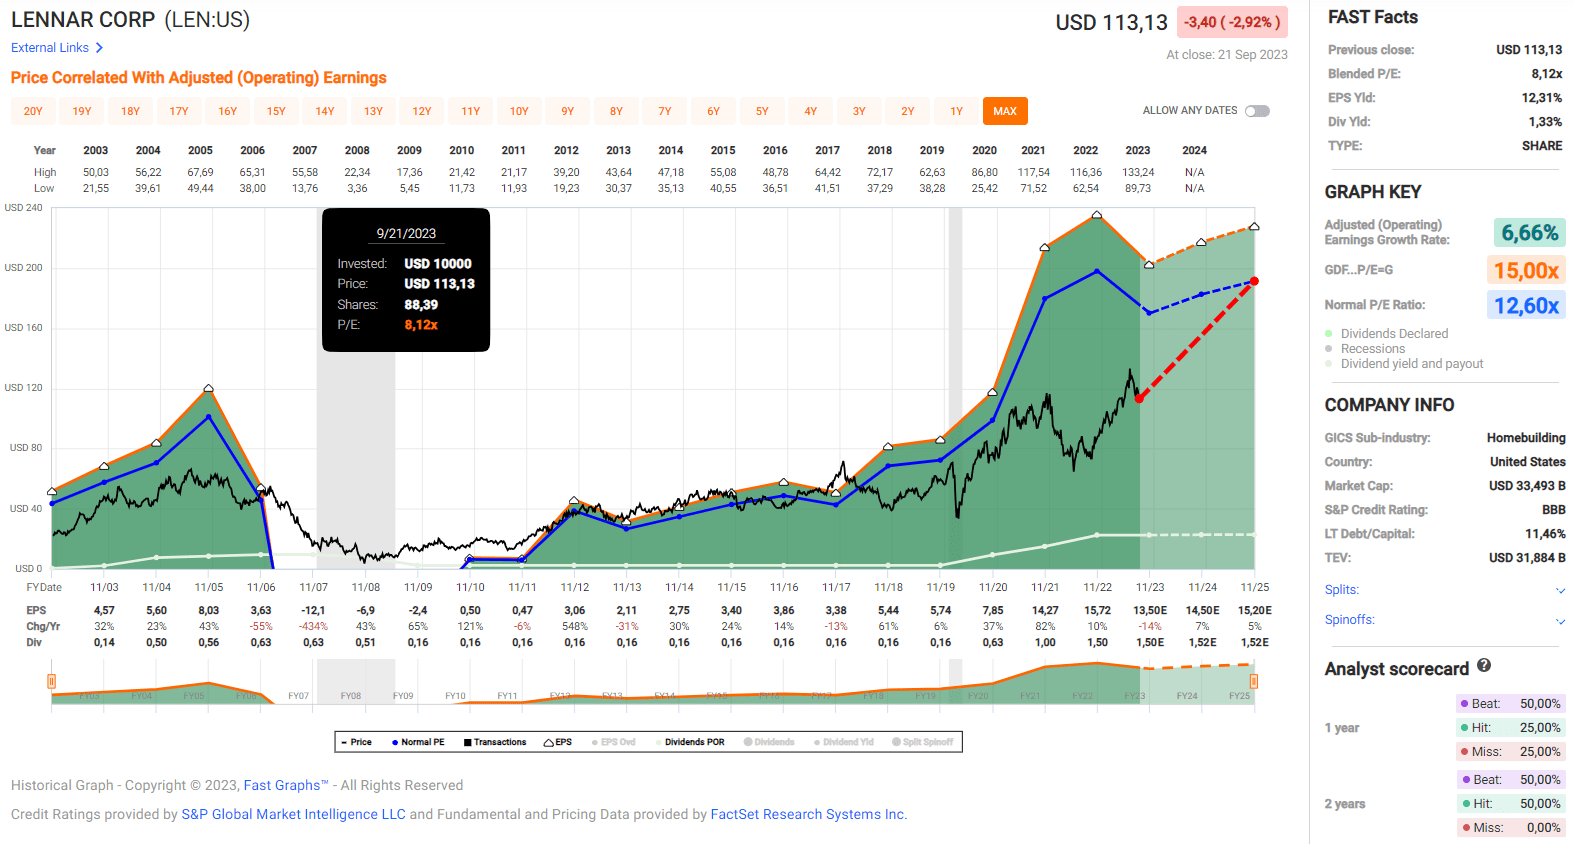
From a valuation perspective, both LEN stock and KBH stock look quite cheap, with blended price-to-earnings ratios of currently 8.1 and 6.3, respectively. Seeking Alpha's Quant system currently rates LEN a B- and KBH a B+ based on various earnings, revenue, cash flow, and dividend-based valuation metrics. Given the weaker geographic diversification and scale, as well as the non-investment grade balance sheet, I believe a valuation discount for KBH stock is warranted when compared directly to LEN. Nevertheless, both seem undervalued, also from a historical perspective:
Figure 12: Lennar Corp. (LEN): FAST Graphs chart based on adjusted operating earnings per share (FAST Graphs tool) Figure 13: KB Home (KBH): FAST Graphs chart based on adjusted operating earnings per share (FAST Graphs tool)
While these data and normal price-to-earnings ratios of 12.6 (LEN) and 10.1 (KBH) suggest that both are good buys today, investors should keep in mind the cyclicality of both companies. In my own portfolio, I make sure I don't overpay for my holdings, and in the case of homebuilders, I also look at the balance sheet when deciding if it's the right time to buy.
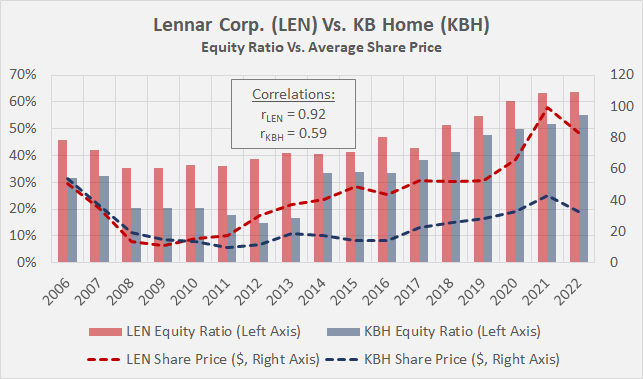
As explained in the article, in a downturn, homebuilders record more or less significant impairments as they adjust the valuation of their assets. Since the liability side of the equation remains unchanged, the consequence is a decline in the equity ratio. Therefore, I buy shares of homebuilders when their equity ratios are declining and weak by historical standards. Figure 14 illustrates the positive correlation between the average annual stock price and the equity ratio for LEN and KBH. However, such cycles can last a very long time, so it still makes sense to keep an eye on the share price and conventional valuation metrics - for example, consider the excellent buying opportunity in early 2020.
Figure 14: Lennar Corp. (LEN) versus KB Home (KBH): Year-end equity ratios versus average annual share price (own work, based on company filings and weekly closing stock prices)
As always, please consider this article only as a first step in your own due diligence. Thank you for taking the time to read my latest article. Whether you agree or disagree with my conclusions, I always welcome your opinion and feedback in the comments below. And if there's anything I should improve or expand on in future articles, drop me a line as well.
For further details see:
Lennar Vs. KB Home: The Key Metric You Need To Know Before You Buy