USA - Liberty All-Star Equity: A Fat 10% Yield From USA
2023-05-08 17:52:20 ET
Summary
- Liberty All-Star Equity is a multi-strategy CEF aiming to distribute 10% of its net asset value to common shareholders every year.
- The CEF currently trades on a small 0.67% discount to its NAV and has not used return of capital to support its quarterly distributions since 2021.
- Whilst down 14% on a price basis over the last year, NAV could be set to recover with the Fed likely set to embark on a dovish pause.
Liberty All-Star Equity ( USA ) is a multi-managed closed-end fund that's chasing a dual strategy of growth and value. The CEF is essentially equally split across five investment management companies but with a 60% weighting toward value-oriented investment styles with the other 40% tilted towards growth. Total returns over the last year sit at negative 5.65% versus a positive return of 1.5% for the S&P 500. The CEF last declared a quarterly cash dividend of $0.15 per share , in line with its previous payout and a 10% forward yield.
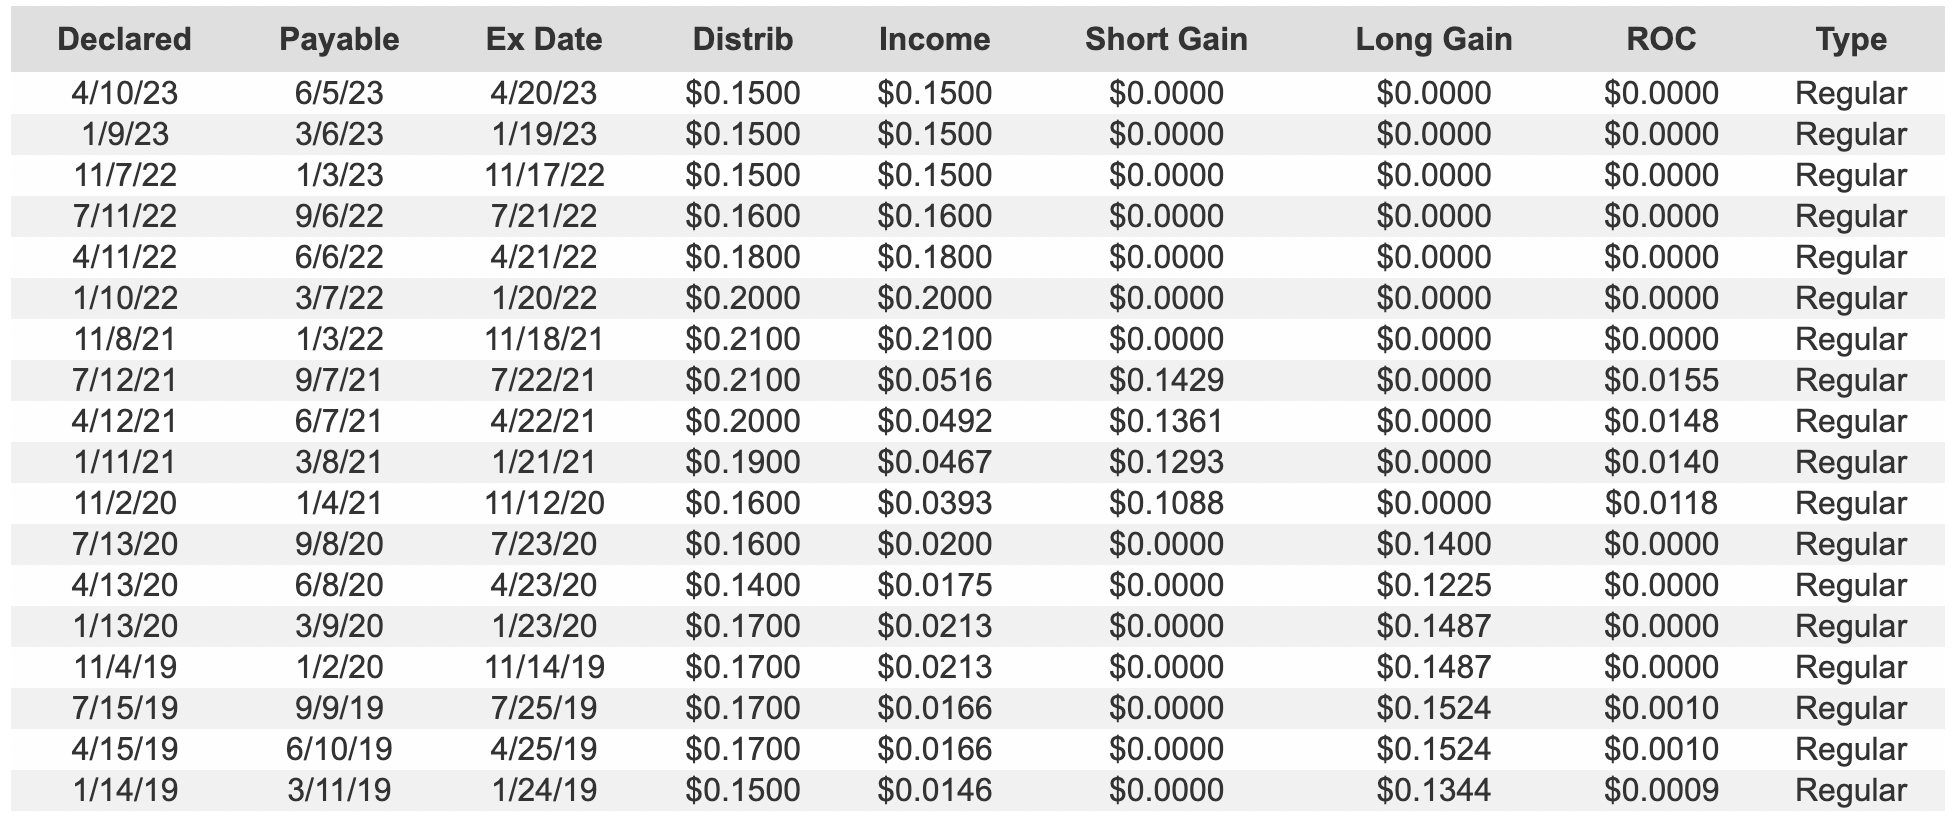
Liberty's distribution policy is based on paying out roughly 10% of its net asset value every year in quarterly installments of 2.5% to common shareholders. These are essentially fixed, hence, buying USA will always see you always net a 10% annual yield. This distribution is meant to be driven by investment income and net realized capital gains, but return of capital can be used in any year when the company's stated 10% NAV distribution target cannot be met by capital gains and investment income.
A Healthy Distribution History
Liberty's distribution history stretching back to the start of 2019 is broadly positive with ROC sparingly used. The CEF has not made any distributions from ROC for its last seven quarters with ROC as a percent of total distributions at 1.99% since the start of 2019. This is an incredibly low figure that works as a serious vote of confidence in the CEF's diversified multi-strategy approach to investing. The inverse of why ROC is destructive is at play here with Liberty able to conserve long-term NAV to the benefit of its common shareholders. This is versus ROC-heavy CEFs who are essentially paid a large expense ratio to return capital.
The dividends have been somewhat volatile over the last five years in response to the change in NAV. Shareholders know to expect 10% of NAV every year but as NAV is driven by the underlying movements of its equity portfolio, this will change in response to yearly volatility. Further, the CEF charges a 0.93% expense ratio and uses zero leverage which is unusual for a CEF of its size. This is set against a 16% portfolio turnover, again quite low to underlie Liberty's 60% value orientation. Value investing is based more on patient capital than other investment styles.
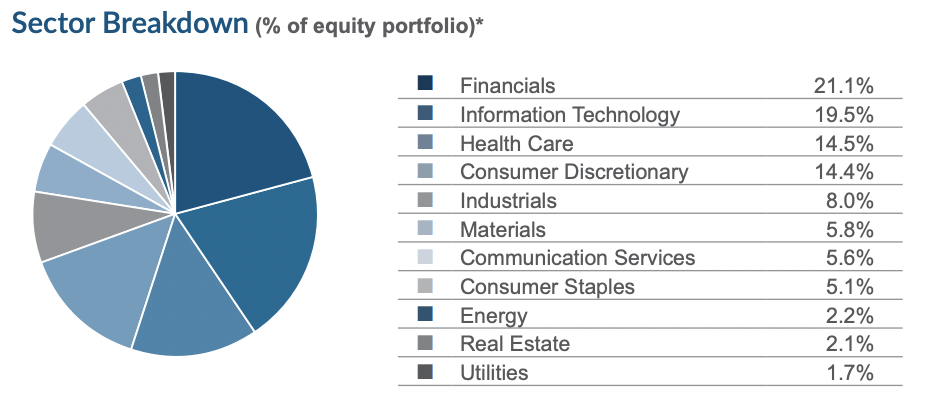
The CEF is broadly exposed to several industries but with a higher concentration on financials, information technology, health care, and consumer discretionary which form 70% of its portfolio. That its five-pronged approach to investing has resulted in a relatively concentrated exposure to these four industries is likely reflective of the respective concentration of value and growth opportunities in these sectors.
Liberty All-Star Equity
The CEF's largest position is in Microsoft ( MSFT ), a stock that's up by 12% over the last year with Alphabet ( GOOG ) ( GOOGL ) and UnitedHealth ( UNH ) forming the other two largest positions. Bears would be right to flag that this large-cap positioning has meant the CEF has a high correlation with the S&P 500. Indeed, Liberty is up 48.36% over the last three years on a total return basis versus a return of 51.4% for the S&P 500. Over the last five years, Liberty is up 54% versus a return of 69% for the S&P 500. Hence, is the 0.93% expense ratio worth it against a 91% price correlation between Liberty and the broader index?
The Premium And Discount
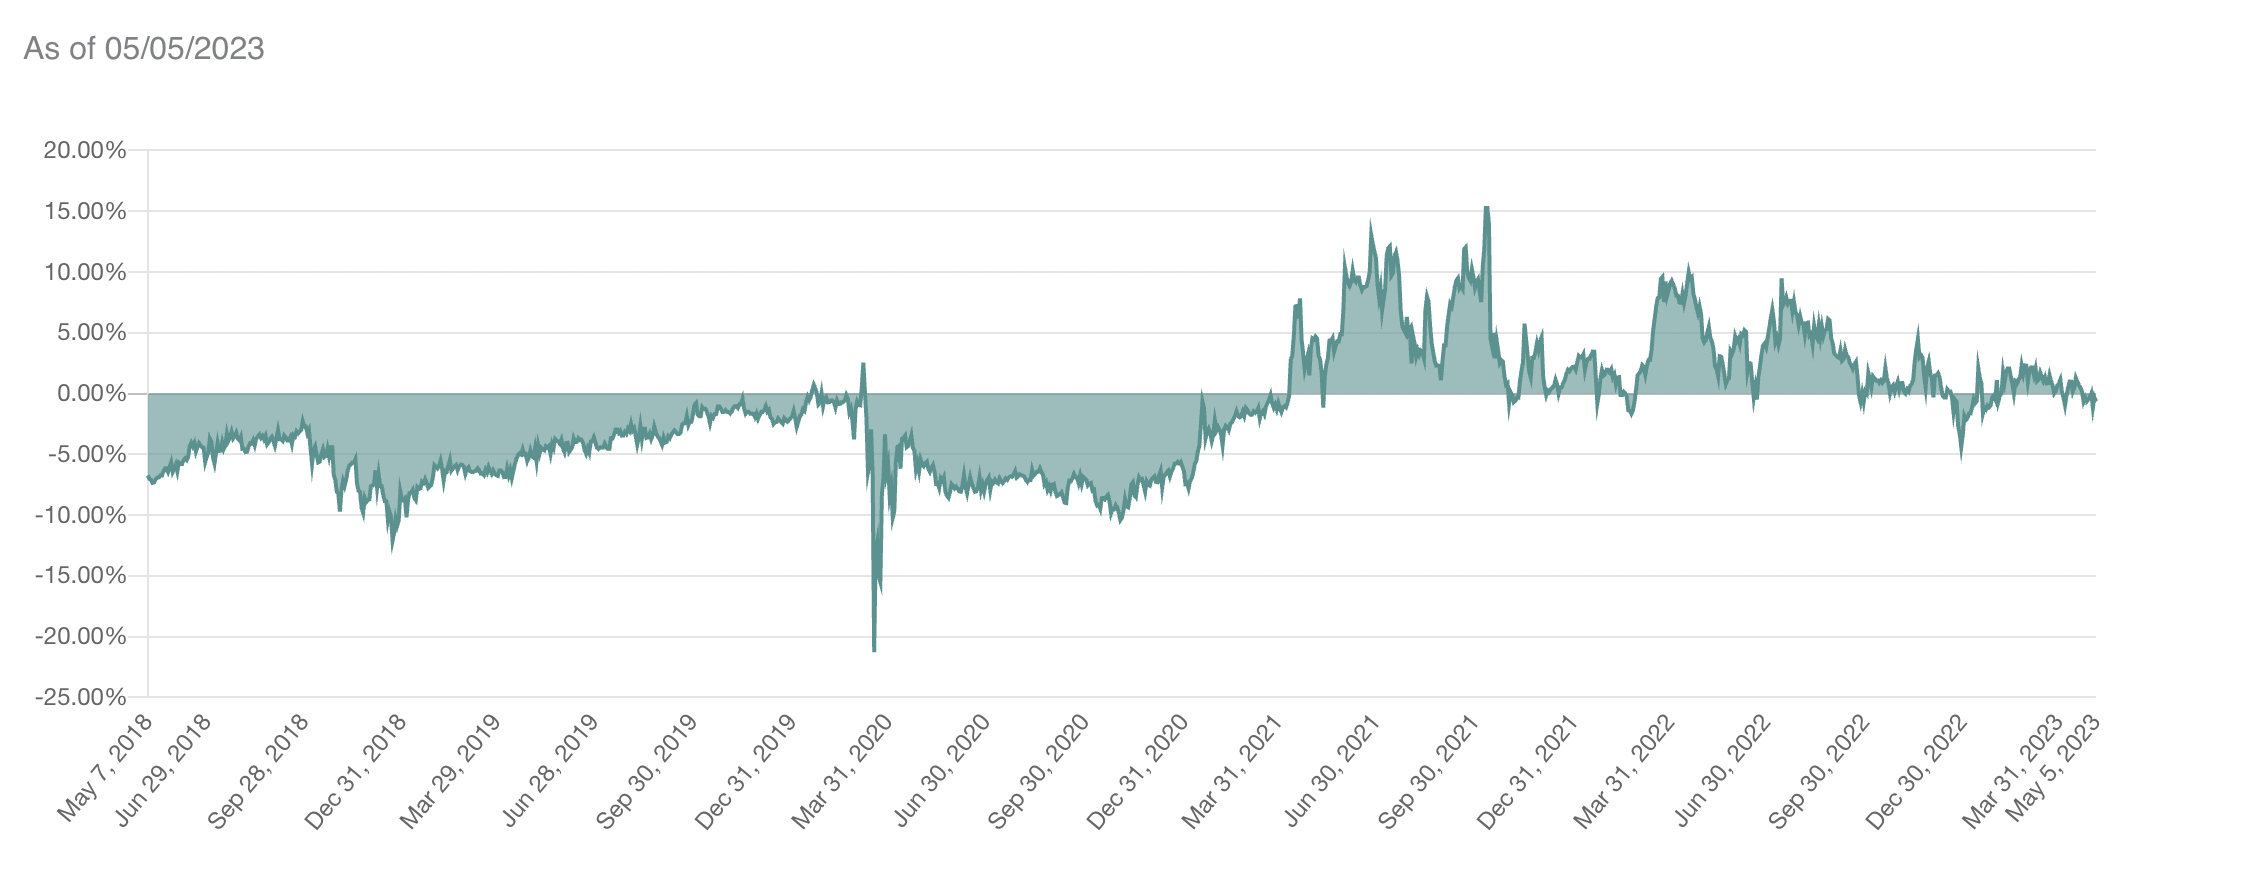
Liberty has traded at an average premium of 0.53% over the last three years. However, this premium has moved as high as 15.27% with a discount that has deepened to as low as 10.41% in the same time period. The early pandemic panic of course represented a material deepening of the discount to NAV. A broad return of the discount in recent months reflects the torrid macroeconomic environment companies are currently operating in. The Fed funds rate has been hiked to new highs, there are pertinent recession fears, and inflation is being forecast to remain above the Fed's 2% target for much of 2023. I think NAV is likely set to recover from its current level with the market pricing in a pause at the next June FOMC meeting. This will come after an inflation reading later this week that will likely form the basis of the highly anticipated dovish pivot.
Total returns for 2023 stand to be positive on the back of this. The CEF has built a portfolio of strong large-cap companies that have weathered broader headwinds so far, but will still benefit from a possible soft landing just as inflation continues to fall closer to the Fed's target rate. I'm rating this as a hold against its low use of ROC against the discombobulation of the last year. Bulls could win out though if inflation figures trickling in over the next few months drop below market expectations as the job market remains strong.
For further details see:
Liberty All-Star Equity: A Fat 10% Yield From USA