LIVN - LivaNova: Profits Not Rotating Into Additional Market Valuation
2023-05-11 05:34:13 ET
Summary
- LivaNova hasn't rotated periodic investment capital into incremental market valuation growth for the last 2-3 years.
- Capital productivity has improved the last few periods, but needs upward mobility to attract investment.
- Investor funds are at risk in my opinion as LIVN can't seem to beat the hurdle on its own capital investments.
- Net-net, reiterate hold.
Investment Summary
There's still a set of microeconomic headwinds that LivaNova PLC ( LIVN ) must overcome in order to create value for shareholders moving beyond 2023 in my informed opinion.
I had originally urged clients to aggressively buy LIVN in December 2020 (see: here ) and reiterated this stance in May 2021, before paring back this rating in August last year amid the broad market selloff. As a reminder of the fundamental changes to the investment thesis:
- Market data factors (shift in factor premia away from top-line growth back into profitability, earnings quality and value).
- Stretched valuations with LIVN, trading at a c.40% premium to sector peers across key multiples at the time of publication.
- Lumpy sales growth across all 3 operating segments from H2 FY'21-2022.
- Thin returns on capital that didn't beat the hurdle.
Despite reasonable top-line delta over the past 2-years, coupled with gross profit upside and business performance, investors have sought more lucrative opportunities elsewhere. Alas, there's a gap in the business performance to investment performance with LIVN. Principally, whilst the firm has compounded revenues these past 2-3 years, this hasn't pulled down to earnings or market valuation at the investor level. Looking forward, my estimates have these trends to continue, and this report explains the reasons why. Net-net, reiterate LIVN as a hold, valuation of 8x forward EBIT.
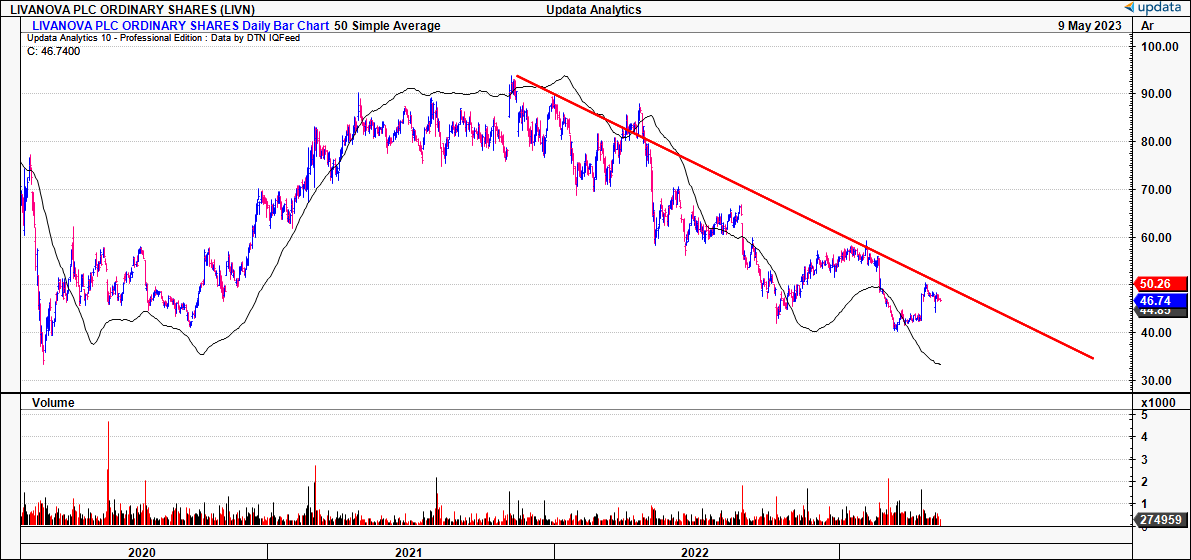
Fig. 1 - LIVN price evolution, 2020-date
Value of current operations on offer
There is value in a firm's steady-state of operations and LIVN's Q1 FY'23 numbers posted last week reveal what we're buying today in the company when paying 18x earnings (at the time of writing). That is $18 for every $1 in current and/or future earnings growth, roughly in-line with the U.S. benchmark. For that price, we'd expect more than the 5.5% forward earnings yield on offer.
(1). Current operations
Move the present day and LIVN's former CEO, Damien McDonald resigned immediately in April, leaving chairman William Kozy as interim chief for the time being. McDonald came to LIVN in 2018 after a 42-year career at Becton, Dickinson ( BDX ). The 5-year tenure's abrupt halt may or may not be performance related.
After all, performance is the Achilles heel letting LIVN down from the investment angle, in my opinion. Looking at the firm's accounting performance, the numbers are quite good. Q1 revenues were up 13% YoY to $263mm , driven by upsides across the entire portfolio (when excluding Covid-19 turnover). Some of this was demand driven, the remainder pricing benefits from increases in 2022.
LIVN is looking at $1.05Bn in turnover this year at the Q1 FY'23 run-rate. Management project $1.06-$1.08Bn, so the momentum needs to pick up across this year. In particular, the cardiopulmonary ("CP") division could get there, with 18% YoY growth to $132mm in Q1. LIVN is still seeing supply chain free up, so you might expect further tailwinds from this. This is important considering the Essenz heart-lung machine's momentum last quarter. LIVN started its broad release in Europe, and secured 510(k) clearance in the U.S. and PMDA in Japan. If there'll be an upside surprise in 2022, it will stem from the CP segment in my opinion. Management expect 7% growth in CP revenues this year, along with 5% in epilepsy sales.
Moving down the P&L, I'd note that from the $23mm in quarterly revenue growth LIVN produced from 2020-date, this carried through to $27mm incremental gross profit growth. Still, OpEx moved down sequentially in Q1 to $183mm and LIVN pulled this down to a quarterly operating loss of $1mm and earnings of positive $7.4mm. On that note, observe the following points:
- R&D investment was marked at $50mm for the quarter, $184mm on a TTM basis. The R&D should be treated as investment capital and not OpEx in my opinion. R&D margin was 18% of turnover in Q1, (up a single point YoY with extra capital towards the Anthem trial), so is a meaningful use of capital.
- Despite a GAAP operating loss of $2.34mm for the quarter (down from $9.5mm profit last year), pre-tax earnings were $9.7mm profit (up from $3Bn in Q1 FY'22).
- The divergence is thanks to a $25.5mm in non-operating income, multiples above the $4mm booked in Q1 last year.
- However, the tremendous gain stems as a function of net unrealized gains and interest income off the company's 2020 senior notes issue.
- The notes have two embedded options, one an exchangeable feature, the other a capped call transaction.
- The options were marked with an unrealized gain of $44.4mm and loss of $23.4mm respectively, along with $4.5mm in interest income, getting you to the $25.5mm net.
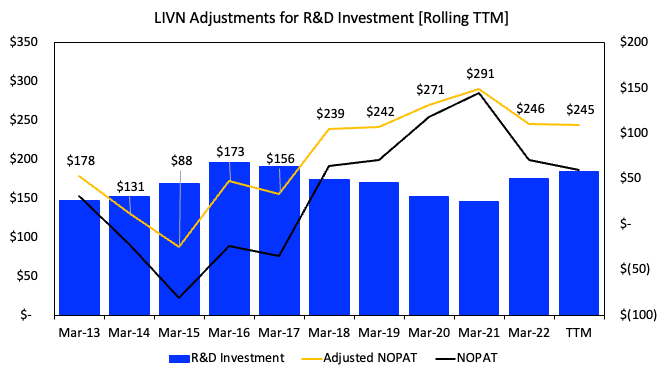
Using tax-adjusted operating income along with other cash-based multiples better shows LIVN's performance, profitability and value by estimation. In that vein, adjustments are in order to R&D to reconcile it is as an intangible asset on the balance sheet. Doing so has base effects to both invested capital and tax-adjusted operating income. The full effects of this adjustment are observed in Figure 2 on an annual basis. On a TTM basis, the company booked $245mm on in NOPAT, a 23% margin that could set up LIVN for a good year. You'll see this is a number that has grown steadily over the past 5+ years, both adjusted and non-adjusted. Still, the reconciliations are quite a change from reported numbers, but more accurately measures the flow of capital through LIVN's hands and the corresponding value created (or lost) in my opinion.
Fig. 2
(2). Growth assumptions moving forward
Carrying these assumptions onto FY'23 growth numbers, LIVN could do another 6% growth to $1.05-$1.1Bn in sales this year, pulling to $2.60 in adj. EPS in my opinion. This would entail a big effort, but with 1) less Covid-19 revenue, 2) more stable inflation and 3) labour issues sorted, it could get there. Management expect these ranges too from the Q1 call, adding some confidence to the estimates. At the current run rate, LIVN could produce $300-$320mm in post-tax earnings (adjusted for R&D) in my opinion, and would require additional NWC and capital intensity to get there. I'd call for the firm to spin off $80-$90mm in cash for shareholders this year and that's not a terrific margin from the $1.1Bn in revenue forecast.
Undeniably, there is identifiable value in LIVN's current operations, based on the latest set of numbers and historical data. But there's large variance depending on the outcomes. For example, under a basic steady-state analysis, assume:
- LIVN produces post-tax earnings of $320mm into perpetuity, no growth, and
- A hurdle rate of 12% (long-term market averages);
;the firm is worth $2.66Bn, i.e. its earnings discounted at the cost of capital, ahead of its $2.5Bn market capitalization at the time of writing ($320 / 0.12 = $2,666). Assuming $300mm however, the market has correctly priced LIVN at $2.5Bn market value ($300 / 0.12 = $2,500). Hence, it tells me the market is expecting $300mm in NOPAT this year, and an extra $20mm on top of this could potentially see the company back trading to $2.6Bn range (assuming the market is a good judge of fair value over time).
These assumptions overlook LIVN's ability to grow (or shrink) earnings in the future. Further, the providers of capital to the business (investors) need a measure of underlying performance for their company against a specified hurdle rate, to see if it is creating economic value or not. Investors typically expect more than just the market return (alpha) when deviating from benchmark indices (beta). If you buy the equity of a business, your money is parked, at risk, against the firm's market valuation. Your belief is the company will utilize that capital better than what you could elsewhere. But how exactly do you measure that in direct comparison?
In order answer this, you need to compare how the company invests $1 of its own capital, versus how you would (or would have) invest (invested) that same $1 if it were your own. That's why using long-term market averages as the hurdle rate is so important in my opinion, as it shows what investors can reasonably obtain elsewhere. If you park your money with a firm's stock, it is what the firm does, not the investor, next that matters. To the investor, the CEO and executives are in many respects akin to a fund manager, who invests in other securities to compound capital. Only that businesses typically have more options to invest in, often at higher rates of return, and use their own capital (vs. secondary capital) to grow the valuation over time. Similarly, without a dividend or buybacks, profits are withheld from investors, and put back to work into new opportunities.
You'd hope all the retained earnings ploughed back into the business eventuate into a higher market valuation. That way, the company is creating value. In that vein, you best bet that each $1 your company puts to work generates a higher return than the benchmark, had you parked the $1 there instead. If a company's capital investments produce incremental earnings above the hurdle rate, the market will typically pay a higher market valuation. This economic profit is a key differential in creating value for shareholders.
To the investment-biased cortex, economic profitability is more informative than accounting profits. You want alpha, and earnings growth doesn't accurately capture the success of capital allocation decisions. Hence, in a firm that is economically profitable, $1 is worth more in the company's hand, than in the hands of an investor.
Taking the 12% discount rate as an opportunity cost, several deductions can therefore be made:
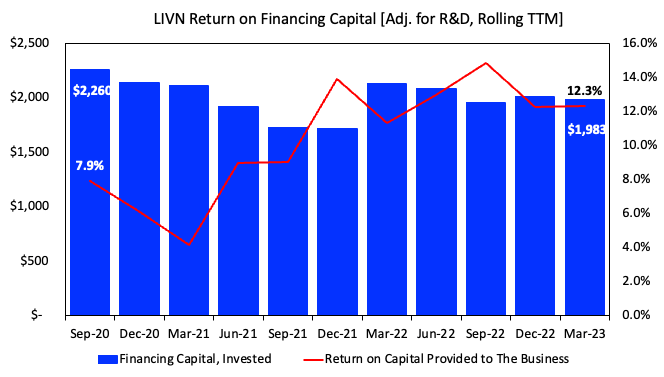
- The market expects LIVN to do $300mm in FY'23 NOPAT in my opinion, which, on ~$2Bn in finance capital (equity, debt + others) would result in c.12% return to the providers of capital to the business. There is $1.23Bn in equity holding up $2.3Bn in assets by the way.
- You'd expect LIVN to be value-neutral with respect to economic profit in 2023, with the 12% ROIC, therefore.
- The question beckons, can LIVN generate a return on investor capital >12% this year? If yes, I'd expect a potential re-rating to the upside. If not, my information tells me further downside could be warranted.
Fig. 3
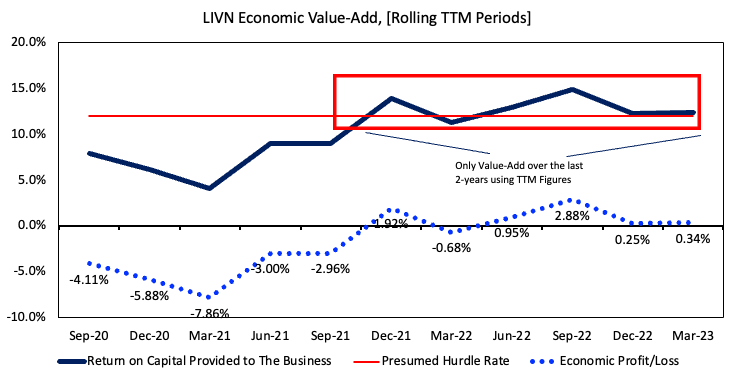
The relationship outlined above does a good job at explaining the longer-term erosion in LIVN's market valuation. Turn your eyes to Figure 4 below, that shows three key measures of investment performance to the intelligent investor. The navy line shows the return on finance capital provided and put to work into the business. The 12% hurdle rate is shown by the horizontal red line. Note, all the regions of navy above the red line are considered economic profits. Realistically, using TTM figures, the only two periods of value-add shareholders enjoyed were in late FY'21 and mid FY'22.
Fig. 4
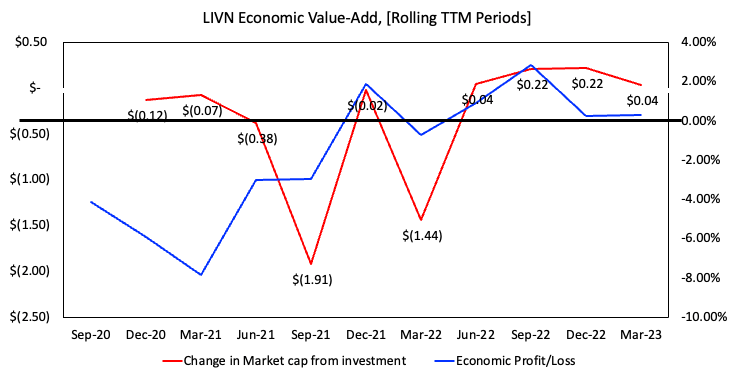
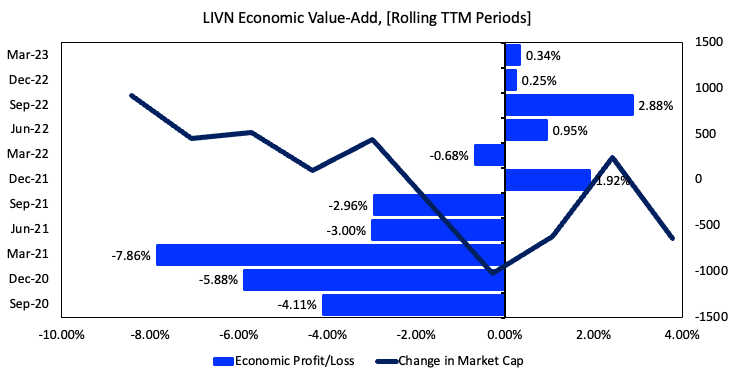
To observe this in action with LIVN's market valuation, the quarterly change in its market cap is taken alongside the quarterly economic profit/loss using rolling TTM periods back to Q3 FY'20. Comparisons are then made between the data. This is presented in two different formats, in Figure 5 and Figure 6, respectively. Looking to the former, note the directional changes in LIVN's market cap each period. You'll note these correspond with the firm's business economics, where each economic profit and/or loss coincide with a positive and/or negative change in quarterly market cap, respectively. This is also seen in Figure 6, where the downtrending change in market cap is reversed in December FY'21 with the first economic profit in 5 quarters, only to reverse lower as these shrink as well. Both instances tell me the market has potentially overlooked bidding LIVN higher given the company isn't outperforming the benchmark on its capital allocation. Moving forward, it is essential the firm hits at least $300mm in adj. NOPAT this year in order to stay somewhat attractive in investor eyes.
Fig. 5
Data: Refinitiv Eikon, Author, LIVN
Fig. 6
Data: Refinitiv Eikon, Author, LIVN
Valuation and conclusion
If the above data wasn't concerning enough, you're asked to pay 47x LIVN's forward GAAP earnings at the time of writing, at more than 2x book value. This adjusts to 18x using my numbers, in-line with consensus . Still, paying $18 for every $1 in future earnings seems a stretch here (let alone $42) given LIVN hasn't shown it can compound capital more efficiently than the market. You'd expect the company to have plenty of high-growth opportunities at its helm, but it doesn't right now. My numbers call to $320mm in FY'23 NOPAT in the upside case. At the current market valuation, that's 8x forward EBIT (adjusting for tax) at the time of writing, below the market's 17.8x rating. Further, I'd value the company at $2.6Bn market cap, 8.3x forward EBIT, and no disconnect in my findings from the market's pricing. I'd expect LIVN to spit off more than 20x my own estimates in this case to be bullish. Hence, in my opinion, there is no dislocation in the consensus on LIVN's market valuation to my estimates of fair value.
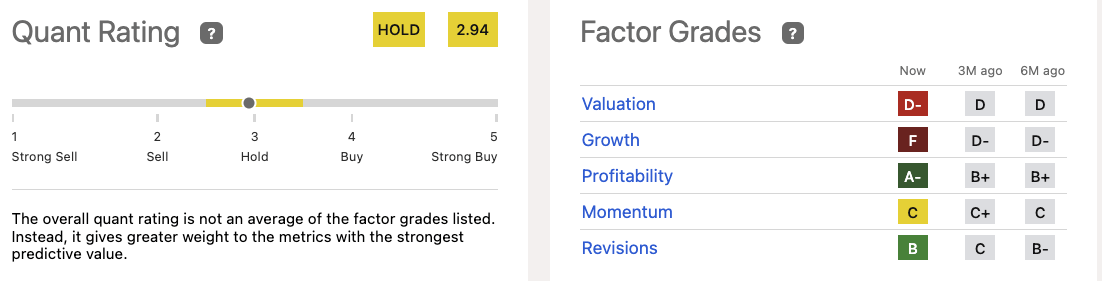
At these multiples, it is unsurprising to see the quant system rate LIVN a hold as well. In particular, valuation and growth factors are lagging in the composite, supporting my own findings. In that vein, there are multiple supportive data points to suggest LIVN is a hold right now.
Fig. 7
In summary, investors reward companies that can increase the value of their money over time. This occurs when firm's compound their own capital at rates higher than the market, demonstrating the investor's ownership in an economic juggernaut that is worth paying higher for. You can see the breakdown of this mechanism in analyzing LIVN. It hasn't rotated capital back into incremental market returns over the long-term, and the market has responded accordingly. I believe even at 17-18x forward EBIT this is tremendously pricey. I'd be looking at ~8x to a $2.6Bn market capitalization. Net-net, reiterate LIVN stock is a hold.
For further details see:
LivaNova: Profits Not Rotating Into Additional Market Valuation