SPLV - LVHD: 4.34% Yielding Dividend ETF Designed For Defensive Investors
2023-10-18 07:46:48 ET
Summary
- LVHD attempts to satisfy low-volatility and high-dividend investors, featuring a 0.75 five-year beta and a 4.37% expected dividend yield. Fees are 0.27% and the ETF manages $904 million in assets.
- A key question is whether investors will turn to ETFs like LVHD in a recession. LVHD's track record in drawdowns is mixed, and its weak 8.22/10 profit score is problematic.
- Furthermore, analysts expect just 1.61% earnings growth over the next twelve months from LVHD's constituents. That suggests the ETF won't do well in a recovery either.
- I struggle to find a place for LVHD, as it's become clear combining the low-volatility and dividend factors is too challenging. LVHD is better than competitors like SPHD, but not enough to warrant a buy rating.
Investment Thesis
This article provides follow-up coverage on the Franklin U.S. Low Volatility High Dividend ETF (LVHD), a fund meant to appeal to risk-averse investors seeking approximately 4% in annual dividend income. At the time, I cautioned against LVHD and other low-volatility peers based on how poorly it scored on key fundamental metrics like growth and quality. However, LVHD's managers have made adjustments over the last five months, so I wanted to update my thesis. Therefore, this article assesses whether the low-volatility and high-dividend combination will likely safeguard your assets in a recession and discusses other factors worth focusing on when building your portfolio. I hope you enjoy the read.
LVHD Overview
Prior Coverage, Reason For Update
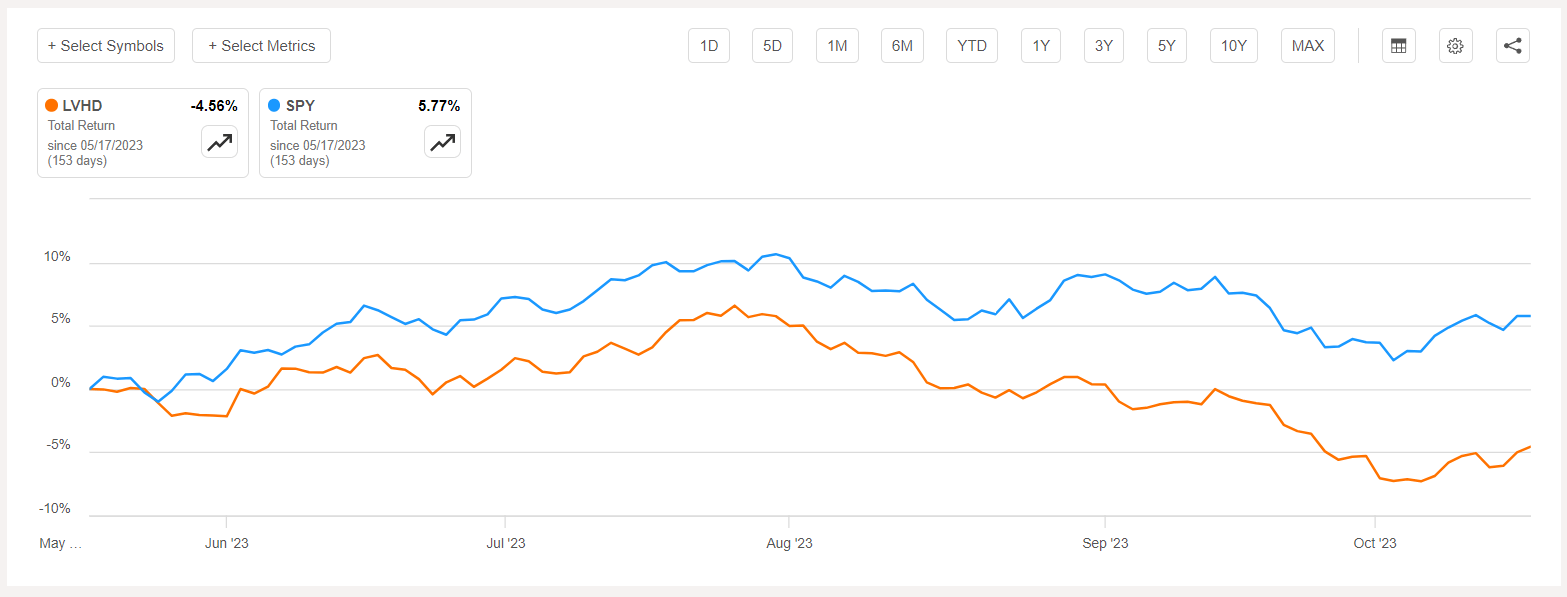
Since I cautioned investors against buying LVHD in May , the fund has underperformed the SPDR S&P 500 ETF ( SPY ) by 10.33%, a surprising amount that can improve its value proposition.
However, LVHD's Index has added eight stocks since then, including Lockheed Martin ( LMT ), an Aerospace & Defense stock that has spiked 10.08% since Hamas militants attacked Israel on October 7, 2023. These additions change the fund's composition, and the purpose of this update is to see if it's significant enough to change my prior "hold" rating. I've listed the other seven additions below, including General Mills ( GIS ) and Crown Castle International ( CCI ), two other low-beta stocks.
- General Mills ( GIS )
- Crown Castle International ( CCI )
- PNC Financial Services ( PNC )
- National Storage Affiliates ( NSA )
- Retail Opportunity Investments ( ROIC )
- Vector Group ( VGR )
- Merck & Co. ( MRK )
In exchange, the Index deleted seven stocks, including Health Care giants CVS Health ( CVS ) and AbbVie ( ABBV ), which have matched the broader market's returns since May. These are good examples of how the high-dividend strategy works. As soon as stocks do well, their yields decline and are typically screened out at the subsequent reconstitution. As a result, portfolio turnover is often high (52% in 2023 per the latest annual report ), and investors must keep up with the changes. The other five deleted stocks were:
- International Paper ( IP )
- First American Financial ( FAF )
- Avangrid ( AGR )
- Lakeland Bancorp ( LBAI )
- Washington Trust Bancorp ( WASH )
I'll evaluate whether these changes are substantial enough to impact my view of LVHD, but first, I want to discuss what I perceive as an inherent flaw with the strategy: its profitability screen is inadequate.
Strategy Discussion: Profitability Screen Inadequate
LVHD tracks the Franklin Low Volatility High Dividend Index, typically selecting 50-100 low-volatility securities from an eligible universe of the largest 3,000 U.S. stocks in the Solactive US Broad Market Index that can pay reasonably high dividends. According to Franklin Templeton, companies must have been profitable over the last year and have yields supported by earnings, as determined by a proprietary "stable yield" score. The Index is reconstituted annually and rebalanced quarterly, with stock and sector constraints set at 2.5% and 25% (15% for Real Estate).
The approach sounds reasonable, mainly the focus on profitability. However, LVHD's approach to assessing profitability is inadequate. Using Seeking Alpha's Profitability Grades as inputs, LVHD scores just 8.22/10, or #51/86 low-volatility or dividend-focused ETFs I track. Furthermore, the ones with worse scores are primarily small-cap ETFs where high profitability isn't expected. Once limited to ETFs with weighted average market caps above $50 billion, LVHD ranks #51/58. In my view, it's a big problem in both recessions and recoveries. LVHD is unlikely to attract "flight to quality" investors in uncertain environments, and they don't have enough earnings growth potential to be appropriate in risk-on environments.
Performance: Total Returns With Reinvested Dividends
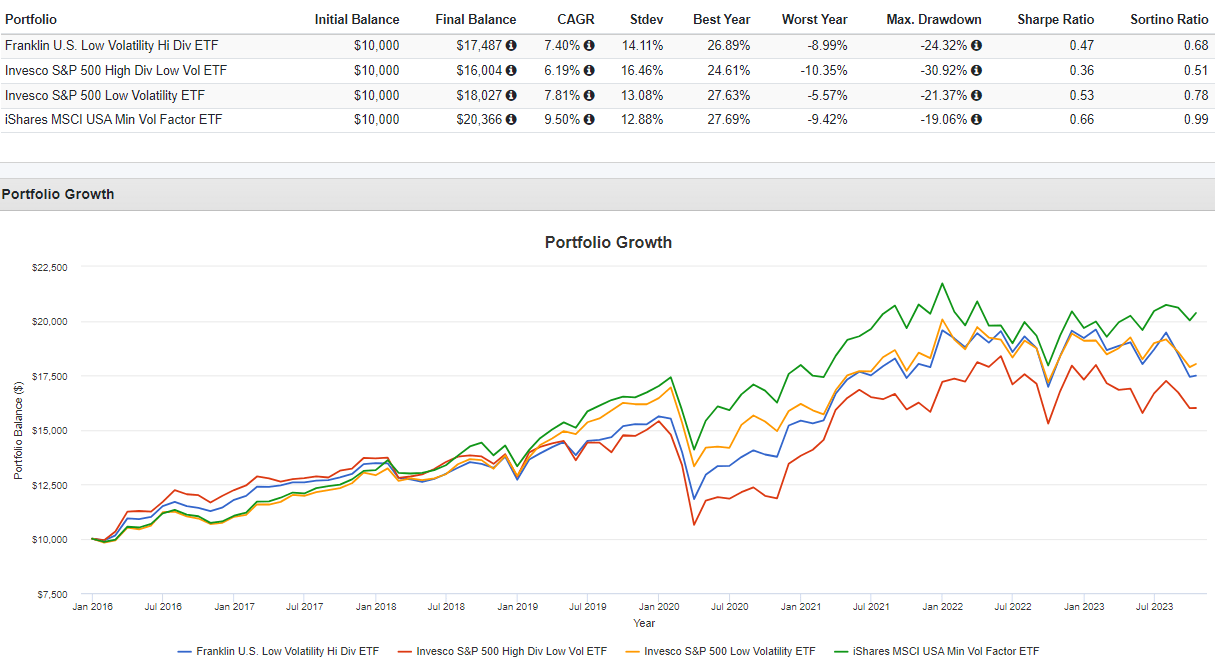
The following table highlights LVHD's total returns with reinvested dividends since January 2016, the first month after its launch date. As a direct peer, I've also included returns for the Invesco S&P 500 High Dividend Low Volatility ETF ( SPHD ) and two low-volatility funds: SPLV and USMV . The low-volatility funds won't provide sufficient income, but I've included them as options so readers can see what they sacrifice when trying to add a high yield to the mix.
LVHD delivered an annualized 7.40% gain compared to 7.81% and 9.50% for SPLV and USMV. These two ETFs also realized less volatility, as measured by standard deviation, leading to stronger risk-adjusted returns (Sharpe and Sortino Ratios). LVHD beat SPHD by 1.21% per year, but it's worth mentioning that SPHD is one of the ETFs with a lower profitability score than LVHD (8.09/10). It's challenging to name a minimum score, but for large-cap ETFs, my observations indicate it's around 9.10/10 or 9.20/10.
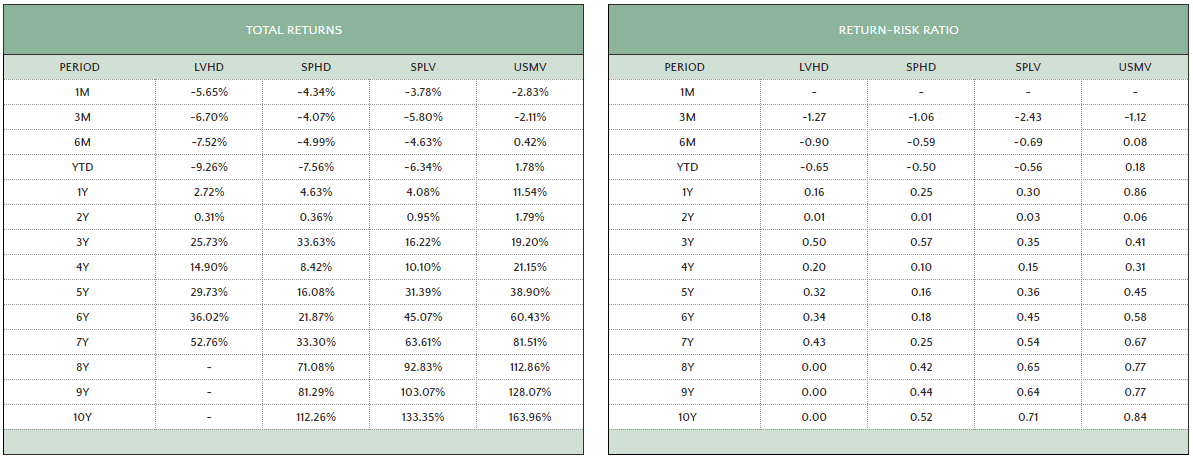
Also consider the table below, which highlights periodic total returns and total return-risk ratios, which is the Sharpe Ratio excluding the risk-free rate. Through September 2023, LVHD is behind USMV, my preferred low-volatility pick, on every period except for the last three years (25.73% vs. 19.20%).
Performance In Drawdowns
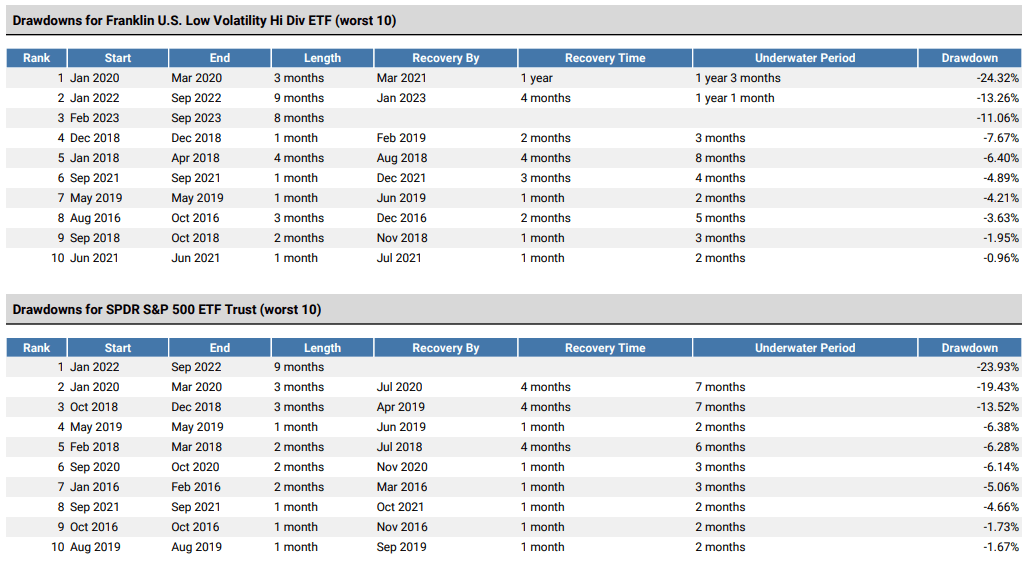
LVHD's track record in drawdowns is mixed. Using the SPDR S&P 500 ETF ( SPY ) as a benchmark, LVHD underperformed in Q1 2020 (-24.32% vs. -19.43%) but outperformed in the first nine months of 2022 (-13.26% vs. -24.32%). Also, LVHD declined by 11.06% from February 2023 to September 2023 and has yet to recover. Meanwhile, SPY gained 6.34%.
As mentioned earlier, recoveries can be longer. LVHD took one year to recover from the Q1 2020 crash compared to just four months for SPY. It's also recovered just 0.27% from the current drawdown in October, while SPY tacked on an additional 2.13%.
LVHD Analysis
Dividends
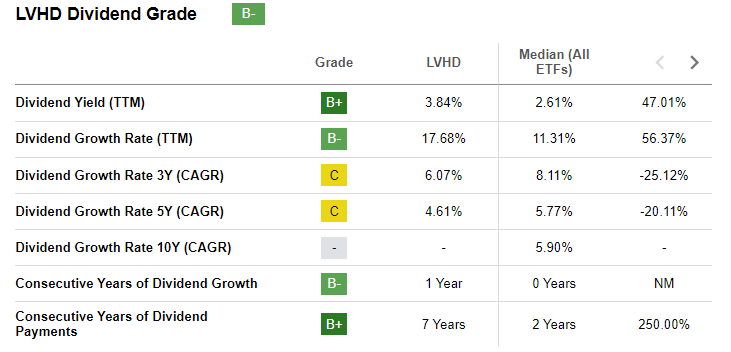
LVHD received a "B-" overall dividend grade, according to Seeking Alpha's Quant System. Its strengths include a reasonably high 3.84% trailing dividend yield and a 17.68% one-year dividend growth rate. However, dividend growth rates over the last three and five years were less impressive at 6.07% and 4.61%, respectively.
On five-year dividend growth, the Schwab U.S. Dividend Equity ETF ( SCHD ) and the First Trust Morningstar Dividend Leaders ETF ( FDL ) fared much better at 13.69% and 8.27%, respectively. However, no matter the ETF, investors should understand that price appreciation should support dividend growth, and price appreciation typically happens to growing companies. There's no free lunch in investing, so if a company raises dividends without increasing earnings, it's only a matter of time before its share price falls substantially.
Fundamentals
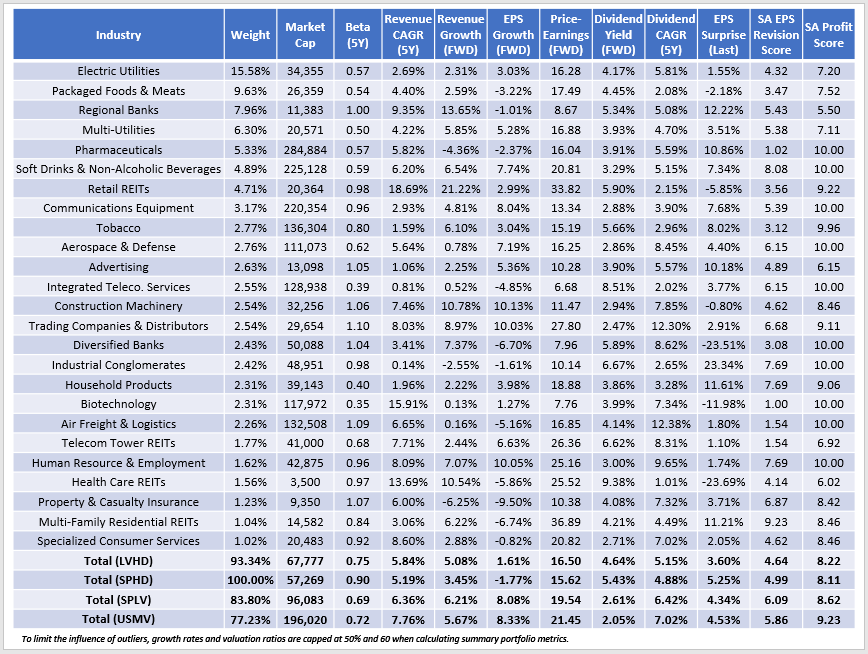
The following table highlights selected fundamental metrics for LVHD's top 25 industries, totaling 93.34% of the portfolio. As shown, Electric Utilities (15.58%) dominate the fund, a sub-industry that has performed terribly in 2023 after a resilient 2022.
I want to make a few observations:
1. LVHD's gross dividend yield is 4.64%, and after subtracting its 0.27% expense ratio, shareholders should net approximately 4.37%. Evidently, SPHD places more emphasis on dividends, as its gross yield is 5.43% (5.13%), while LVHD emphasizes the low-volatility factor based on its lower five-year beta (0.75 vs. 0.90). It's worth noting that SPHD's 0.90 five-year beta is par for the course for large-cap dividend ETFs. Popular choices like SCHD, VIG , VYM , and DGRO are around this level, so I view SPHD as a pure income play fund with little potential for capital appreciation.
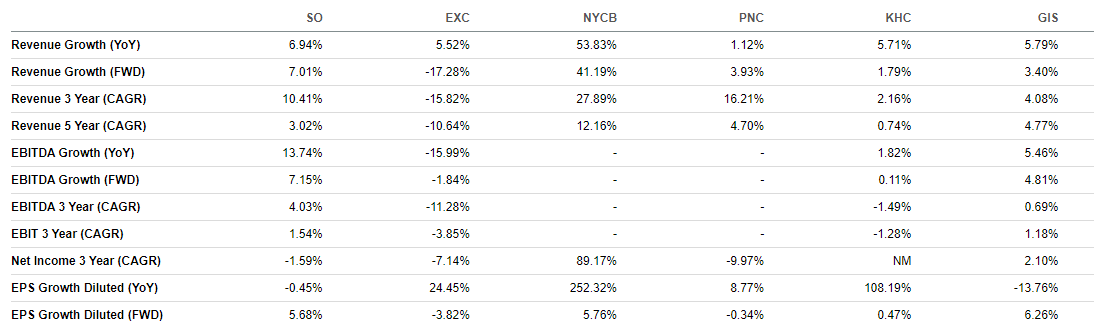
2. LVHD has a minimal 1.61% estimated earnings per share growth rate, a figure held back by investments in Electric Utilities, Packaged Foods & Meats, and Regional Banks. The table below highlights the top two representatives from these three sub-industries, which all have 6% or worse growth rates.
On a ten-point scale, LVHD's constituents earn a 3.42/10 Growth Score using individual Seeking Alpha Factor Grades. SPHD, SPLV, and USMV score 3.01/10, 4.51/10, and 4.16/10, so it's clear LVHD and SPHD are weak on this metric. With one-month treasuries yielding 5.60%, SPHD certainly isn't attractive, while LVHD's growth potential is only slightly better.
3. LVHD and SPHD each have weak profit scores of 8.22/10 and 8.11/10. The table highlights LVHD's most vulnerable areas are its top industries, suggesting that the most stable U.S. stocks are almost perpetual middle-of-the-road investments. Investors might turn to them because they're predictable, but getting the timing right on recessions is extremely challenging. If you're so confident a recession will occur in the near term, it's probably best to change your asset class allocations (i.e., stocks, bonds, alternatives, cash) rather than trying to find potential equity ETFs that will outperform.
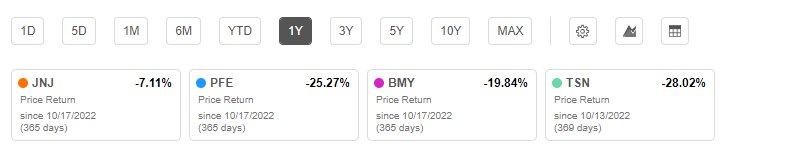
4. LVHD's 4.64/10 EPS Revision Score is a huge red flag, indicating Wall Street analysts are indirectly bearish on the ETF. The top industries have weak scores, but Pharmaceuticals, represented by Johnson & Johnson ( JNJ ) and Pfizer ( PFE ), have "F" Seeking Alpha EPS Revision Grades. Add Biotechnology giant Bristol-Myers Squibb ( BMY ) and Tyson Foods ( TSN ), the world's second-largest processor of chicken, beef, and pork, to that unfortunate group of "F" Graded companies LVHD holds. These four companies' share prices are down 20.06% on average YTD.
Investment Recommendation
LVHD is a better ETF than SPHD, but that doesn't mean it's a buy. I'm concerned about its constituents' low profit scores and weak earnings growth rates, indicating investors won't necessarily turn to these stocks in a recession or a recovery. Furthermore, LVHD's track record in drawdowns is mixed, and I suspect investors will turn to highly profitable stocks in the next drawdown rather than focus on historical realized volatility, which LVHD's Index emphasizes. In short, successfully combining the high dividend and low volatility factors is too challenging, so I've decided to maintain my neutral rating. I hope this analysis helped you determine which factors you want your portfolio to emphasize, and if you have any questions, I'd be happy to answer them in the comments section below. Thank you for reading.
For further details see:
LVHD: 4.34% Yielding Dividend ETF Designed For Defensive Investors