LVHD - LVHD: Lags Dismally During Recoveries A Pass Due To Numerous Disadvantages
2023-10-18 22:26:31 ET
Summary
- LVHD's strategy is based on the Franklin Low Volatility High Dividend Index.
- LVHD's appalling performance since the March 2022 article does not mean a buying opportunity has emerged.
- The problem is its strategy. It does deliver in a stormy environment (e.g., the 2022 bear market) but lags dismally during recoveries.
- The essential issues are its tepid performance, small growth factor exposure, unattractive yield, and mediocre dividend growth.
- On the positive side, valuation is adequate, and there is something to appreciate in terms of quality. However, this is not enough for a Buy rating.
It has been around one year and a half since I provided a review of the Franklin U.S. Low Volatility High Dividend Index ETF ( LVHD ), so I believe it is worth providing an update. Before we delve into the analysis, it is important to note that in June 2022, the fund was renamed; previously, it was known as the Legg Mason Low Volatility High Dividend ETF.
To recap, the major idea of the March 2022 article was that "LVHD is a suboptimal choice for dividend investors." In the said note, I concluded that
Market-beating performance is clearly not to be expected in the long term, with the low-volatility factor reducing its potential to outpace the S&P 500.
Since then, LVHD has been a gross disappointment as it substantially underperformed the S&P 500.
The screenshot taken on October 18, Eastern Time (Seeking Alpha)
One of the key principles of successful investing is that horrible performance frequently leads to an investment opportunity emerging. But this case is different, and I believe it is worth avoiding the ETF. The reasons will be reviewed shortly.
Strategy basics: aggregating low volatility, value, dividend, and quality factors
According to the fund's website, its strategy is based on the Franklin Low Volatility High Dividend Index. The factsheet describes the index as "composed of equity securities of U.S. companies with relatively high yield and low price and earnings volatility." The following summary of the methodology is provided:
The Index starts with the largest 3,000 U.S. stocks as determined by the Solactive U.S. Broad Market Index, an index calculated and published by Solactive AG composed of 3,000 U.S. large-cap, mid-cap and small-cap companies. Based on historical and projected data using Franklin Templeton Investment Solutions' proprietary methodology, the index screens for profitable companies that have the potential to pay relatively high sustainable dividend yields. Yields of the remaining securities are then scored higher or lower based on the attractiveness of their price and earnings volatility. The portfolio is constructed of the highest scoring securities subject to concentration limits: no individual component of the Index will exceed 2.5%, no individual sector (as defined by FTIS) will exceed 25%, and real estate investment trust (“REIT”) components as a whole will not exceed 15%. The number of component securities in the Index is anticipated to range from 50 to 100. The Underlying Index's components are reconstituted annually and rebalanced quarterly.
Performance: low volatility factor detracts from returns
Looking at the decline LVHD has experienced since the previous article, more meticulous investors would likely riposte that even though the fund did disappoint, focusing on returns alone is myopic as we are discussing a vehicle with a low volatility ingredient. And on that front, this Franklin ETF had clearly delivered, as its standard deviation was much lower compared to the iShares Core S&P 500 ETF ( IVV ) over the April 2022–September 2023 period. However, it was slightly more volatile compared to the iShares MSCI USA Min Vol Factor ETF ( USMV ), which I analyzed in April 2022.
| Portfolio |
| LVHD |
| IVV |
| USMV |
| Initial Balance |
| $10,000 |
| $10,000 |
| $10,000 |
| Final Balance |
| $8,971 |
| $9,701 |
| $9,581 |
| CAGR |
| -6.99% |
| -2.00% |
| -2.81% |
| Stdev |
| 16.87% |
| 20.69% |
| 14.71% |
| Best Year |
| -1.14% |
| 13.11% |
| 1.78% |
| Worst Year |
| -9.26% |
| -14.24% |
| -5.86% |
| Max. Drawdown |
| -13.10% |
| -20.28% |
| -14.10% |
| Sharpe Ratio |
| -0.56 |
| -0.18 |
| -0.37 |
| Sortino Ratio |
| -0.72 |
| -0.24 |
| -0.52 |
| Market Correlation |
| 0.82 |
| 1 |
| 0.92 |
Data from Portfolio Visualizer
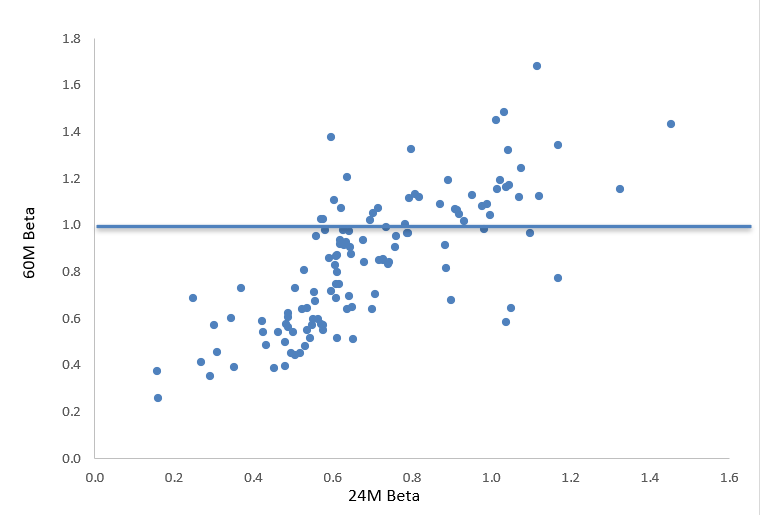
This is hardly surprising. Below is the chart with LVHD's current holdings' 24-month and 60-month beta coefficients; the exception is WK Kellogg ( KLG ), which has been spun off just recently .
Created using data from Seeking Alpha and the fund. Financial data as of October 16
As it can be seen, most holdings have that coefficient below 1 (more specifically, 85.4% have a 24-month beta below 1), with the weighted-average 24-month figure standing at just 0.65.
Next, they would likely add that LVHD was down by only 1.1% in 2022 (most likely thanks to the low beta), so for investors seeking a safe haven amid frenetic price swings in the equity universe, it is an option to seriously consider. But the problem here is its return in 2023. In the first nine months, it declined by 9.26%. Even USMV managed to eke out a gain of 1.78%.
Furthermore, longer-term returns are merely lackluster. To corroborate, the following table compares the total returns and other relevant metrics of LVHD, USMV, IVV, and the WisdomTree U.S. High Dividend Fund ETF ( DHS ) over the January 2016–September 2023 period.
| Portfolio |
| LVHD |
| IVV |
| USMV |
| DHS |
| Initial Balance |
| $10,000 |
| $10,000 |
| $10,000 |
| $10,000 |
| Final Balance |
| $17,435 |
| $24,165 |
| $20,025 |
| $17,555 |
| CAGR |
| 7.44% |
| 12.06% |
| 9.37% |
| 7.53% |
| Stdev |
| 14.19% |
| 15.96% |
| 12.94% |
| 15.24% |
| Best Year |
| 26.89% |
| 31.25% |
| 27.69% |
| 23.03% |
| Worst Year |
| -9.26% |
| -18.16% |
| -9.42% |
| -7.39% |
| Max. Drawdown |
| -24.32% |
| -23.93% |
| -19.06% |
| -25.89% |
| Sharpe Ratio |
| 0.47 |
| 0.7 |
| 0.65 |
| 0.46 |
| Sortino Ratio |
| 0.68 |
| 1.07 |
| 0.97 |
| 0.67 |
| Market Correlation |
| 0.85 |
| 1 |
| 0.9 |
| 0.84 |
Data from Portfolio Visualizer
Moreover, LVHD is one of the worst-performing dividend ETFs among those I cover, i.e., its 3-year total return is only 20.2% vs. the median in the group of 28.3%. The one-year price return is negative 2.8% vs. the median gain of 5.88%.
Growth characteristics are too weak
Another issue with LVHD is its soft growth characteristics. Certainly, investors seeking a more defensive mix with a bit of value most likely pay little attention to growth, if at all. Still, I believe these parameters deserve to be mentioned.
So, in a 126-strong portfolio, the weighted-average forward EPS growth rate is at 1.7%, while the revenue CAGR is at 5.1%, as per my estimates (data as of October 16). Even though I am not a growth-style maximalist, these rates are too small. The key reasons are that ~33% of the holdings are forecast to experience an EPS decline, while analysts are expecting a revenue contraction for around 14.3% of the portfolio.
Unsatisfying dividend growth
Did high yield-focused LVHD deliver on the dividend growth front? In fairness, dividends of its current holdings have been growing, but at a rather glacial pace. I would not say that the mid-single-digit rates are attractive.
| DY |
| 3Y Div CAGR |
| 3Y Div CAGR |
| 4.7% |
| 5.5% |
| 5.1% |
Calculated by the author using data from Seeking Alpha and the fund
The WA DY of 4.7% is overall fine, slightly below the 10-year Treasury yield ( US10Y ), thanks to the top contributors from the real estate sector like Office Properties Income Trust ( OPI ), Brandywine Realty Trust ( BDN ), etc. But the fund itself has a TTM yield of just 3.8%. And as we have seen from the total returns analysis above, the ETF's yield was unable to compensate for its lackluster price performance.
The silver lining: value and quality factors
One of the top stories of the first week of October was the jobs report that turned out hotter-than-expected and triggered the bond market sell-off, which, in turn, was reverberating through equities as well. Even though it was put on pause later, just recently, it has resumed , with the US10Y now teetering just a few bps below 5%. For equities, this means value and quality factors should still be favored over growth.
On these fronts, LVHD has mostly adequate characteristics. My analysis showed that for a portfolio heavy in large caps, the fund has a rather strong EY, principally thanks to a few financial companies like New York Community Bancorp ( NYCB ) and Eagle Bancorp ( EGBN ). At the same time, approximately a third of holdings have a B- Quant Valuation grade or higher, while 86% have at least a B- Profitability rating. Other relevant metrics are compiled below.
| Metric |
| LVHD |
| Market Cap |
| $67.54 billion |
| EY |
| 6.8% |
| ROE |
| 22.8% |
| ROA |
| 5.8% |
Calculated by the author; financial data as of October 16
However, I believe it is worth being selective; I would prefer a higher ROA and a stronger EY.
Investor takeaway
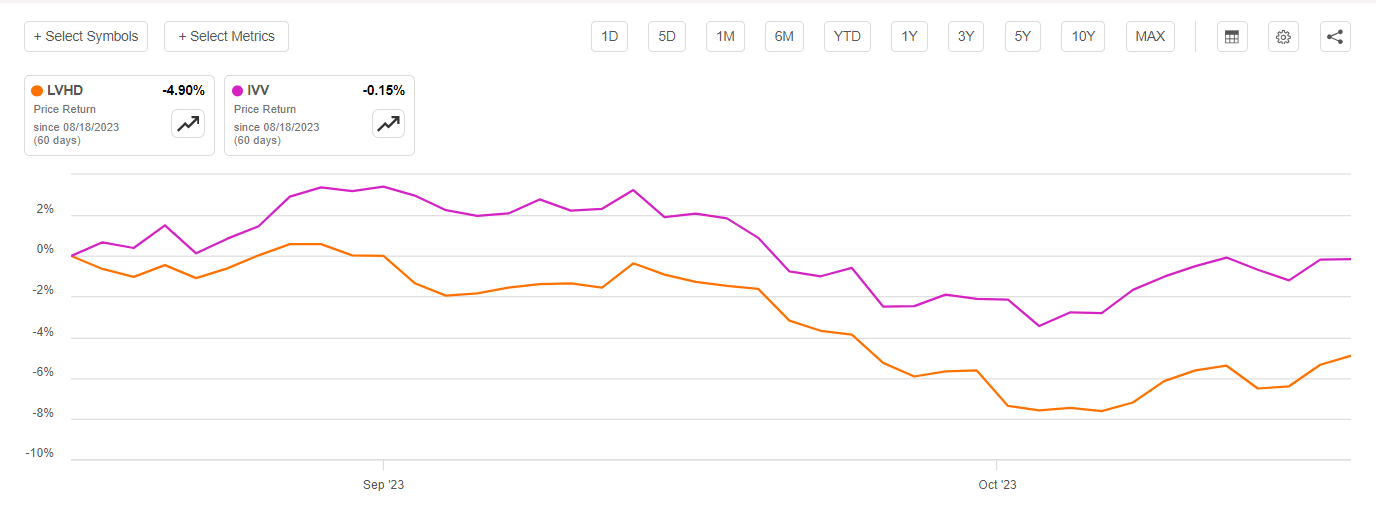
LVHD's appalling performance since the previous note does not mean a buying opportunity has emerged. The problem is its strategy. It does deliver in a stormy environment (e.g., the 2022 bear market). Nevertheless, it lags dismally during recoveries. Also, in the last two months, when the higher-for-longer narrative returned, it underperformed IVV by 4.75%, which again illustrates the limitations of its low-volatility approach.
Overall, the essential issues are its tepid performance, small growth factor exposure, unattractive yield, and mediocre dividend growth. On the positive side, valuation is adequate, and there is something to appreciate in terms of exposure to notable profitability and capital efficiency stories. However, this is not enough for a Buy rating.
For further details see:
LVHD: Lags Dismally During Recoveries, A Pass Due To Numerous Disadvantages