MHO - M/I Homes: No Margin Of Safety Even With Optimistic Scenarios
2023-07-31 15:53:10 ET
Summary
- M/I Homes Inc is a cyclical company with a 0.71 correlation between homes delivered and Housing Starts from 2005 to 2022.
- M/I's revenue grew at an 8% CAGR over the past 70 years, driven partly by growth in house prices.
- Valuation of M/I shows no margin of safety even under the most optimistic scenario, with concerns about poor financial position and low returns.
Investment thesis
From 2005 to 2022, there was a 0.71 correlation between the homes delivered by M/I Homes, Inc. ( MHO ) (M/I) and Housing Starts. Housing Starts are cyclical making M/I a cyclical company.
M/I revenue grew at 8 % CAGR during the last peak-to-peak Housing Starts cycle. About 1/3 of this was driven by growth in house prices. As such, I valued M/I as a cyclical company, but with a growth path capped at the US long-term GDP growth rate of 5%.
A valuation of M/I on such a basis with different gross profit margin assumptions showed that there is not enough margin of safety even under the most optimistic scenario. The other concerns with M/I were its poor financial position as well as low returns. Couple with the lack of margins of safety, this is not an investment opportunity.
Thrust of my analysis
In my article “ Home Builders' Base Rates: A Reference For Better Fundamental Analysis ”, I identified 9 listed home builders (panel). These are companies with available financial data from 2005 to 2022 – the latest peak-to-peak Housing Starts cycle.
I had previously determined the intrinsic values of D.R. Horton ( DHI ), Lennar ( LEN ), M.D.C ( MDC ), Meritage ( MTH ), NVR ( NVR ), PulteGroup ( PHM ), and Toll Brothers ( TOL ) based on their performance over the 2005 to 2022 cycle. Refer to the respective articles if you want the details.
I will analyze and value M/I using the same approach as those for the others. You can then compare them on an “apple-to-apple” basis. This is the eighth article in my series to determine the cyclical values of the top 9 homebuilders.
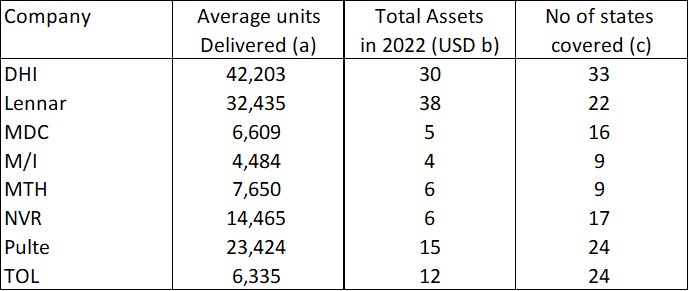
M/I is the smallest homebuilder covered so far in terms of the 2022 Total Assets as well as the average number of homes delivered or closed between 2005 and 2022. Refer to Table 1.
Table 1: Panel Profile (Author)
Notes to Table 1:
a) Average from 2005 to 2022.
b) Based on the 2022 Total Assets.
c) Number of states served in 2022.
Its home building operations spans only 9 states making it one of the 2 in the companies covered with the smallest geographical presence.
In 2022, M/I reported its performance based on 2 segments – homebuilding and financial services. The former is the largest contributor as the latter only contributed about 2% of the total revenue in 2022.
I thus developed a financial model that covered these 2 segments.
For the homebuilding segment, the key earnings driver was gross profits. This was derived from the equation, Gross Profits = Delivered units X Average Selling Price X Cyclical Gross Profit Margins. The Cyclical Gross Profit Margins were assumed to be the average 2005 to 2022 Gross Profit Margins (normalized margins).
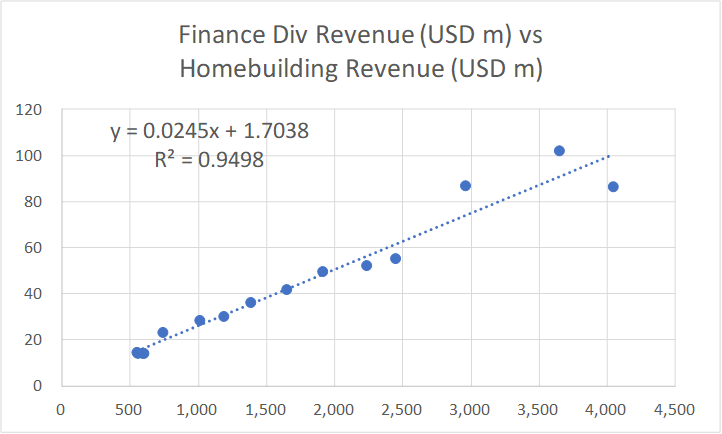
For the financial services segment, I modeled the revenue based on a linear regression equation that linked it with that of the homebuilding. This was derived using the EXCEL plotting function as illustrated in Chart 1.
Chart 1: Link between Finance Services Revenue and Homebuilding Revenue (Author)
Cyclical sector
From 2005 to 2022, there was a 0.64 correlation between M/I revenue and Housing Starts. I suspect that the low correlation was because the Housing Starts is a national statistic whereas M/I only operates in 9 states.
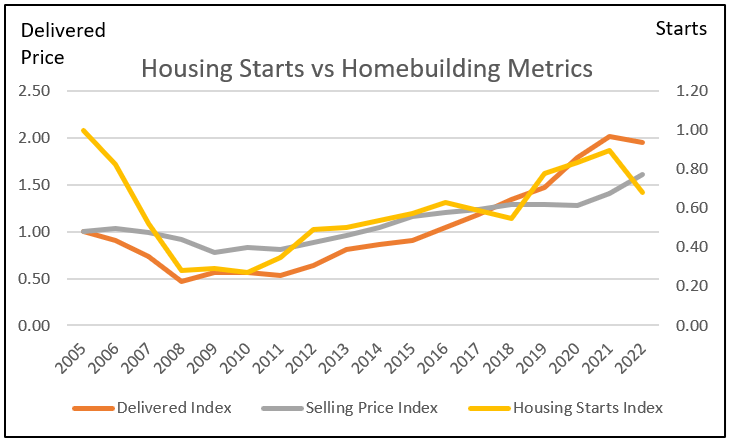
You may think that this is a low correlation - changes in Housing Starts only explained about 1/3 of the changes in revenue. But the revenue correlation was driven by a combination of volume growth (Delivered units) and increases in the average selling price. Refer to Chart 2.
Chart 2: Correlation between Homebuilding metrics and Housing Starts (Author)
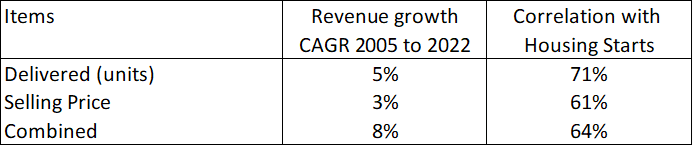
If you break down the correlation, you can see from Table 2 that there is a higher correlation between volume and Housing Starts. You should not be surprised as Housing Starts are measured in physical quantities. As such I would consider M/I a cyclical company.
Table 2: Trends and correlation of the homebuilding operating metrics (Author)
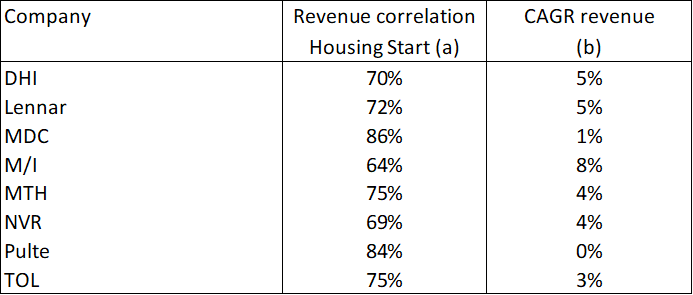
Among the panel companies, M/I had the lowest revenue correlation but the best revenue growth rate over the past 18 years. Refer to Table 3.
Table 3: Peer Revenue Growth Rate and Correlation between Revenue and Housing Starts (Author)
Notes to Table 3:
a) Correlation between revenue and Housing Starts from 2005 to 2022.
b) Revenue growth from 2005 to 2022.
I suspect that the best revenue growth rate resulted in the lowest correlation. This was because, over the past few years, a significant part of the revenue growth was due to price growth. Refer to Chart 3.
You can see that from 2016 to 2022, the House Price Index increased by 80%. But M/I did not fully tap into this as it only managed to achieve an increase in its average price of 33 % from 2016 to 2022.
Chart 3: House Price Index (Trading Economics.com)
In my previous articles of this series, I drew the following conclusions based on my analysis of the Housing Starts and House Price Index. Refer to them for the details.
- Over the past 70 years, there has been no growth in the long-term annual average Housing Starts. I took this long-term average as 1.5 million units per year.
- In the past 2 years, Housing Starts seemed to be at the long-term annual average level.
- Over the past 70 years, there have been 4 occasions when the annual Housing Starts had exceeded 2 million units.
- You can see from Chart 2 that Housing Starts starting to decline in 2022. Is the current drop in Housing Starts a temporary pullback from an uptrend? Or is it the start of its downtrend leg?
- While there is no growth in the annual average Housing Starts, there was long-term price growth.
I used these conclusions to determine the various parameters and assumptions for my valuation of M/I.
While nobody disputed the cyclical nature of the sector, we have different views on the long-term annual Housing Starts:
- I have assumed that there is no change to the long-term annual average Housing Starts. My basic argument is that 70 years of data cannot be wrong.
- There are many Seeking Alpha readers who believe that there is some fundamental change to this long-term annual average Housing Starts.
I do not have a crystal ball on how the future will unfold. As such I will value M/I under both views and let you decide what to do. I have already covered the pros and cons of these 2 views in the previous articles. Refer to them.
Performance
I look at 3 metrics to get an overview of the performance over the cycle – revenue, profit after tax (PAT), and gross profitability (gross profits/total assets).
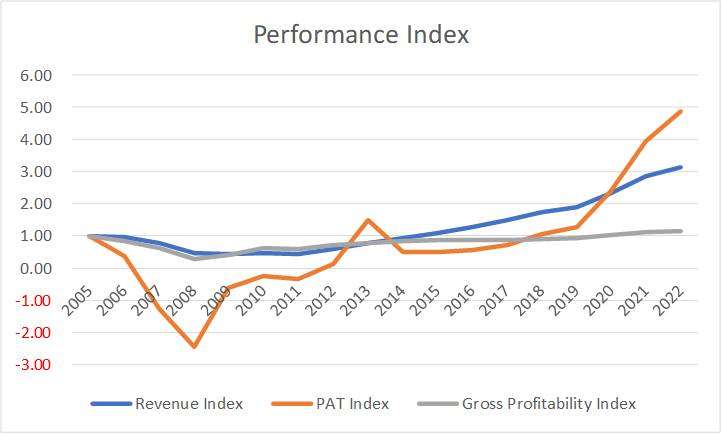
Chart 4: M/I Performance Index (Author)
Chart 4 shows the performance of M/I over the 2005 to 2022 cycle.
Over the 18 years cycle, M/I incurred losses for 5 years. These were due to asset write-offs during the trough part of the Housing Starts cycle.
To give you a sense of the scale, I compared the write-off incurred by M/I with the panel based on 2 metrics:
- 2007 to 2009 write-off as a % of the 2007 total assets.
- 2005 to 2022 average write-off as a % of the cycle EBIT.
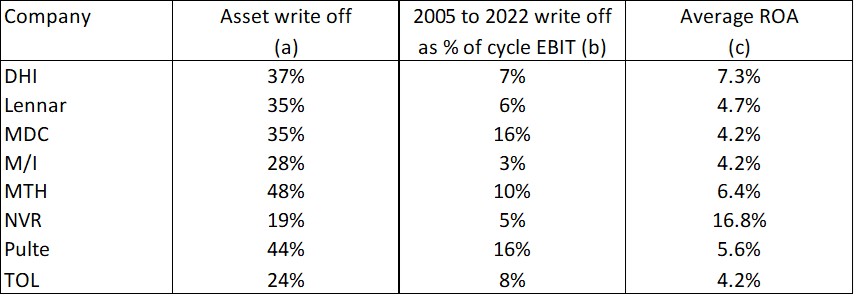
As can be seen from Table 4, M/I had one of the smallest % write-offs among the panel. Unfortunately, smallest % write-offs did not mean the best return as can be seen from the right-most column in Table 4.
Table 4: Peer Performance (Author)
Notes to Table 4:
a) These were the total 2007 to 2009 write-offs as a % of the respective 2007 total assets.
b) These were the average annual write-off from 2005 to 2022 as a % of the estimated cycle EBIT as per the valuation model, based on 1.5 m Housing Starts.
c) 2005 to 2022 average Return on Assets.
Because of the many years of losses, you should look at the earnings and returns over the cycle rather than the past few years of results.
In this context, the return as measured EBIT(1-t) / TCE averaged 6% over the past 18 years. Considering that the WACC is 8%, you can see that it is not an exciting performance. ( Refer to the Valuation Model section for the computation and discussion ).
In 2022, M/I was a much bigger company compared to that in 2005. Its 2022 revenue was 3 times bigger while its Net Income was almost 5 times larger. Unfortunately, its capital efficiency as measured by the gross profitability did not improve.
You can see from Chart 4 that for most of the past 18 years, the gross profitability was below the 2005 level. It only started to go above the 2005 level in 2020. I suspect that this was driven by price increases.
The growth in earnings and returns over the past few years was due to larger revenue and margins rather than improvements in asset utilization.
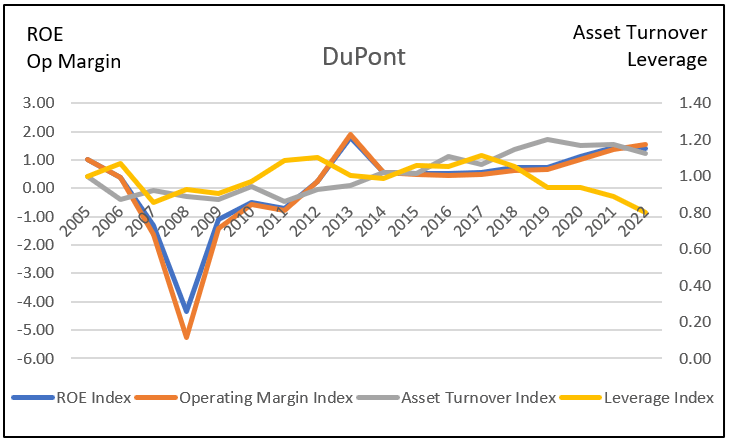
This is illustrated by the DuPont analysis in Chart 5. You can see that the ROE trend mirrors that of the Operating Margin. While M/I had improved its Asset Turnover, this was offset by the larger drop in Leverage.
Chart 5: DuPont Analysis (Author)
What does all this mean? When valuing M/I over the cycle, we have to:
- Account for some asset write-offs.
- We can ignore improvements in the margins as these were price driven.
- We should cap the growth to the long-term GDP growth rate.
- Be skeptical about any valuation incorporating growth given that the return is lower than the cost of funds.
Financial position
I would like cyclical companies to be financially sound going into the downtrend leg of a cycle as I do not know how severe the downtrend will be.
Overall, I would rate M/I's financial position as poor based on the following 4 criteria:
As of the end of Dec 2022, M/I had USD 311 million in cash. This is about 8 % of its total assets. This is in line with the ratios for D.R. Horton, Lennar, MTH, TOL Brothers, and PulteGroup which ranged from 7 % to 15 %. However, this is much lower than the 44 % for NVR and the 21 % for MDC.
It has a Debt Equity ratio of 0.48 at the end of Dec 2022. My base rate for the sector was a mean Debt Equity ratio of 0.41 for 2022.
Over the past 18 years, it generated an average of USD 11 million per year in Cash Flow from Operations compared to the average PAT of USD 78 million per year. This seemed to be a very low cash generation ratio. The mean Cash Flow from Operations over the same period for my base rate was USD 328 million compared to the mean PAT of USD 405 million.
Over the cycle, it managed to generate positive Cash Flow from Operations annually for 7 out of 18 years. It was the worst performer for this metric among the panel.
Valuation
I valued M/I based on the single-stage Free Cash Flow to the Firm (FCFF) model.
I focused on 3 Scenarios:
- Scenario 1. I assumed that 2021/22 represented the long-term annual average Housing Starts of 1.5 million units.
- Scenario 2. This assumed that the long-term annual average Housing Starts was increased to 2.0 million units.
- Scenario 3 – This assumed a non-cyclical scenario. I assumed that the 2021 and 2022 performances represented the long-term performance. As such I used the actual average 2021 and 2022 Gross Profit Margins.
Table 5 summarizes the results. There is a range for the values under Scenario 1 and 2 because I used 2 bases to estimate the annualized gross profit margins:
- The average of the annual gross profit margins from 2005 to 2022.
- The normalized gross profit margins = (sum of 2005 to 2022 gross profits) divided by the (sum of the 2005 to 2022 revenue).
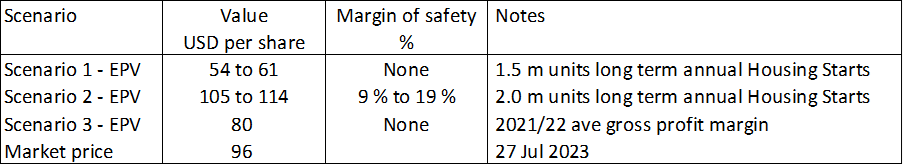
Table 5: Summary of M/I Valuation and Margins of Safety (Author)
You can see that there is no margin of safety under Scenarios 1 and 3. Note that I do not consider Scenario 3 as realistic since it assumed that M/I is not a cyclical company.
My target is for a 30% margin of safety. You can see that there is not enough margin of safety even under Scenario 2.
Overall, there is either no or not enough margin of safety under all the 3 Scenarios.
Valuation model
I valued M/I on the same basis as I did for the other homebuilders using the single-stage Free Cash Flow to the Firm (FCFF) model.
Value of the operating assets of the firm = FCFF X (1 + g) / (WACC – g)
Where:
FCFF = EBIT X (1 – t) X (1 – Reinvestment rate)
g = growth rate that is capped at 5% of the long-term US GDP growth rate.
t = tax rate based on the past 3 years' average rate.
WACC = weighted average cost of capital derived from the first page of a Google search for the term “M/I WACC” as summarized in Table 6.
Table 6: Estimating the WACC (Various)
The Reinvestment rate was derived from the fundamental growth equation
Growth = Reinvestment rate X Return
Return = EBIT(1-t) / Total Capital Employed
Total Capital Employed = Total Equity + Debt – Cash – Other Investments
EBIT = Gross profits – Selling, Admin, and Selling or SGA expenses – Other expenses and asset write-downs
Gross Profits
The Gross Profits for M/I were derived as shown in Table 7. The key assumption here is that the sector was operating at the long-term annual average Housing Starts in 2021/22. As such the average 2021/22 Delivered units and Average Selling Price represented the size that matched the long-term annual average Housing Starts.
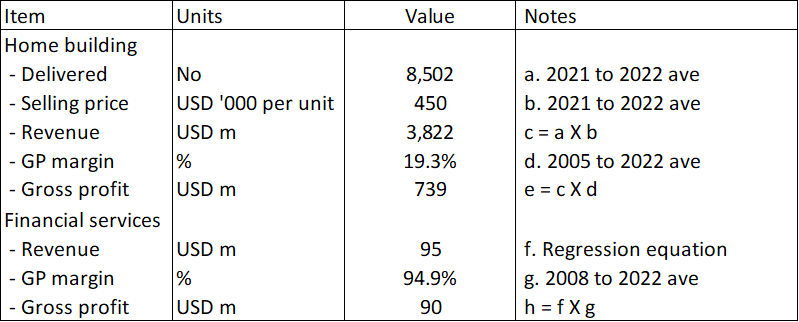
Table 7: Deriving the Gross Profits (Author)
The Gross Profits for the homebuilding operations = Delivered units X Average Selling Price X Gross Profit Margins.
The Gross Profits for the financial services operations = Revenue X Gross Profit Margins.
The cyclical Gross Profit Margin for the homebuilding operations was assumed to be 2005 to 2022 average values, while that for the financial services was based from 2008 to 2022.
The revenue for the financial services we derived based on the linear regression equation using EXCEL as shown earlier in Chart 1 where:
- Revenue for the homebuilding operations was the independent variable.
- Revenue for the financial services operations was the dependent variable.
Sample calculation
Table 8 shows a sample calculation for the intrinsic value.
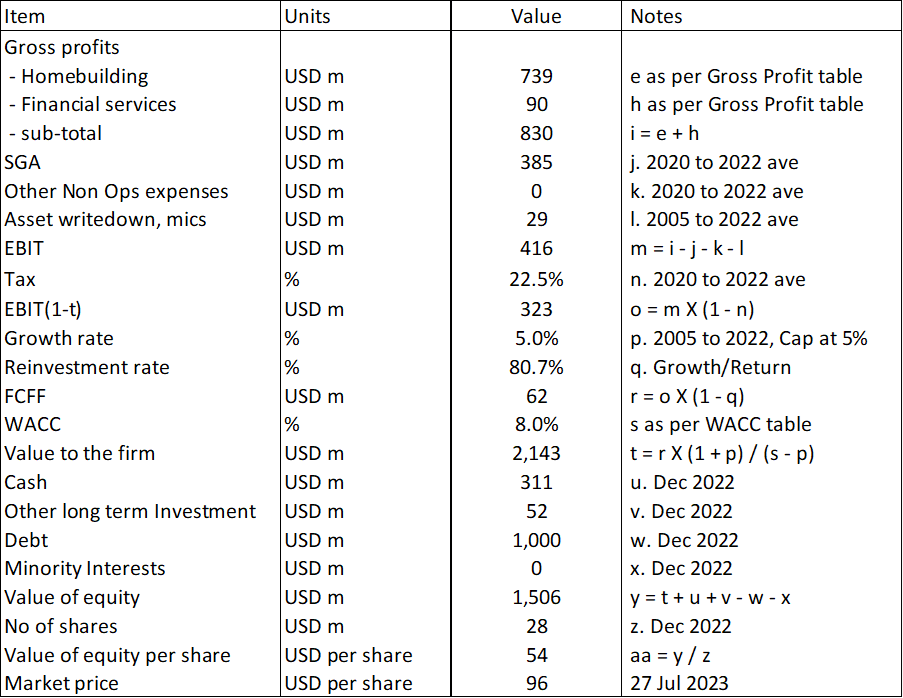
Table 8: Calculating the intrinsic value (Author)
Risks and limitations
I would summarize the risks and limitations of my valuation into 3:
- Small WACC sample.
- High growth.
- Reinvestment rates
- Small geographical spread
My WACC was derived based on a Google search. For the other 7 companies, I could get at least 3 different estimates of the WACC. In the case of M/I, I could only find 2. As such there is more uncertainty about the WACC.
M/I revenue grew at 8 % CAGR (Table 2) from 2005 to 2022. While I have capped its growth at 5% to correspond with the long-term GDP growth rate, this may not be appropriate. The 8 % comprised volume growth and price growth. If you accept that there is no growth in the long-term average Housing Starts, you should only consider the price growth component and used 3 %.
Growth needs to be funded and the metric for this is the Reinvestment rate = Reinvestment / EBIT(1-t).
I used the growth equation to estimate the Reinvestment rate.
Growth = Reinvestment rate X Return
Reinvestment = Growth / Return
Return = EBIT(1-t) / TCE
I computed the EBIT/TCE for each year from 2005 to 2022. I then multiplied the average EBIT/TCE by the 22.5 % tax rate as per item “n” in Table 8. This was my Return.
I then divided the 5 % growth rate by this Return to get a Reinvestment rate of 80.7 %.
This is a high Reinvestment rate. To check, I used another way to estimate the Reinvestment rate.
Reinvestment = Net CAPEX – Depreciation & Amortization + Net Acquisitions + Changes in Working Capital.
From 2005 to 2022, M/I incurred about USD 1.9 billion for Reinvestments.
During the same period, it generated 2.6 billion in EBIT. Assuming a 22 % tax rate as per item “n” in Table 8, we have a Reinvestment rate of 1.9 / (2.6 X 0.78) = 94 %.
Looking at this, 80.7 % did not look unreasonable. The reason for this high rate is that the Returns achieved by M/I were low.
Over the period from 2025 to 2022, the average EBIT/TCE was only 8%. After accounting for tax this would be about 6% which is lower than the WACC of 8%.
According to Damodaran, if the return is less than the cost of funds, growth will destroy value. As such you should not be surprised by the lack of a margin of safety.
Moral of the story? Do not be mesmerized by growth. The M/I growth rate does not appear sustainable from the Reinvestment angle. Secondly, about 1/3 of the growth was due to house price growth. I am not sure whether this is sustainable.
Finally, the trust of my analysis is that there is strong correlation between the company’s revenue and Housing Starts. M/I operate in only 9 states and looking at the correlation with the national Housing Starts may not show an accurate picture. A more realistic picture would be to use some weighted regional Housing Starts to identify the peak-to-peak period.
Conclusion
M/I is a cyclical company. Any analysis, and valuation of M/I should be based on its performance over the cycle.
I assumed that the cycle is represented by the 2005 to 2022 performance. This is pegging it to the latest peak-to-peak Housing Starts cycle.
My valuation of M/I on such a basis showed that there is no margin of safety under all the 3 Scenarios.
I would not invest in M/I from a margin of safety perspective. And I have yet to consider the poor financials and returns.
I am a long-term value investor and my analysis and valuation are based on the long-term prospect of a company. This is not an analysis for those seeking to make money over the next few weeks or month
For further details see:
M/I Homes: No Margin Of Safety Even With Optimistic Scenarios