M - Macy's: Positioned To Outperform Peers With Compelling Margin Of Safety
2023-05-18 10:12:19 ET
Summary
- The recent trends in Macy's financial performance have attracted a wave of sell ratings, downgrades, and overall investor pessimism.
- Macy's competitors do not seem to be better positioned to navigate potential 2023 headwinds. Yet, they trade at more than double the forward P/E of Macy's.
- Macy's started adjusting inventory earlier than their competitors, and management's guidance shows no company-specific risk to warrant a lower valuation multiple than its peer group.
- Using a range of FWD P/E multiples, Macy's shares could be undervalued by up to 120%.
Intro
Due to recession fears and industry-wide declining financial performance, Macy's ( M ) share price has fluctuated over the past year. In fact, investors have seen Macy's stock hit 52 week lows this past month.
When reading analysis from other analysts, many of them make the same argument: Macy's 4x P/E ratio is just too low. I for one agree. But rather than focusing on just Macy's, I take a look at two of Macy's competitors and where the market values them. After conducting my analysis, it is clear that Macy's shares are mispriced considering no significant company-specific risk and normal earnings guidance from management. The downside is limited and the potential upside indicates a sizeable margin of safety in my view.
Macy's Recent Performance
Those bearish on Macy's stock have cited a recent decline in net sales, comparable sales, and gross profit margin. To elaborate, Macy's 2022 results showed :
- Q4 gross margins at 34.1%, down 240bps from Q4 2021
- 2022 reported gross margin was 37.4% down from 38.9% in 2021
- 2022 net sales at $24.4B, down .1% and .8% from 2021 and 2019, respectively
- 2022 Digital sales as a % of revenue at 34%, down 6% from 2021 but up 31% since 2019
Looking at the decline across these significant financial metrics, I understand why some investors may be pessimistic. However, 2021 had an economy fueled by stimulus, pent-up demand, and low interest rates. On the other hand, 2022 saw historic inflation, high freight rates , and significant inventory build up . Therefore, Macy's recent financial performance seems on par with the performance of the economy. In fact, they seemed to remain much more profitable than their competitors despite the shaky economic environment.
Macy's and the Competition
In an attempt to try and find out where Macy's falls short of its competition, I compared various financial metrics from Macy's and 2 competitors:
| Company |
| Macy's |
| Nordstrom ( JWN ) |
| Kohl's ( KSS ) |
| Net Sales |
| $24.4B (up 0% y/y) 2023 guidance of low single-digit decline |
| $15.1B (up 5% y/y) 2023 guidance of 4% to 6% decline |
| $18.1B (down 6.7% y/y) 2023 guidance of 2% to 4% decline |
| Gross Margin |
| 37.4%(2022) 38.9% (2021) (-150 bps) |
| 33.6% (2022) 35.1% (2021) (-150 bps) |
| 33.2% (2022) 38.05% (2021) (-475 bps) |
| TTM Adjusted EBITDA Margin |
| $2.648B (10.8%) -280bps y/y |
| $1.034B (6.8%) -40bps y/y |
| $246M (1.4%) -729bps y/y |
| 2022 CFO & Capex |
| $1,615M ((CFO)) $888M (Capex) 2023 Capex guidance of approx. $1B |
| $946M ((CFO)) $473M (Capex) 2023 Capex guidance of $430M to $574M |
| $282M ((CFO)) $826M (Capex) 2023 Capex guidance of $600M to $650M |
| Digital Sales as % of Total Sales |
| 34% down from 40% in 2021 |
| 38% down from 42% in 2021 |
| 32% down from 39% in 2021 |
| LT Debt and Earliest Significant Maturity Dates |
| $3B in LT Debt ($105M due 2028) ($500M due 2029) ($425M due 2030) |
| $2.86B in LT Debt ($250M due April 2024) ($349M due 2027) ($300M due 2028) |
| $1.912B in Total Debt ($164M and $111M due 2023) ($113M and $353M due 2025) |
| TTM Dil. EPS and TTM P/E |
| $4.19 (FY22) 3.6 TTM P/E |
| $1.51 (FY22) 10x TTM P/E |
| -$0.15 (FY22) N/A |
| FWD Dil. EPS Estimate and FWD P/E |
| $3.75 (FY23) FWD P/E of ~4x |
| $1.89 estimate FWD P/E of ~8x |
| $2.32 FWD P/E of ~9x |
| Inventory Turnover |
| Down 3% y/y |
| Down 15% y/y |
| Up 4% y/y |
Analyzing the chart above, it seems clear that Macy's is not lagging behind their competitors. Macy's has wider gross and operating profit margins, further out maturity dates for their LT debt, and plans to increase capex. Yet, their FWD P/E is less than half that of their competitors. Nordstrom may have grew sales by 5% last year while Macy's sales growth remained flat, Nordstrom is projecting mid single-digit sales decline while Macy's is expecting low single digit sales decline. In terms of inventory, Nordstrom was late to the party as they waited until Q3 to adjust inventory to demand. On the other hand, Macy's started rightsizing their inventory in Q1. The result? See for yourself:
Gross profit as a percentage of net sales decreased 525 basis points, primarily due to higher markdowns as we prioritized rightsizing inventory to start fiscal 2023 in a healthier position. ( Nordstrom Q4 '22 Earnings Call )
End-of-year inventories declined 3% to 2021 and were down 18% to 2019. Looking back on 2022, we began to see signs of consumer weakness and a shift in category demand late in the first quarter. We adjusted the timing, amount and composition of receipts by channel, category and brand. (Macy's Q4 '22 Earnings Call )
Moving to the second value creation lever, gross margin. Our gross margin rate was 34.1%, down 240 basis points from the prior year and down 270 basis points versus 2019. (Macy's Q4 '22 Earnings Call)
Nordstrom may have ended the year with lower ending inventory y/y, but their Q4 gross margin decreased by 525 bps compared to just 240 bps for Macy's. Why? Because Macy's started adjusting inventory earlier, they were not forced to markdown as much inventory as Nordstrom.
I included Kohl's as a competitor to demonstrated that even though they seem to have the worst recent financial performance of the group and upcoming debt maturities, they still trade at a forward P/E multiple of 9x. It is worth noting that they have a 9% dividend yield compared to ~4% for Macy's and Nordstrom.
I ask the bears, are any of Macy's competitors better positioned? If not, then your pessimism must stem from the multi-line department industry as a whole. In which case, shouldn't Macy's be valued closer to its peers? Especially since they are in better financial shape to weather a shallow recession (based on further out debt maturities and larger profit margins).
Valuation
The FWD P/E ratio for Macy's has fluctuated between 4x and 6x this past year. As the chart indicates, Macy's current valuation is closer to the bottom of this range. However, I do not believe there have been any updates from management nor any significant macroeconomic headlines to warrant this valuation. Management has stated they expect a low single digit y/y decline in net sales, adjusted EBITDA margin between 10.3% and 10.8%, and Diluted EPS between $3.67 and $4.11. These expectations do not seem to warrant investor concern.
As YCharts could not display FWD P/E data before Jan '22, I decided to take a look at Macy's FWD P/E multiples for previous years.
Macy's Previous Forward PE Ratios (GuruFocus)
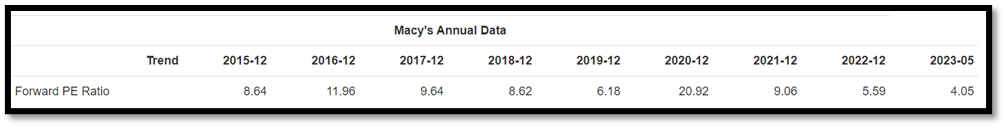
Although 6.5x was the upper range multiple for the past year, prior years show much higher multiples. While 2020 is an outlier, the next highest is 11.96x in 2016. However, this is a different economy and I do not see a FWD PE multiple higher than 8x to be realistic. Still, an 8x multiple makes sense as although Macy's is not a growth stock, it still has quality assets, sizeable profit margins, and pays a reasonable dividend. I conducted a scenario analysis for Macy's 2023 Dil. EPS and P/E multiples ranging from 4x (lowest multiple of the past year) and 8x:
Macy's ROI (based on EPS guidance and historic PE multiples) (Author)
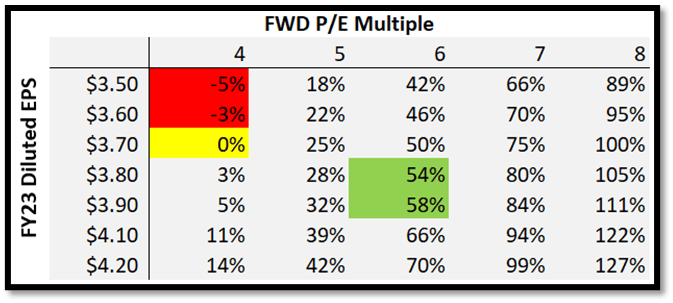
Assuming EPS falls in the middle of the guidance range and P/E multiple hits the upper limit of the 52 week range, the above analysis shows an upside between 54% and 58%. This is the fair value range I believe Macy's should fall between. Depending on your risk tolerance, you could have a higher, or lower, price target. However, arguably the most surprising takeaway is that if EPS falls slightly below the low-end of the guidance range, the downside is 5%; using the 4x FWD P/E multiple. This margin of safety is what makes the stock so appealing, in my opinion.
Risks
With slowing demand as interest rates rise, Macy's could end up mismanaging their inventory. In this event, profit margins would compress as Macy's has to resort to higher discounting and inventory write-offs. This would result in lower earnings and thus, a lower valuation.
Although the consensus is for a shallow recession starting in the 2nd half of 2023, it is possible that a negative catalyst could cause a deeper recession. This catalyst could stem from more regional bank failures or persistent inflation. This would mean less consumer spending which means more drastic declines in net sales for Macy's. This would also result in lower earnings and thus, a lower valuation.
Conclusion
After my analysis, I have no reason to believe that Macy's has enough company-specific risk to warrant a lower P/E than its peers. Macy's has survived the global financial crisis, pandemic lockdowns, and last year's historic inflation levels coupled with high freight costs and port congestion. A clothing brand may fall out of favor, but Macy's sells and replaces multiple in-demand brands. Their offerings range from discount retail to luxury products which shows their versatility with various income demographics. With a new management team eager and incentivized to create shareholder growth, I do not see any company-specific risk. In my opinion, the only rationale for a sell-rating is if an investor believes that the whole industry will experience pandemic-level demand caused by a deep recession or further e-commerce dominance. I do not believe this to be a probable scenario. Taking into account their recent stability and the margin of safety derived from my scenario analysis, I assign Macy's a strong buy rating.
For further details see:
Macy's: Positioned To Outperform Peers With Compelling Margin Of Safety