IYY - March CPI Report Takes Pressure Off Of Fed And Financial Markets
2023-04-12 10:31:34 ET
Summary
- We summarize key data and provide an in-depth analysis of the monthly Consumer Price Index report released by the U.S. Bureau of Labor Statistics.
- All-Items CPI came in lower than expected, while core CPI was slightly softer than expected.
- The report opens the door to a possible Fed "pause" after May if trends evinced in this report were to continue.
Summary Data and Analysis
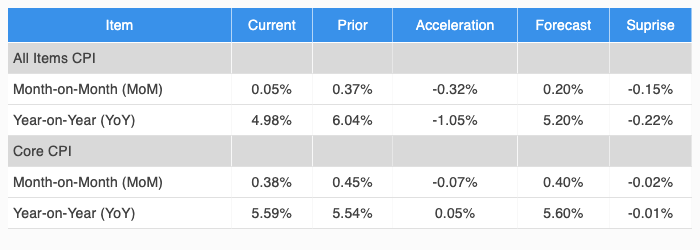
A summary of key data and analysis for this month's CPI report is provided in Figure 1.
Figure 1: Change, Acceleration, Expectations, and Surprise
All-Items CPI decelerated on an MoM basis and was softer than expected. Core CPI decelerated slightly from the prior month and was slightly softer than expectations.
Analysis of Core and Non-Core Plus Key Sub-Components
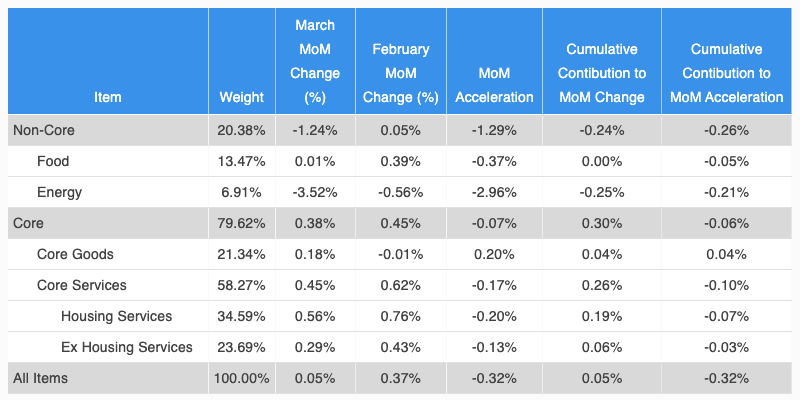
In Figure 2, we break down the analysis of change and acceleration of CPI into Non-Core and Core components. We further analyze two key subcomponents of non-core CPI and three key subcomponents of core CPI. Although all five columns in the table provide important information, we recommend that readers pay special attention to the rightmost column (Cumulative Contribution to Acceleration), as it reveals exactly what drove the MoM acceleration/deceleration in CPI during the current month compared to the prior month.
Figure 2: Analysis of Key Aggregate Components of CPI
As can be seen in the table above, Energy decelerated significantly, accounting for most of the overall deceleration in All Items CPI.
Core Services except Housing - the indicator the Fed is currently paying most attention to - deaccelerated significantly. This might just be the most important item in this report.
We now proceed to analyze the CPI report in greater depth. For more detailed information on how to read and interpret the tables and graphs in this article, please see the following Seeking Alpha blog post .
Contributions to Monthly Change in Core CPI
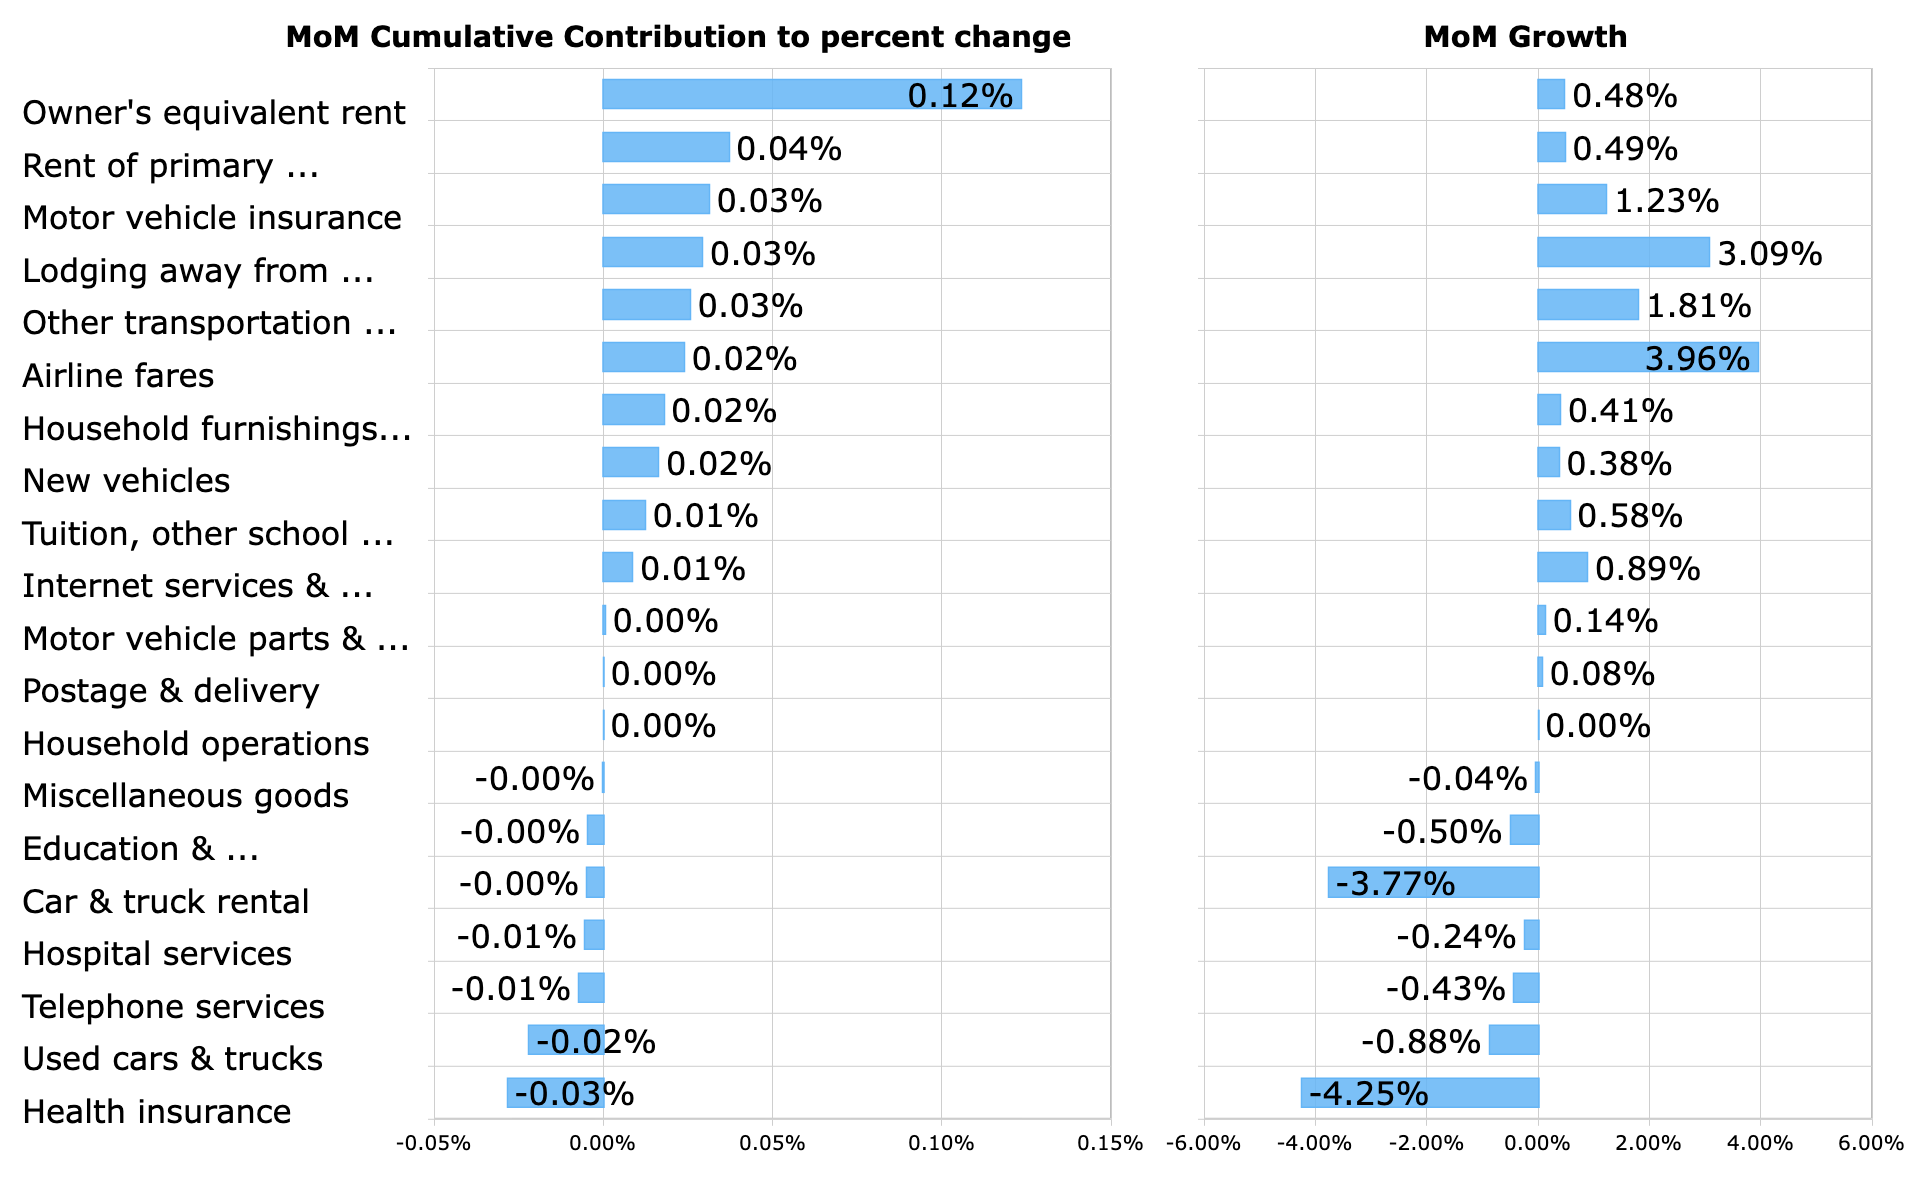
In Figure 3, we provide a bar chart that highlights the major positive and negative contributors to the MoM percent change in Core CPI. These contributions take into account both the magnitude of the MoM change in each component as well as the weight of each component in CPI.
Figure 3: Top Contributors to MoM Percent Change
Owner's Equivalent Rent and Rent of Primary Residence were the most important positive contributors to the monthly change in CPI.
The monthly change in CPI was dragged down by used car prices and health insurance. Both tend to be volatile components.
It should be noted that real-time indicators suggest that there will be significant disinflation in the housing components of CPI later this year.
Contributions to Monthly Acceleration in Core CPI
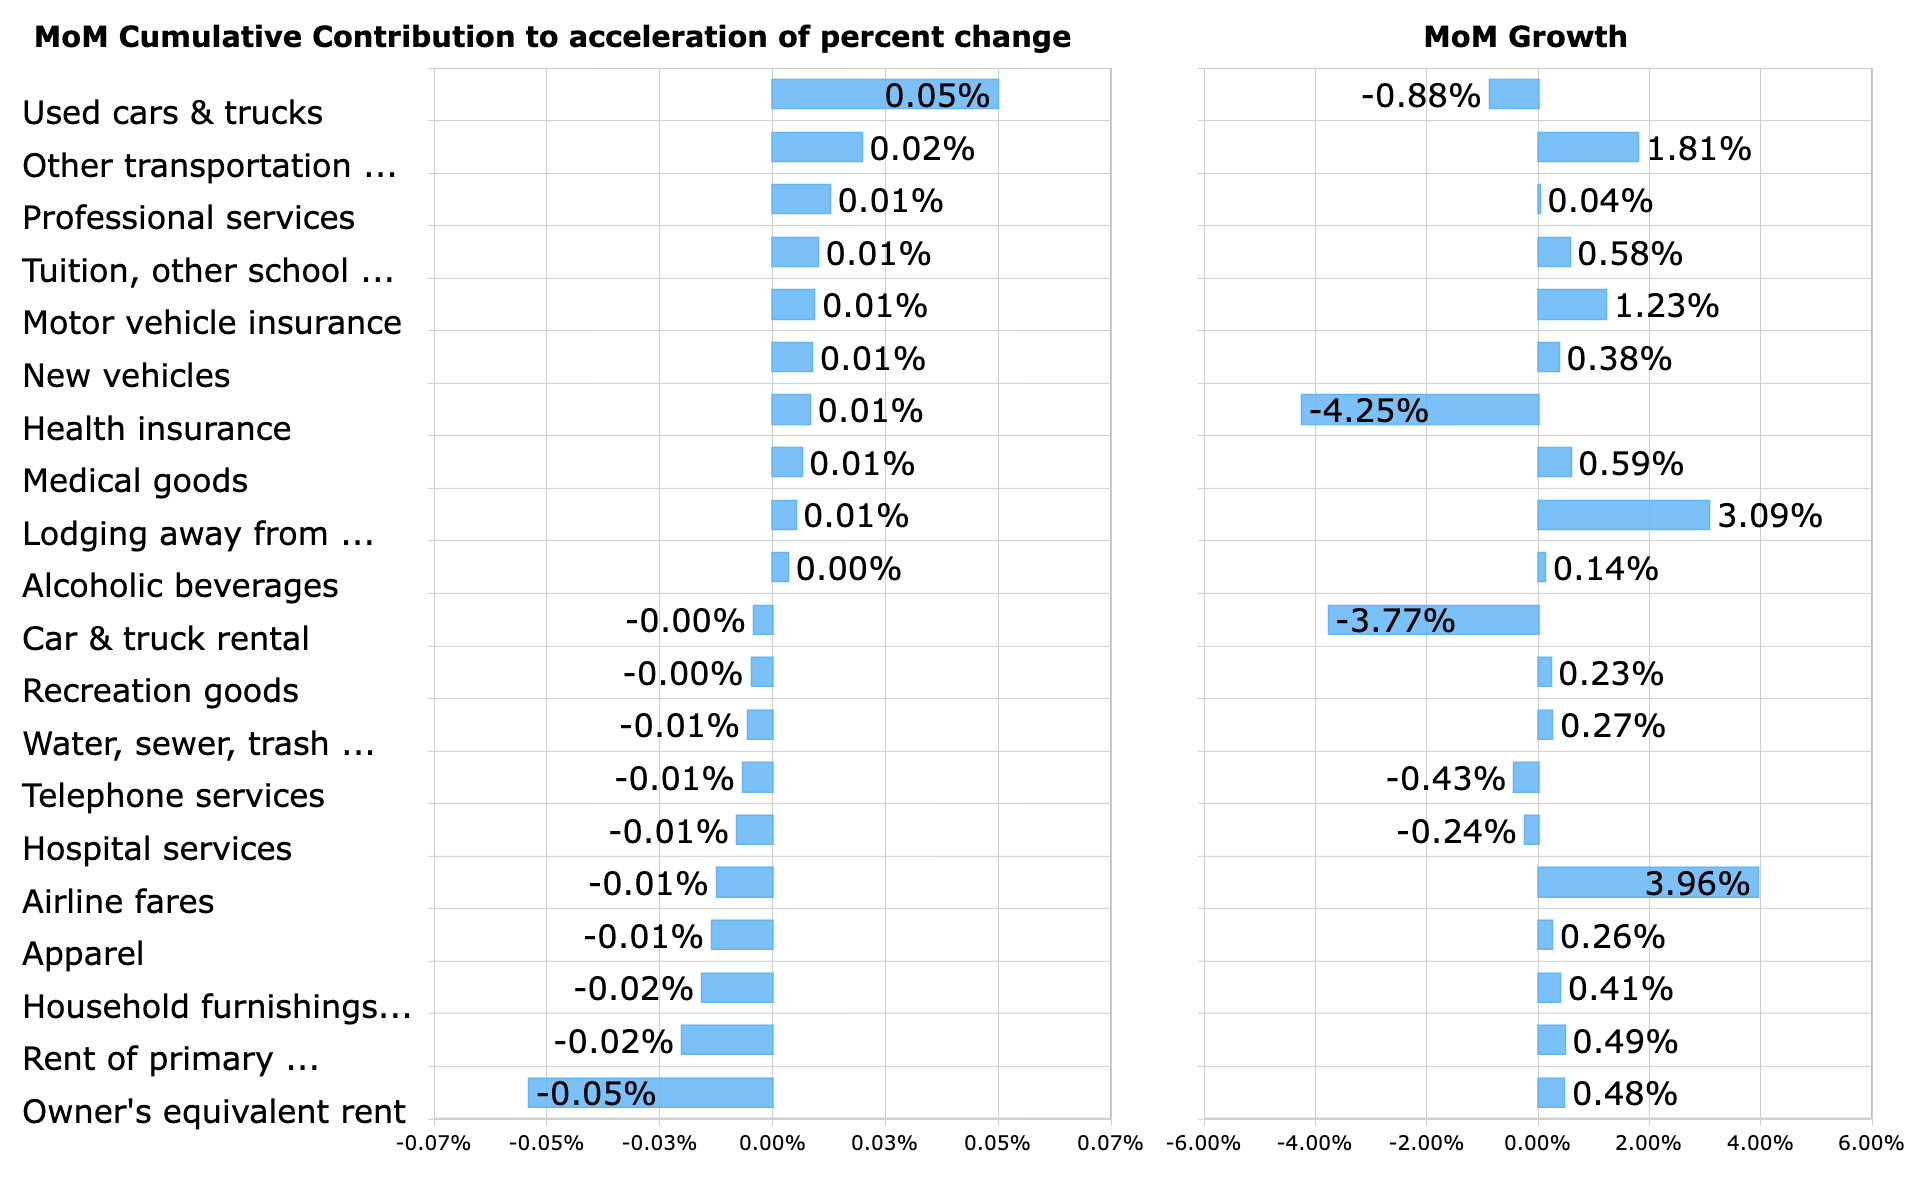
In Figure 4, we provide a bar chart that highlights the major positive and negative contributors to the MoM acceleration in Core CPI. These contributions take into account both the magnitude of the MoM accelerations in the components as well as the weight of each component in CPI.
Figure 4: Top Contributors to MoM Acceleration
It's worthwhile to examine this table carefully as it's likely to include most or all of the items that caused deviations from forecasters' expectations of Core CPI.
The most significant changes from last month to this month were the strong acceleration of used car prices (albeit still a negative contributor to Core CPI) and the strong deceleration of Owner's Equivalent Rent and Rent of Primary Residence (albeit still positive contributors to Core CPI).
Top Movers
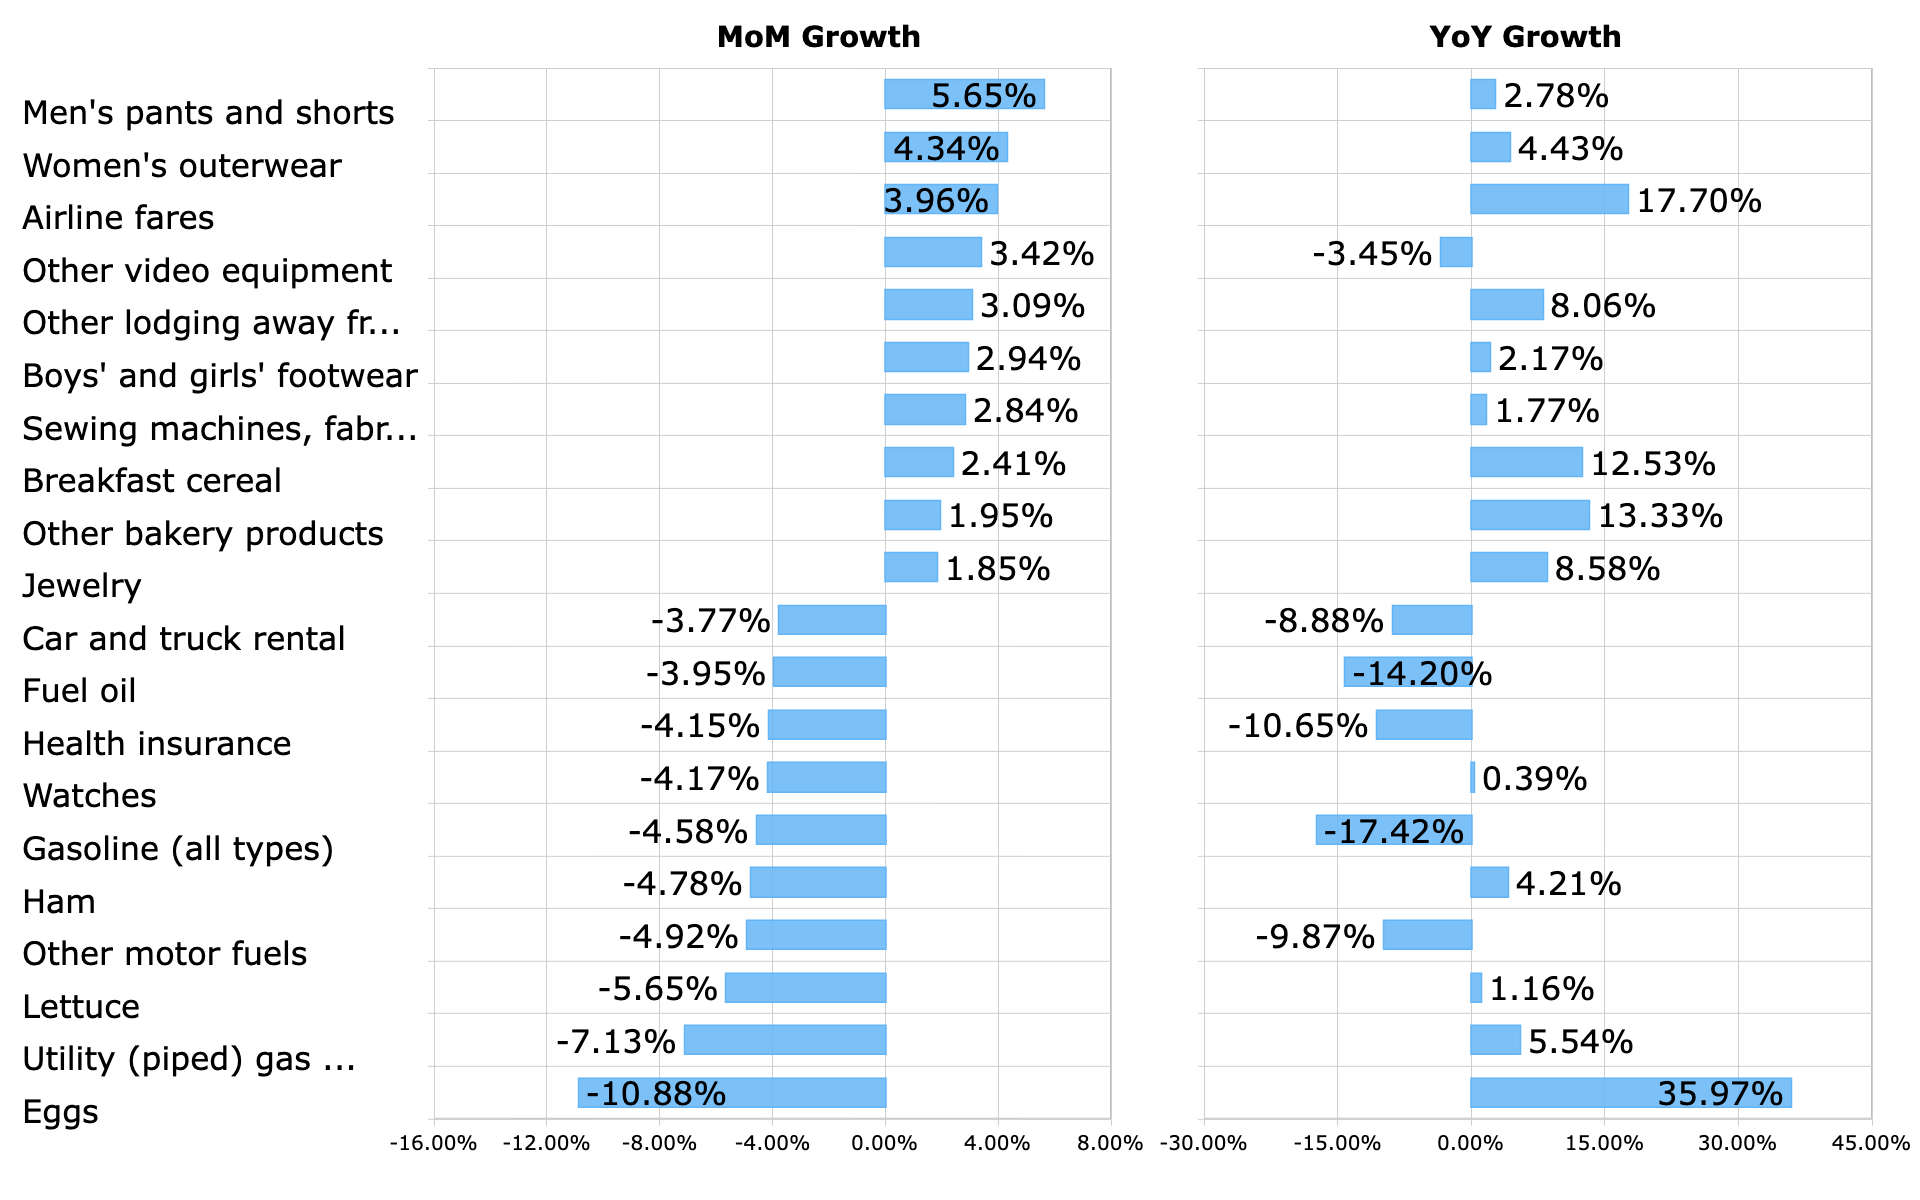
For general interest purposes, in Figure 5 we highlight the CPI components (most granular level) that exhibited the largest positive and negative change during the month. The YoY change in these particular components is displayed to the right.
Figure 5: Top Movers MoM Percent Change
Eggs are continuing the recent deflationary trend, after several months of significant inflationary pressure earlier this year. In March, Men's pants and shorts and Women's outerwear registered the largest price increases.
Implications for the Economic Outlook
The slightly soft numbers in the March CPI report will, on the margin, take some pressure off of the Fed, allowing them more leeway in terms of when they choose to pause rate hikes. Markets currently expect to hike the Fed Funds rate one more time in May and then pause.
From the Fed's perspective, the most encouraging number in this report was Core Services Ex Housing, which decelerated from 0.43% last month to 0.29% this month. If this trend were to be maintained, it would certainly enable the Fed to pause rate hikes after the May meeting.
If the Fed is able to pause hikes after the May meeting, it will remove considerable uncertainty from the economy and increase the possibility of a soft landing. However, if inflation in the next few months were to rebound, uncertainty would once again rise and upward pressure on interest rates would once again intensify.
The biggest risks to the inflation outlook, going forward, are upwards surprises in energy prices. Energy prices exerted strong downward pressure on overall CPI this month. However, energy prices may have troughed, and going forward, if energy prices rise from current levels, they could start to exert upward pressure on inflation, including core inflation.
Implications for Financial Markets
After publication of the March CPI report, US Treasury bond yields have reacted strongly to the downside, with the 2-Year Treasury yield down 12 basis points, to 3.93%. The S&P 500 futures have risen by approximately 0.50%. Fed Funds futures are pricing in a 69% probability of a 25 basis point rate hike in May, which is only slightly down from the 70% from yesterday.
Sentiment in US equities is on an upswing after extreme bearishness a few weeks ago. Positioning in the US equity market has been very bearish. Therefore, based on both of these factors, the path of resistance for US equities is currently higher. The relatively soft CPI report from March should enable the S&P 500 Index to test key multi-week resistance at around 4200. Indeed, with considerable uncertainty having been removed from the market due to the publication of the Employment and CPI reports, longer-term resistance at 4330 could even come into play in the next couple of weeks.
For further details see:
March CPI Report Takes Pressure Off Of Fed And Financial Markets