VTI - Market Chart Storm: VTI Poised For Gains Into Year End Soft Landing In Play
2023-11-05 02:25:24 ET
Summary
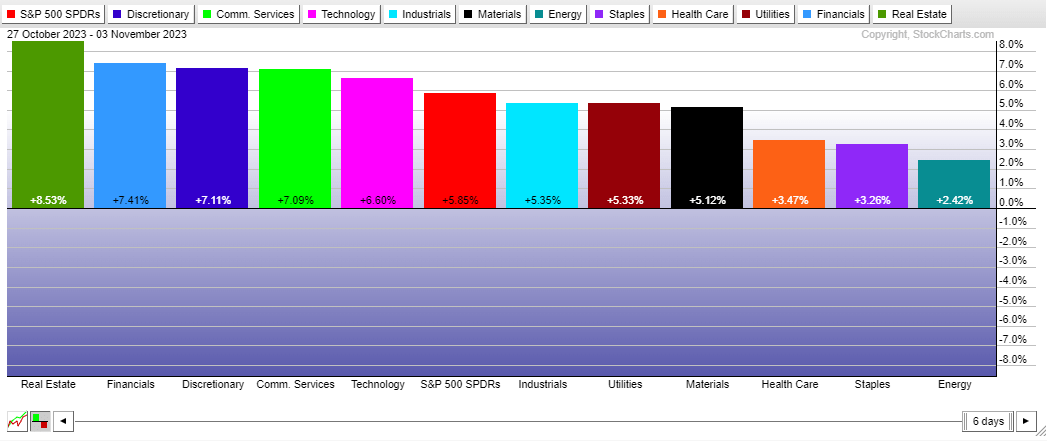
- Real Estate and Financials sectors led the US stock market to its best week in about a year.
- The market's valuation is not overly high, and seasonality favors the bulls.
- Q3 earnings have been strong, with positive year-on-year profit advancement for the first time since Q3 2022.
Stocks surged last week amid a bevy of generally favorable data points – at least for investors. A somewhat dovish Chair Jay Powell at last Wednesday’s FOMC press conference was music to the bulls’ ears while Friday’s jobs report , weaker than forecasts, helped send interest rates plummeting after they had already moved lower in the preceding sessions.
In all, it was the beaten-down Real Estate sector, along with embattled Financials-sector equities, which led the total US stock market to its best week in about a year, and nearly the best week since the volatility around COVID in March-April 2020.
I have a buy rating on the Vanguard Total Stock Market Index Fund ETF (VTI). I assert that the market’s valuation is not overly high today, even after the snapback rally, and seasonality favors the bulls. Moreover, a dovish Fed and SPX earnings inflecting higher on a year-over-year basis are tailwinds.
What's Bad Is Good Again? Real Estate, Financials Rise Most Last Week
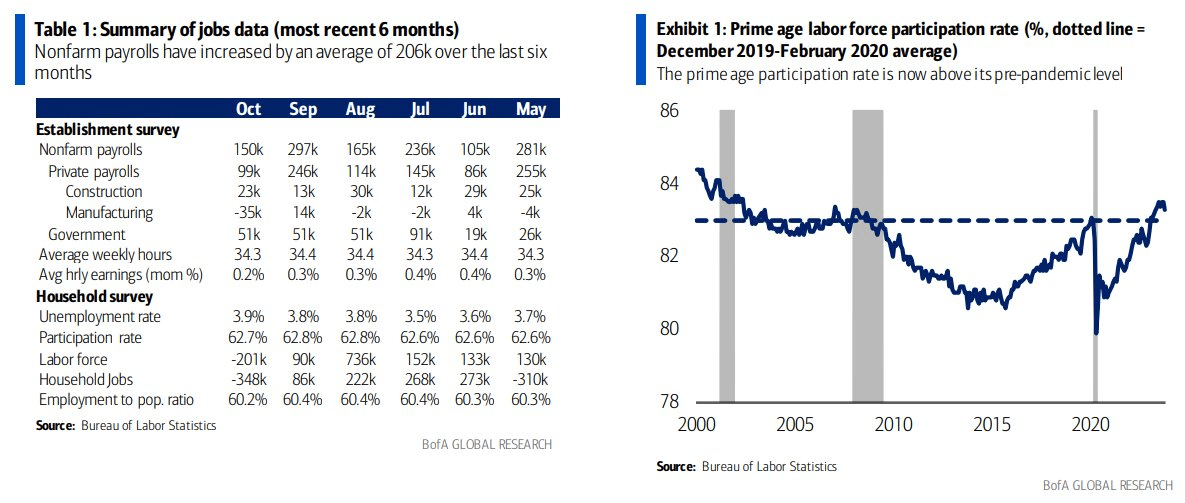
Starting off, the October jobs report was sanguine on so many fronts for those concerned about the Fed possibly hiking rates at the December meeting. That chance is virtually off the table, and there is a modest chance of an additional hike. In reality, the +150k employment gain might have secured the final rate hike being the one announced last July.
A Soft October Labor Market Report Sends Yields Cratering
Count 'em, 4 Rate Cuts Priced in For 2024
CME FedWatch Tool
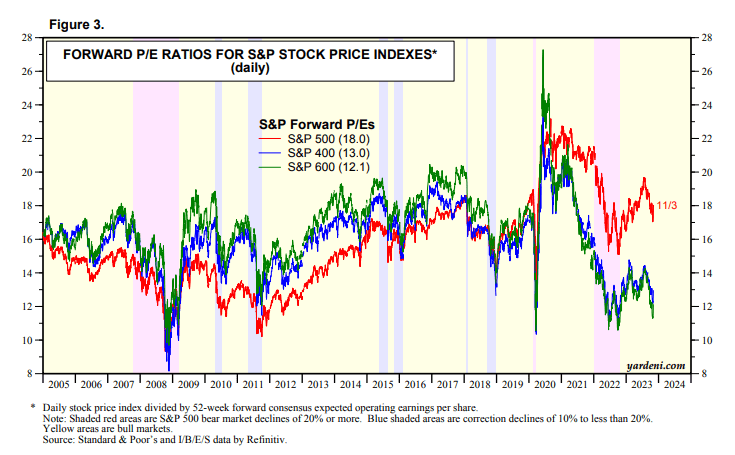
With more neutral monetary policy likely over the coming months and beyond, the US stock market’s valuation is not overly high. Consider that, according to Yardeni Research, US large caps trade at 18 times forward earnings estimates (forward 12-month EPS forecasts are now at all-time highs near $241) while domestic SMID caps, a space I recently turned more bullish on, sell for between 12 and 13 times per-share profit forecasts. Of course, large caps are a bit more insulated from economic downturns and that group features better earnings growth, so it makes their collective earnings multiple higher.
Broad Market P/E Ratios Not Flashing "Sell"
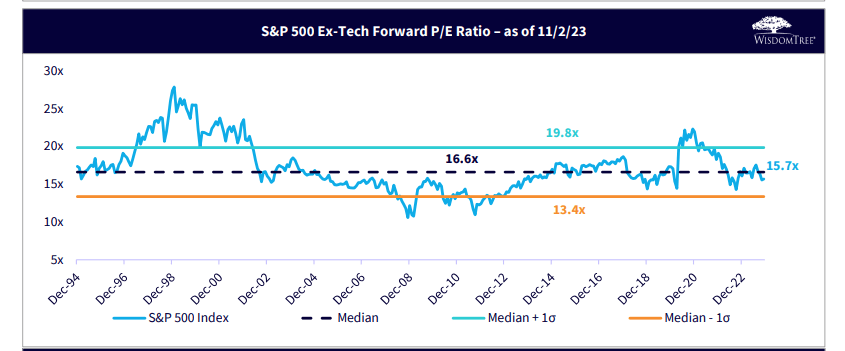
Speaking of earnings, if you back out the tech sector and firms related to the Information Technology space, the result is a P/E ratio right near the long-term average, if not a turn below it. This is a feature that actually benefits something like VTI since it houses stocks in the small and mid-cap areas which are generally less exposed to tech.
S&P 500 Ex-Tech Forward P/E Quite Reasonable
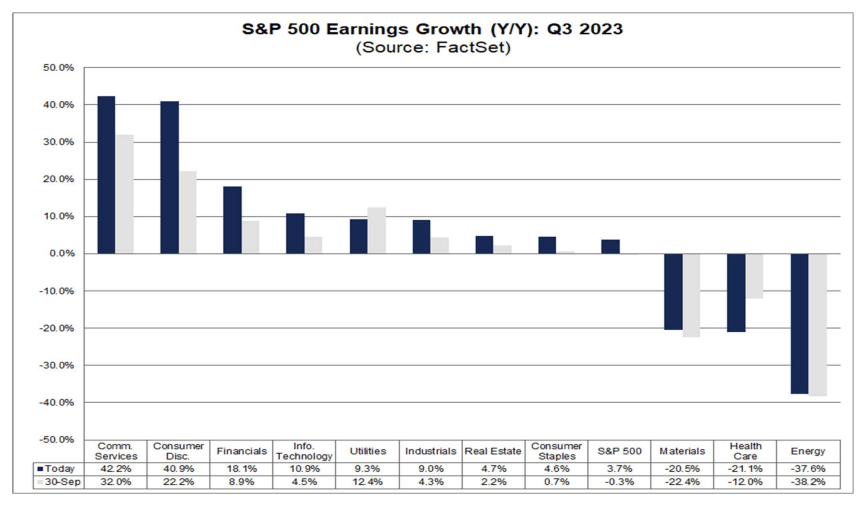
As for the recent earnings situation, the Q3 reporting period is tracking as the best beat rate in about two years, per FactSet. The 82% beat rate turned much higher in the last week, while aggregate earnings growth is now seen at +3.7% for the first positive year-on-year profit advancement since Q3 2022.
Q3 2023 SPX EPS Now Seen Positive YoY
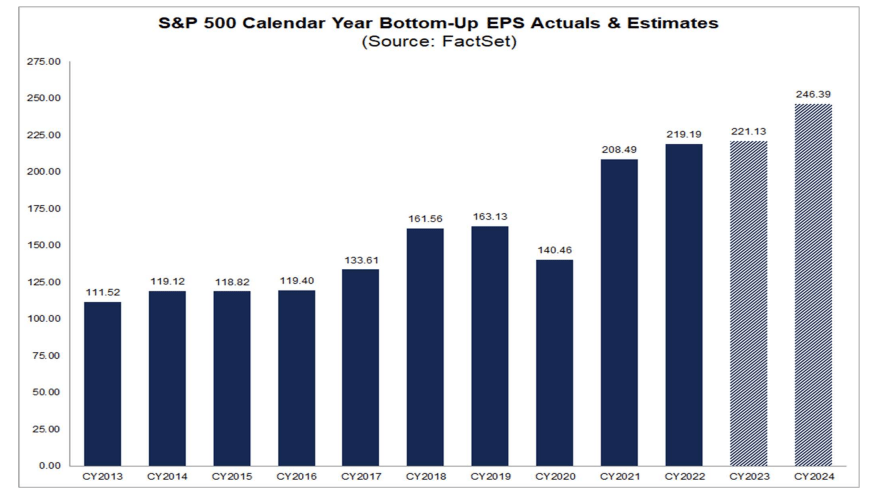
Looking ahead, analysts see $221 of full-year 2023 S&P 500 EPS with a substantial increase to $246 in the out year. I would be remiss not to mention that Q4 earnings forecasts have come down significantly, but since Q3 has been so strong relative to the consensus, FY 23 EPS expectations have actually ticked up lately while ‘24 EPS trends have been about steady since April.
SPX EPS Estimates Holding In There
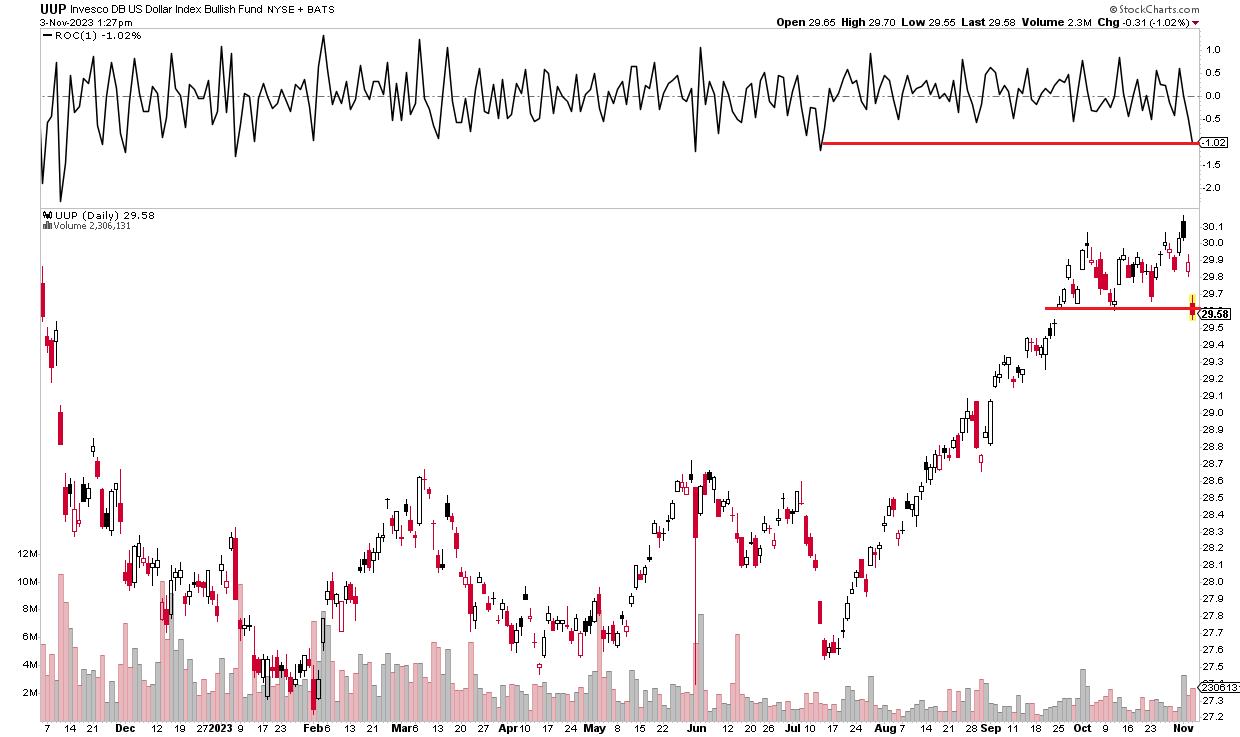
A key factor in determining how VTI performs in the next 12 months is the dollar. I track performance trends in the UUP dollar ETF. Notice in the chart below that the fund fell below important support as investors took a risk-on sentiment last Friday. It was the worst single session for the greenback dating back to July. The 4-month dollar rally was something to behold – the UUP ETF was higher in 13 of the 14 weeks, nearly completing a perfect Q3 in terms of weekly gains. Should that breach of support prove to be critical, then a late-year tailwind to stocks would likely be the result.
Dollar Violates Support, Bullish Implications for VTI
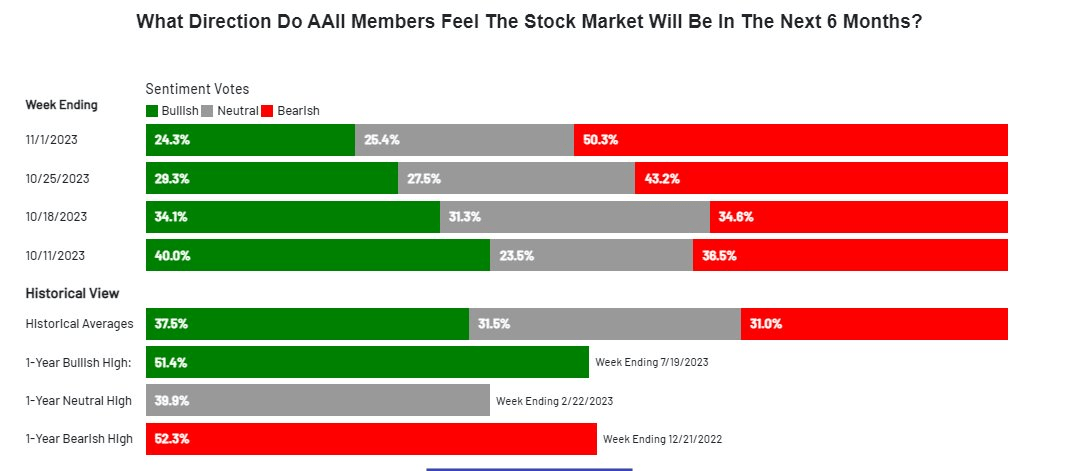
Finally, let’s assess investor positioning. The American Association of Individual Investors (AAII) revealed the fewest bulls and most bears in several weeks to start November. Furthermore, BofA's famed Bull & Bear indicator was flashing extreme pessimism, a key contrarian buy signal. Lastly, BofA’s weekly flow show put together by Michael Hartnett depicted investors’ collective cash position as being above average. These are classic signatures of a potential near-term bottom in markets, particularly when a Zweig Breadth Thrust takes place, which we saw last week.
Net Bears Percentage Jumps in October
BofA's Bull & Bear Indicator Suggests Extreme Pessimism
BofA Global Research
Client Cash Positions Peaking?
BofA Global Research
Digging into VTI, you’ll see that more than one-quarter of the ETF is in the Information Technology sector with Health Care being the second-largest sector weight. Interestingly, Apple (AAPL) and Microsoft (MSFT) are now nearly the same size – each more than 7% of the S&P 500 and about 6% of VIT. The Vanguard fund features strong momentum right now while its 0.03% annual expense ratio earns an A+ ETF Grade from Seeking Alpha. Its dividend is not anything to write home about, but payouts have generally been rising over time and are quite reliable. The Risk rating is also an A and liquidity is strong given the fund’s average daily volume of more than three million shares.
VTI: Holdings Information & Dividend Profile
Seeking Alpha
The Bottom Line
I have a buy rating on VTI. I assert that the broad market’s valuation is better today while last week’s “golden week” in which each day was positive amid bearish investor sentiment, sets the stage nicely for a year-end rally. With earnings season wrapping up, results have been much better than feared while forward 12-month EPS estimates have turned higher with the Fed possibly becoming the market’s friend over the quarters to come.
For further details see:
Market Chart Storm: VTI Poised For Gains Into Year End, Soft Landing In Play