ADT - Massif Capital Q2 2023 Letter To Investors
2023-07-14 11:15:00 ET
Summary
- Market forces blew us off course in Q2, resulting in a -1.68% loss (net of fees) for our Real Assets investment strategy.
- The sectors we invest in—particularly metals and mining—were out of favor.
- We’re confident that by continuing to improve the quality of our short exposure we can potentially offset some of this risk.
- We’re also confident that the idiosyncratic company variables in our portfolio will generate a positive return and provide ballast over the longer term.
Dear Friends and Investors,
The Massif Capital Real Assets strategy returned -1.68% net of fees in the second quarter of 2023, bringing our YTD net of fees return to -4.33%.
Attribution
During the second quarter, the long book was down 1.16%, and the short book was down 0.35%. Sectoral exposure results were as follows:
| Portfolio Contribution |
| QTD |
| YTD |
| Equity and Options Book |
| Energy |
| 0.80% |
| -0.25% |
| Industrials |
| 0.74% |
| 2.16% |
| Materials |
| -2.62% |
| -3.39% |
| Utilities |
| -0.41% |
| -1.76% |
| Other |
| -0.01% |
| -0.08% |
| Cash Management/Tail Risk Hedge & Currency Impact |
| Tail Risk |
| -0.28% |
| -1.29% |
| T-Bill |
| 0.31% |
| 1.01% |
| Currency |
| -0.06% |
| -0.08% |
On a gross basis, roughly 57% of our portfolio is in US equities; on a net basis, it is 9%. Compared to major US indices (S&P 500, NASDAQ, and Dow), our performance for the quarter was poor. On a gross basis, roughly 32% of our portfolio is in Canadian equities; on a net basis, it is 26%. Relative to the TSX, which returned 0.88% for the quarter, we trailed but not dramatically. The rest of the portfolio is split between European, Australian, and Singapore-listed equities. Results relative to those markets were mixed.
Given our low correlation to any of those equity markets, assessing our relative performance is of little value in assessing the portfolio’s positioning for the future. More relevant comparables, such as the S&P Global Natural Resources Total Return Index and the S&P Real Assets Equity Total Return Index, were down 3.6% and 0.04%. Although the S&P Global Natural Resources Total Return Index is the major index we correlate best with, that correlation is still only 0.45, and our correlation with the Real Assets Equity Index is 0.29, suggesting that even though they represent the relevant comparables, their performance is not particularly telling either. Nevertheless, the relative underperformance of equity markets and the underwhelming outperformance of the slightly more relevant comparables is a disappointment.
At the same time, we are pleased to report that from a factor perspective our yearly losses are driven by market and style factors. Idiosyncratic company variables continue to generate a positive return for the book, suggesting that while we are rowing into the wind, we are doing so with the best possible ship/ships we could find. Within factors, sector exposure has had a particularly painful impact on the portfolio’s performance, with overall metals and mining sector exposure and independent power producer exposure dragging on the portfolio’s YTD performance by 2.7% and QTD performance by 2.1%. Although there is no immediate and obvious solution to addressing our sectoral exposure issue, after all, the portfolio is built explicitly around investing in a concentrated way in a limited number of sectors; we continue to believe improving the quality of our short exposure will help. Additionally, when our current focused efforts at improving our short process conclude, we intend to examine more bespoke sector hedging strategies.
Portfolio Review
Utility Exposure (11.4% Gross, 11.4% Net)
Currently, the portfolio has roughly 11% allocated across two utilities, [[AES]] and Polaris Renewable Energy ( RAMPF ). In the case of both equities, we have experienced disappointing 2023 market results, and in the case of AES, it is the long-book’s worst performer YTD, dragging down the overall portfolio by -2.09%. Polaris contributed a positive return of 0.21%. These two positions represent investments in similar assets but very different businesses, which explains much of the divergence in this year’s results.
In the case of AES, we have a heavily US-focused utility with significant exposure to regulated and unregulated markets and a significant commitment to building out renewable energy. The firm also has some exposure to electricity markets in South America and exposure to electricity storage markets in the form of its ownership stake in Fluence (FLNC). Despite being one of the larger US utilities, the firm has trailed the sector (as measured by the IXUTR Index) dramatically this year.
The IXUTR Index is down 5% while AES is currently down roughly 27%. In some regards, one might assert this significant relative underperformance is a negative catch-up to the rest of the industry, having outperformed the Index last year by roughly 17%. The relative performance explanation is likely a reality but indicates more value-agnostic selling in the market than warranted. This explanation is supported, it would seem, when one breaks down the firm’s YTD performance in the context of a factor model, which indicates that factor exposure accounts for only 4% of the decline, with the rest explained by idiosyncratic companies’ factors.
From a portfolio management perspective, the questions thus become, “Are we holding a value trap and are there idiosyncratic reasons to justify this sell-off?” We think not.
At a very simple level, the value in AES versus the sector is clear. While the sector index traded at a P/E of 19.9x as of the end of the second quarter, roughly 21% above the industry quarterly average dating back to 6/2002, AES trades at a 28% discount to its quarter-end average P/E over the same period. Furthermore, when the stock peaked at approximately $29 in December 2022, it was trading at a P/E of 11x versus the index at 20x. Over the last 20 quarters, AES operating margins also outperformed the index’s operating margins by an average of 5.3% (and a median of 4.8%).
Digging deeper does not, in our minds, explain the relative underperformance in any more value-cognizant way. Admittedly, the global regulated and unregulated business of AES versus most traditional US peers carries with it political and currency risks. However, in our opinion, these are rather minor and offset by the non-recourse nature of the financial risks that occur at those entities. Furthermore, the firm’s 64-gigawatt project pipeline, of which 80% is US-based renewable and storage projects, which are all likely to benefit from tax-credit provisions of the inflation reduction act (IRA), is one of the largest in the industry. We cannot explain the aggressive move to the downside via company-specific factors.
The firm hosted its 2023 investor day during the second quarter, and the critical takeaway across most sell-side research we reviewed appears to be the revision of EPS CAGR over the 2023 to 2027 period from 7%–9% to 6%–8%. Admittedly a downside revision, but it comes after the stock had already fallen 22%. There is no question the market is a forward-looking, discounting mechanism, so perhaps the fall represents the expectations of the market of that revision, subsequently confirmed. In our opinion, that seems to ascribe too much precision to the market’s rationality or lack thereof.
The stock price move to the downside seems overdone. Were it simply to trade in line with peers, on a P/E basis, it would be priced between $27 and $28 per share. We maintain our positive outlook and expect the firm to be worth $30 to $35 per share in the fullness of time.
Unlike AES, Polaris, our other utility exposure, has generated a total return of 5.9% this year, driven entirely by its 8.5% gain in the second quarter. This great second-quarter move is explained primarily by the market’s reaction to the company’s strong first-quarter results. We suspect the move was powered by the year-over-year first-quarter revenue growth, which was 25%, and year-over-year net income growth of 88%.
The revenue growth is the first evidence that the firm’s long-term growth strategy is beginning to pay dividends. When we first invested in Polaris in 2019, we expected, based on discussions with management and assessing the opportunity set of small and mid-size electricity-generating assets in Latin America, that the growth potential for a platform aggregating such assets was robust. Covid threw a wrench into management’s timelines, but we remained patient and believe last year’s burst of activity represented a potential shift in a slow-moving train.
The revenue growth during the first quarter was driven by long-planned expansions of existing assets and growth via acquisitions made last year. The firm’s Nicaraguan Geothermal facility’s expansion started up in December and produced a 10% increase in MWh versus the same quarter last year. In addition, acquisitions of a Dominican solar facility and an Ecuadorian hydroelectric plant last year produced an additional 25,000 MWh of electricity, a 14% contribution relative to the first quarter of 2022.
Polaris continues to pay a dividend of roughly 5.5%, which has been stable since the fourth quarter of 2017. Additionally, the firm has several more capacity additions coming online in the next 24 months, totaling between 60 and 70 MW. This capacity expansion comes with offtake agreements that should increase firm EBITDA by 26%. Management also remains focused on its long-term goal of doubling EBITDA by 2028 to roughly $100 million. The goal is ambitious, but we are comforted by the fact that expansion of existing assets can get the firm 50% of the way to its goal. Currently, its stock is trading at just 4.7x the potential EBITDA arising from the organic EBITDA component of the growth plan.
We remain uncomfortable with Polaris’s interest costs, which have a weighted average of roughly 10% and an operating income coverage ratio of just 2x. At the same time, the debt is all at the project level and thus non-recourse to the company, providing some insulation in various worst-case scenarios. We would like to see Polaris suspend the dividend for a few years and accelerate the debt repayment. While our engagement with them has always been informative and productive, we have no expectation they will take our input on the matter.
Oil and Gas Exposure (11.3% Gross, 9.0% Net)
Our oil and gas exposure has been volatile in the last two years partly due to our skepticism about near-term weakness in the price formation. Admittedly, we don’t pick our investments based on commodity price catalysts, a statement we never tire of making nor believe can be repeated enough regarding the businesses on which we are focused. At the same time, we cannot ignore the reality of commodity price cyclicality. While individual investments should not be picked based on commodity price forecasts, position sizing is an area that one should be sensitive to commodity price cyclicality. The reasoning is quite simple, while commodity price action does not drive an investment thesis at the company level, it can drive aggregate liquidity flows into and out of sectors, resulting in portfolio volatility. The flow volatility represents both a risk and a return opportunity—a risk in that drawdowns on our “bold positions built on timid forecasts” can be nasty and an opportunity in that you can average down into individual positions on industry cycle drawdowns.
Oil Price vs. Qtr Massif E&P Exposure
Oil Price vs. Qtr Portfolio Level Return from E&P Exposure vs. Qtr Return of E&P Total Return Index
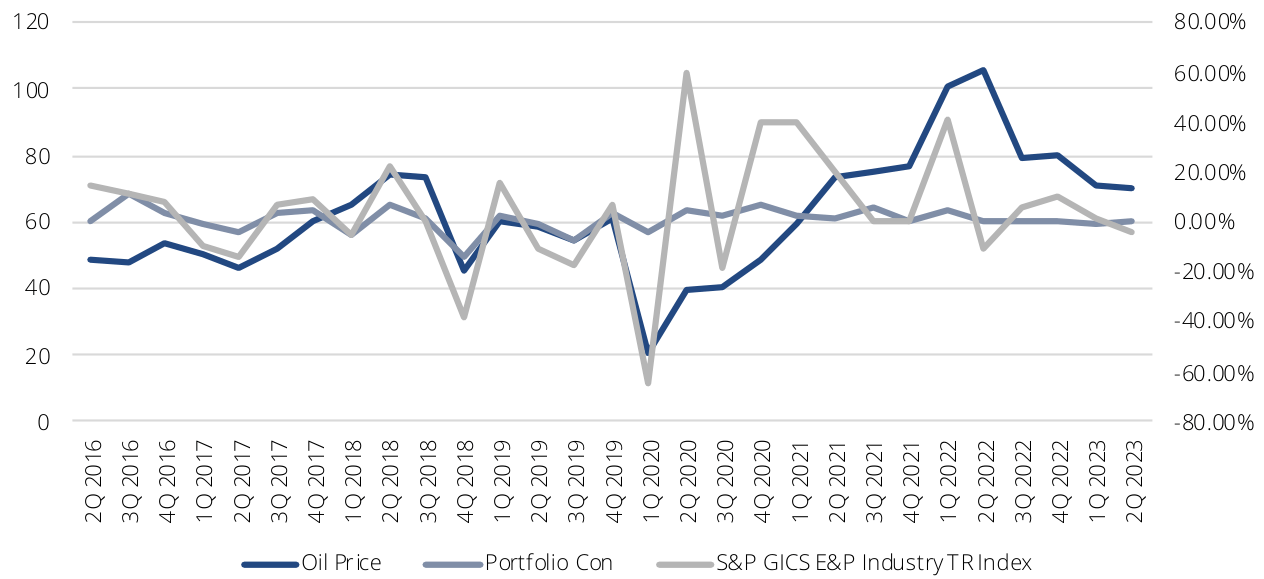
The caveat to all this is that timing the cycle and forecasting commodities is nearly impossible and was a variable we ignored in entirety from the firm’s founding in 2Q 2016 to 4Q 2018. Since then, we have tilted in favor of adjusting position sizing if we have a strong argument for weakness (or strength) in underlying commodities with a high explanatory value for a particular firm. We won’t shy away from adding positions, but we will size them differently to reflect our expectations about the market environment and, to reiterate again, the stocks are not picked because of expectations about the commodity price. This most often occurs in our oil and gas exposure, where our non-commodity price catalysts are not as strong as in mining and metals. Before the transition in our portfolio sizing approach, our cumulative E&P performance was positive but trailed the industry. Since our adjustments, the portfolio contribution from E&P has outperformed the industry (as measured by the S&P Oil and Gas Exploration & Production Select Industry Total Return Index) by a cumulative 22%. We have outperformed the Index by 8% cumulatively since inception.
The value we see in exposure adjustment of this kind is that it allows us to better match the “duration” of our investments with the ins and outs of long- and short-term commodity cycles. Admittedly, we are not literally duration matching, but by reducing exposure, we are functionally increasing our wherewithal to hold a high volatility position that is drawing down. This prevents us from being shaken out of a position we want to hold for company-specific reasons when non-company-specific-driven volatility moves the stock. This can go wrong, and we can ramp up or ramp down exposure into trends that hurt us, but with cyclical stocks, it seems like a damned-if-you-do and damned-if-you-don’t situation. In which case, we would rather make errors of commission than errors of omission. After all, we are paid to be active managers and errors of commission we can at least take responsibility for.
Regarding our ramp up and ramp down in the last two years, it is not a function of long-term skepticism about the very bullish long-term picture for oil and natural gas, which remains the world’s most critical energy resource, and in our opinion, the energy resource most important to achieving a transition to a low-carbon economy. That position often confuses people, but we think it is a very practical and realistic position to take. The reason for this is that, fundamentally, a transition to a low-carbon economy requires two things:
- A truly massive investment in well-understood renewable assets that fall well short of addressing societal energy needs if society desires to maintain its quality of life in the developed world and support a continuous improvement of quality of life in the developing world.
- A near-equal investment in R&D and commercialization of new low-carbon energy, materials, and industrial processes and products to replace the high-carbon emitting energy, materials, and industrial processes and products the world currently relies upon.
Ramping up both simultaneously requires a highly productive and growing economy that currently runs on hydrocarbons. Environmental and economic sustainability are two sides of the same coin; you cannot achieve one without the other. Climate change remains primarily a question of pollution reduction (after all, CO2 is a pollutant), an uncontroversial goal we believe most people should be able to get behind if presented correctly and solved practically. That means we need to invest in the current system in order to build a better future system. We can accomplish the lofty goal of a pollution-free economy by taking it one step at a time and confronting problems one at a time, not by focusing on the U.N.’s aggressive net zero by 2050 goal and attempting to revamp life on Earth as we know it on unrealistic timelines.
When the time comes that the global economy can operate without carbon pollution, we would be surprised to find anyone still burning hydrocarbon fuels and also surprised to find the world’s population not ready and unwilling to transition. Society is currently ramping down investment in critical oil and natural gas assets at a pace at odds with society’s ability to ramp up alternatives that address energy needs.
A challenge for investors is that oil does not trade on supply and demand in the short run, but rather, like a stock on a mix of narrative, sentiment, and fundamental variables. The fundamentals that we do have are all backward-looking, providing us with information about what has already happened, not necessarily what will happen in the future. Furthermore, perhaps more so than any other commodity, the paper market for oil is many times the size of the physical market, meaning the opportunity for non-fundamental-driven speculation to drive the market is probable.
According to our math, the average daily trading volume of major futures contracts for oil and several critical oil products is 25.8x the world demand on US markets alone. In the short run, the opportunity for the tail to wag the dog is significant. With the constant drumbeat of recession over the last few quarters ringing in our ears, we took our oil and gas exposure down to just 3% at the end of the second quarter of 2022. Since the beginning of this year, we have started to ramp it back up based on the value we have seen in different opportunities, particularly in our Norwegian continental shelf exposure via EQNR and VAR and in the political risk-created opportunity we have highlighted in a recent discussion of Ecopetrol.
Based on our research, the oil and gas exposure of 10.5% will likely yield more than 10% on dividends alone this year. VAR is a new position added to the portfolio this quarter.
However, we did not include a review of the company in this letter as we will be publishing a research report on VAR shortly.
Metals and Mining (36.3% Gross, 23.6% Net)
We exited one mining position this quarter and initiated positions in two copper-focused juniors, one diversified miner, and one junior gold miner. We also added two metal shorts to the portfolio. To learn the names of our new positions, investors should consult our portfolio update of last month, as they are not discussed in this letter due to the fact that we are still building our positions in these stocks.
Overall, the metals and mining sector has had a challenging year. The iShares MSCI Global Metals and Mining Producers ETF (PICK) is down 4.1% YTD; copper prices have been a roller coaster but finished the second quarter down 2.7% YTD gold is up 4.7% YTD but down 6.3% from its May peak; and the Bloomberg Industrial Metals Spot Index is down 12.8% YTD. Within this context, our metal and mining exposure is down just eight bps YTD (although down 1.54% in the second quarter). In general, we are pleased with this relative performance, even if the absolute performance is uninspiring.
Despite the lackluster performance of metals in the first half of 2023 and commodities in general, the scarcity in the commodity ecosystem continues to look to us like the new normal. There remains a cross-border flow of people, goods, and capital subject to increased friction arising from shifts in domestic political perspectives about globalization in most of the world’s large economies. We are hesitant to call this deglobalization, as we do not believe it represents what is happening and the often-heard friend-shoring and regionalization also do not capture the exact changing nature of changing global trade. Bob Robotti of Robotti & Company Advisors, in a recent conversation with Harris Kuppermen, referred to the changing nature of trade as Globalization 2.0. It seems a good descriptor of what we envision: a reworking of trade flows and supply chains, which will leave some of the world’s trade unaffected and other parts unrecognizable.
The combination of the US/China conflict, the Covid pandemic, and the Russian invasion of Ukraine has shattered a long spell Exterior Line of global integration that has yielded low-cost supply chains. In our minds, the result will be a corporate transition from cheap and easy to dependable supply chains. This transition will manifest itself as reduced global trade. Furthermore, politically motivated efforts to capitalize on comparative advantages will incentivize economic activity focused on creating interior supply, logistics, and value chains, to borrow a term from military strategy. 1 In many regards, this trend has been underway, unguided by the state’s visible hand for several years, but not very much subject to it. The trend is evidenced by the fact that, in 2008, global exports represented 31.2% of global GDP and, as of 2020, global exports represented only 26.4% of GDP. The states visible hand is starting to play a much more significant role, and we believe will continue to do so going forward.
The interior line is not a perfect analogy, but it is interesting. Within military parlance, it describes a strategy based on the idea that lines of movement and communication within an enclosed area are shorter and safer than those on the outside. The increased relative efficiency of this strategy might be said to reduce the material cost of fighting, thus enabling a numerically inferior force to gain an advantage over a numerically superior force. This is accomplished by allowing a more nimble and concentrated use of resources at points where an opposing force cannot respond as quickly due to the less efficient exterior lines.
Although, at a very high geostrategic/geoeconomic level, this would seem to hold once an economy is physically and legally structured around interior lines, an economy switching from a global supply chain strategy to one based on interior value chains within friendly nations with selective use of value chains with outside nations will have an upfront infrastructure cost that will be expensive and reduce economic efficiency for an indeterminate period.
The upfront cost of this transition and the ongoing frictions created by the geopolitical fallout of more self-interested nation-state action on the global stage would seem likely to change the typical relationship between commodity prices and global trade, which typically tend to run in the same direction.
Export Goods/Services as % of Global GDP vs. Bloomberg Commodity Index
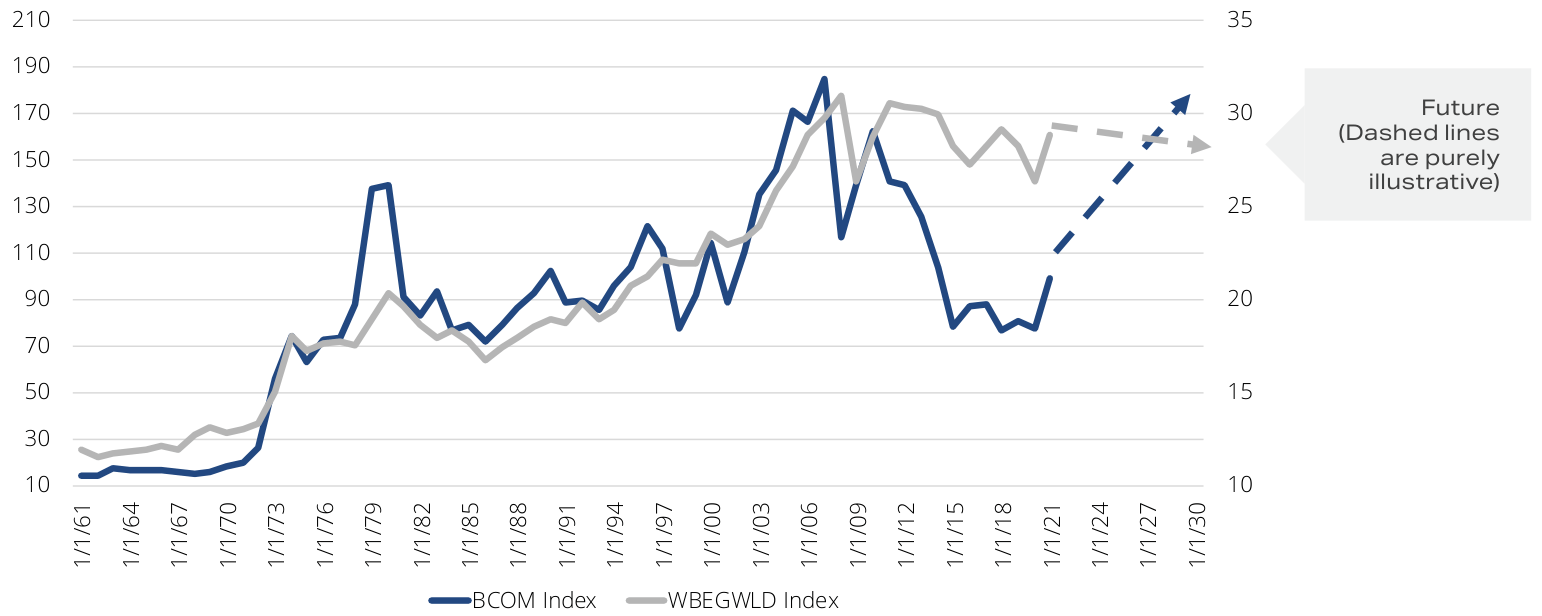
With increased self-interest on the global stage and a greater focus on shielding and promoting relative competitive advantages across numerous industries, commodity supply security will become increasingly important for nations, reversing a trend of the last decade. As nations wean themselves off imports, they will need to develop more homegrown or friendly nation resources. We believe the subsequent rising investment and marginal cost of production will manifest itself for many years as an inflationary impulse and drive strong commodity prices, especially in metals.
Returning to portfolio positions, we exited our position in Ionic Rare Earths Metals ( IXRRF ) with a painful 50% loss. Ionic is our third mining firm exit with a loss since the portfolio’s inception, bringing our mining batting average on exited positions to 75% with an average return of 46%. Our current positions include four long-term winners (AFM CN, LAC US, EQX US, and ADT AU). AFM:CA , LAC , and ADT all have returns above 100%. EQX is a modest winner, but as we have discussed previously, it has not been monetized as effectively as it should have been.
We currently have one problem position on the books among our metals and mining positions: Centaurus Metals ( CTTZF ), our sole Nickel focused position. We aggressively built CTM AU into a 6% position last year, at its peak, only to have the stock sell off as much as 50% and ,as of the writing of this letter, down 36%. One of the challenges with metal and mining stocks is that every metal and mine is different. This means, in essence, every time you venture into a new metal, you are taking on the challenge of effectively learning a new industry. Admittedly, there are similarities, but there are also impactful nuances. Our aggressive build last year into CTM should probably have been tempered by a little more humility.
We have carefully reassessed CTM and decided that, although we may have been overly aggressive in our position build given the firm’s timeline to production and offtake constraints, our assessment of the deposit’s prospectivity was accurate. With a combination of Measured & Indicated and Inferred Nickel Equivalent of 1,049 Kt and a grade of 0.97% CTM has the sixth-highest percentage of payable Nickel to recoverable Nickle of the 15 projects we currently track. Additionally, during the second quarter, CTM management struck a deal with Vale (the previous owner of the deposit) to take back control of 100% of the mine’s offtake, meaning that of the projects we follow, CTM is the only one that is an open pit nickel sulfide project, with more than 1Mt NiEq and a sub $500m capex cost that also retains 100% of their offtake rights.
The offtake rights are essential because they significantly broaden the strategic pathways available to CTM management to fund and de-risk the development of the Jaguar deposit against the backdrop of robust demand growth for nickel sulfate products globally due to growing battery demand. Our execution missteps don’t come without a cost, the most obvious being our significant unrealized loss. Additionally, in our reassessment of the asset, we have significantly reduced our bull, base, and bear case, reducing our expected value from $3.63 per share to $2.56 per share, a drop of 30%. At the current price, that represents a 183% return, but our average entry price represents a far more benign 80% return.
Although the asset remains highly attractive, given the challenges associated with junior mining, this is a less robust risk-adjusted return than we would usually like to see from our junior mining investments. As we have noted before, with real assets, we are back at the racetrack, winning by betting on the horse with the most mispriced odds, not necessarily the horse that wins. Within this context, we did not buy as well as we should have.
Diversified Industrial (8.1% Gross, Net 5.6%)
Within diversified industrials, the only stock worth discussing this quarter is Siemens Energy ( SMEGF ), which was up 33% YTD through the start of trading on 6/22/2023 but closed the day with a 38% loss as a result of management withdrawing profit guidance due to the need for additional loss provisioning at the firm Siemens Gamesa (SGRE) wind turbine subsidiary. The provisioning was driven by a substantial increase in wind turbine components’ failure rates, which management estimated to be greater than previously estimated. While potential costs remain under evaluation, they will likely be more than €1bn. Management expects to provide more details when they present third-quarter results on 8/7/23.
On a call to discuss the issues, management confirmed that the issues originated with legacy-installed onshore turbines. The issue affects 15%–30% of the onshore installed turbines (representing>100GW at the end of March 2023), and management said that the flaws were in rotors and bearings. Although ENR is the only firm to announce quality issues of this magnitude, we would note that the entire industry suffers from quality issues and struggles to ramp up production to meet demand.
Over the last five years, the industry has had to contend with the falling price of turbines as firms competed for market share, the rapid introduction of technology to bring down costs and grow turbine size, supply chain, logistics challenges, and material cost inflation. The financial results of the last three years show all four listed wind-turbine OEMs have suffered from quality issues. Given this, what matters for customers is how the turbine OEMs address the issues.
The current demand for wind turbines is sufficient, and the supply chain is tight enough that it is difficult to see how this will have anything more than a minimal impact on the long-term commercial prospects of SGRE onshore. We would be surprised to see the €5.5bn backlog of onshore turbines shrink and have no expectation or reason to assume the €11.5bn offshore backlog will do anything but continue to grow.
Theoretical charges of around €1bn represented about 5.3% of the firm’s pre-announcement market capitalization. The sell-off post-announcement knocked off roughly €7.3 bn in value or 39% of the firm’s market capitalization. Before the announcement, we valued the firm at roughly €30 to €35 a share. Although a complete and final reassessment of how events impact the firm’s value awaits the information management suggested was forthcoming on the 8/7/23 call, we believe the firm to be worth roughly €18 to €20 assuming SGRE is worthless, an unlikely outcome. As such, we took the sell-off as an opportunity to add 2% to our position, reducing our average entry cost by 6%.
As always, we appreciate the trust and confidence you have shown in Massif Capital by investing with us. We hope that you and your families stay healthy over the coming months. Should you have any questions or concerns, please do not hesitate to reach out.
Best regards,
Will Thomson | Chip Russell
Footnotes1 The term is often credited to Antoine-Henri Jomini, a Swiss military officer who served as a General in the French and Russian militaries during the Napoleonic Wars. He was also a stockbroker for a short period of time in Paris and, second only to Carl Von Clausewitz, is probably the most well-known and widely read military theorist. |
| DISCLOSURES: Opinions expressed herein by Massif Capital, LLC (Massif Capital) are not an investment recommendation and are not meant to be relied upon ininvestment decisions. Massif Capital’s opinions expressed herein address only select aspects of potential investment in securities of the companies mentioned and cannot be a substitute for comprehensive investment analysis. Any analysis presented herein is limited in scope, based on an incomplete set of information, and has limitations to its accuracy. Massif Capital recommends that potential and existing investors conduct thorough investment research of their own, including a detailed review of the companies’ regulatory filings, public statements, and competitors. Consulting aqualified investment adviser may be prudent. The information upon which this material is based and was obtained from sources believed to be reliable but has not been independently verified. Therefore, Massif Capital cannot guarantee its accuracy. Any opinions or estimates constitute Massif Capital’s best judgment as of the date of publication and are subject to change without notice. Massif Capital explicitly disclaims any liability that may arise from the use of this material; reliance upon information in this publication is at the sole discretion of the reader. Furthermore, under no circumstances is this publication an offer to sell or a solicitation to buy securities or services discussed herein. |
Editor's Note: The summary bullets for this article were chosen by Seeking Alpha editors.
For further details see:
Massif Capital Q2 2023 Letter To Investors