MTZ - MasTec: Best Near-Term Electrical Infrastructure Rebuilding Cap-Gain Wealthbuilder
Summary
- Rising security concern over weather-ravaged North American electrical grid, coupled with large auto energy-fuel conversion from gasoline to electricity? That is MasTec's principal business.
- “Likely” is the keyword in uncertain-future forecasts, where profit-margin capture and stock-price increases are a combination of corporate managerial skills and current market circumstances.
- Accounting records show prior management skills, and market-arbitrage records show prior and current market price expectations. All encourage direct comparison of related competitors’ prospects for coming stock prices.
Our Investment Thesis
Is expressed in the above bullet-points, where odds for, and size of near-term capital gains are put on a comparable basis.
The dominance of MasTec, Inc. (MTZ) in following the outcome of that analysis over investment-comparative alternatives makes reading the rest of this article worth your time and effort if you are interested in rates of near-term capital gains. Ones which are likely to be multiples of what market-index averages regularly offer.
Description of Principal Investment Subject
MasTec, Inc., an infrastructure construction company, provides engineering, building, installation, maintenance, and upgrade services for communications, energy, utility, and other infrastructure primarily in the United States and Canada. In addition, the company offers maintenance and upgrade support services comprising maintenance of customers' distribution facilities, networks, and infrastructure, including communications, power generation, pipeline, electrical distribution and transmission, and heavy civil infrastructure; service restoration for natural disasters and accidents; and routine replacements and upgrades to overhauls. Its customers include public and private energy providers, pipeline operators, wireless and wireline/fiber service providers, broadband operators, install-to-the-home service providers, and government entities. MasTec, Inc. was founded in 1929 and is headquartered in Coral Gables, Florida." - Source: Yahoo Finance
Yahoo Finance
Alternative Investment Competitor Rewards and Risks
Figure 1
blockdesk.com
(used with permission)
Upside price rewards are from the behavioral analysis (of what to do right, not of errors) by Market-Makers [MMs] as they protect their at-risk capital from possible damaging future price moves. Their potential reward forecasts are measured by the green horizontal scale.
The risk dimension is of actual price draw-downs at their most extreme point while being held in previous pursuit of upside rewards similar to the ones currently being seen. They are measured on the red vertical scale.
Both scales are of percent change from zero to 25%. Any stock or ETF whose present risk exposure exceeds its reward prospect will be above the dotted diagonal line.
Best reward-to-risk tradeoffs are to be found at the frontier of alternatives down and to the right. As a market-index "norm" currently, the S&P 500 Index ETF (SPY) is at location [2]. At the more extreme trade-off of Risk vs. Reward is PWR at [8]. Our present primary interest is MTZ at location [13].
Is the added reward of MTZ worth the added risk compared to [[PWR]]? A fuller description of investing considerations should add to investors' decisions of the suitability and credibility of the available investment alternatives. Figure 2 presents some of those considerations, drawn from outcomes of prior MM forecasts having the same up-to-down earlier expectation proportions as those of today.
Figure 2
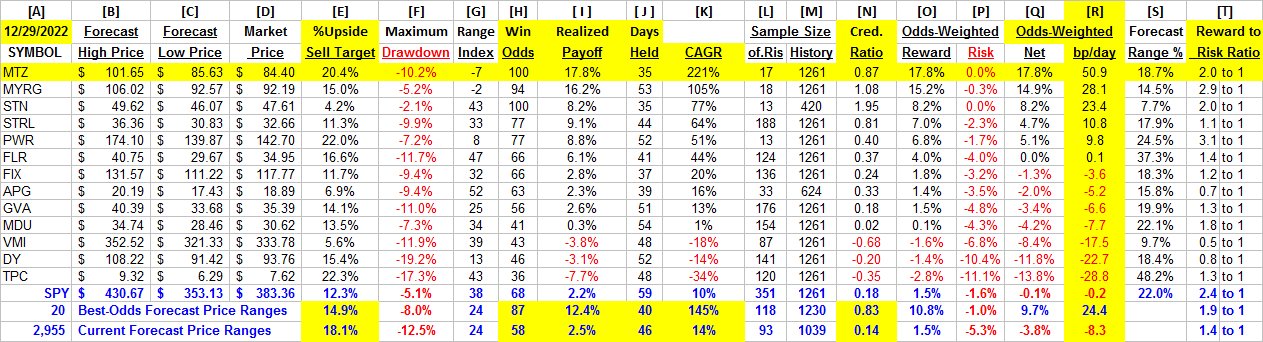
The advantage of determining Market-Maker forecasts for coming stock prices is that they offer many dimensions more than typical "street analyst" forecast of a single target-price at one point in time. Instead of only one higher (or lower) future price, the MM forecasts are drawn from market data valid across relevant (typically shorter) periods of time for both the upper and lower price limits seen as likely to be encountered in such a period.
That range of coming prices for each investment candidate is clearly split into upside and downside prospects by its today market price. We note what proportion of that whole forecast price range is between the today market quote and the low-end prospect, the downside exposure. We label that % of the range as the Range Index [RI] and note it in column [G] of Figure 2. It gets used to identify and average all prior RIs of similar size as a suitable sample of subsequent market outcomes in column [L], as a proportion of all price-range forecasts for the stock in the past 5 years of market days [M].
With those samples, scaled individually to each candidate's relevant prior-sample outcomes, we now can make appropriate direct comparisons of answers to questions of:
How big a capital gain might be expected from this stock in the next few months? [ I ] Out of the sample, what are the Odds ( how likely ) that any one will be profitable? How long , on average, [J] might it take for a typical sample holding to come to a disciplined termination? In that average holding period, how bad an interim price drawdown might be experienced? How credible [N] is the current upside forecast [E] compared to what history realized [ I ]? Given [E] and [F], what is the current Reward to Risk [T] ratio?
Given that we are posed with a decision under the inevitable uncertainty of the future, no collection of answers or actual outcomes can be expected to prove perfection. But on balance they should help investors to tailor their candidate choices to best address the degree to which the data leads to the most satisfying outcomes, most of the time.
Trend of Market-Maker Price Range Forecasts
Figure 3
used with permission
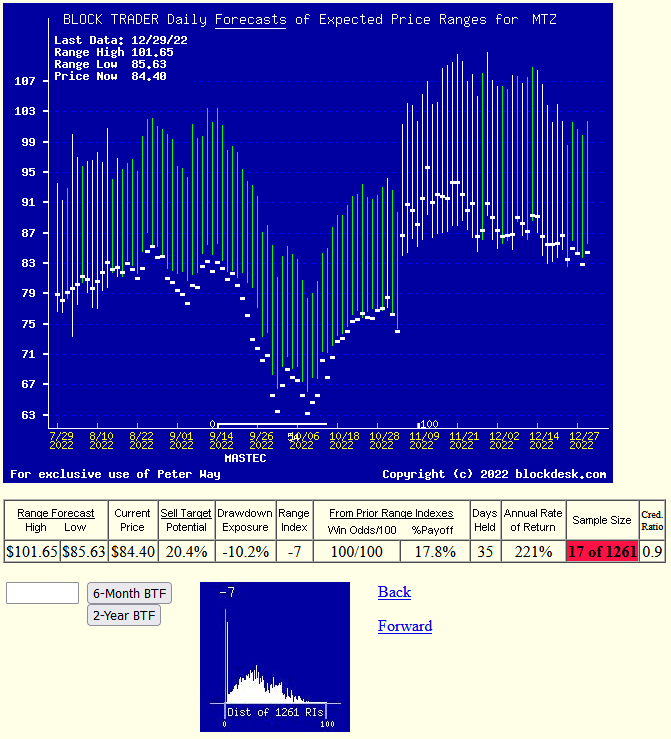
This IS NOT a typical "technical analysis chart" of simple historical (only) observations. Instead it pictures the daily updated trend of Market-Maker price range forecasts implied by live real-capital commitments in real time.
Its communicative value is present here by visual comparisons of the proportions of upside and downside price change expectations at each forecast date. Expectations of the market-making community, as influenced by the actions of an interested and involved big-$ institutional investing participants.
Those forecasts are typically resolved in time horizons of less than a half year, and often in two months or shorter. This one states that in the prior 5 years all of the rare 17 prior forecasts like today's, were profitable, completed in 35 market-days (7 weeks) profitably at average +17.8% gains, a CAGR rate of 221%. No promises, just reassurances from history.
Where the objective is to find from the candidates in Figure 2 the biggest, quickest, most likely capital gain in the next 3 months with the least interim price drawdown distress, it appears that the logical choice is with MTZ as it rebuilds storm-raged Florida, among other projects.
Conclusion
Comparing these investment candidates to choose the best near-term capital gain prospect, MasTec, Inc. appears to be far better suited than all the others.
For further details see:
MasTec: Best Near-Term Electrical Infrastructure Rebuilding Cap-Gain Wealthbuilder