MTDR - Matador Resources: Oil Growth With A Near-Term Upside Catalyst
2023-07-17 12:33:50 ET
Summary
- MTDR is an oil and gas producer focused on the Delaware Basin located in west Texas and New Mexico.
- In April, MTDR completed the acquisition of Advance Energy Partners for $1.6 billion, adding to its core acreage in the Delaware Basin.
- Thanks to both organic growth and the Advance deal, MTDR is among the fastest growing shale producers in the US.
- Management has hinted at better-than-expected production and lower-than-expected costs in 2023 and I expect a positive revision to guidance on its July 26th conference call.
- Using my free cash flow model I derive a discounted cash flow target for MTDR of over $66 per share, a 25% premium to the current price.
Over the past few months, I’ve covered several US-based oil and gas shale exploration and production (E&P) companies on Seeking Alpha.
That list includes bullish articles covering Range Resources ( RRC ) and Southwestern Energy ( SWN ) and a hold rating on Devon Energy ( DVN ).
This week, I’ll turn to Matador Resources ( MTDR ), an E&P that focuses on the western portion of the Permian known as the Delaware Basin. The company holds 150,000 net acres spread across Lea and Eddy counties in southeastern New Mexico as well as across the state line in western Texas.
The Delaware Basin is a prolific, low-cost shale region.
While the exact production mix in this area varies by acreage location, wells in the Delaware portion of the Permian generally produce somewhat less oil and more natural gas and NGLs than wells located in the Midland Basin of the Permian further to the east in Texas.
In Q4 2022, 55.8% of MTDR’s total barrels of oil equivalent production was crude oil with the remainder coming from gas and natural gas liquids (NGLs). MTDR is a “two-stream” company, reporting and offering guidance on quarterly oil output while simply including NGLs volumes as part of the company’s reported natural gas output.
The result of the latter policy is that MTDR’s realized gas prices appear higher than many other producers thanks to the higher-value NGLs volumes produced and reported as part of the natural gas stream.
In addition to its core upstream production business segment, MTDR also owns significant midstream infrastructure much of it through a 51%-owned joint venture (JV) called San Mateo.
MTDR’s midstream business consists of natural gas and oil gathering pipelines, gas processing capacity, water pipelines and disposal wells. Gathering pipelines are small diameter pipes that connect individual wells to processing facilities and, ultimately, longer distance pipelines needed to transport commodities to market.
The raw natural gas stream produced from wells consists of natural gas (methane) as well as a mix of other hydrocarbons like propane, ethane and butane known collectively as natural gas liquids (NGLs). Processing plants are used to separate NGLs from the raw gas stream for sale separately, often at higher realized prices than pure methane.
Finally, producing shale requires the use of a technique known as hydraulic fracturing. In short, this involves pumping large quantities of water and sand into a well under immense pressure. This process creates cracks or “fractures” that facilitate the flow of oil, gas and NGLs through the reservoir rock and into a well.
The fracturing process requires a large amount of fresh water, which is in short supply in certain areas of the US including the Delaware Basin of the Permian. MTDR’s water-related infrastructure moves produced water to wells to facilitate fracturing, and removes water that flows back out of a well after fracturing for disposal.
The midstream business is far smaller than MTDR’s core production business but it’s still important for two reasons.
First, MTDR is able to use its own infrastructure to process gas it produces, supply water for its drilling operations and collect produced oil and gas volumes from wells. The alternative would be for MTDR to pay a third party for these services, which tends to be more expensive for the operator than using their own pipeline and processing capacity. So, owning midstream assets helps MTDR control costs and guarantee access to crucial infrastructure.
Second, MTDR earns revenues from third parties for the use of their midstream assets. These are mission-critical services and infrastructure for E&Ps. That's why the revenue stream from midstream assets is often compared to a toll booth – the more third-party volumes MTDR handles, the higher its fees. By using some of its excess midstream capacity to serve other companies, MTDR adds an additional, more stable revenue source to its income statement.
No two E&Ps are alike. Even names that produce in the same region or field can have different mixes of commodities, cost structures and hedging policies that have a dramatic impact on valuations.
However, there’s one thing many US-based E&Ps share right now – limited expected production growth, particularly for crude oil, in 2023. In that regard, Matador Resources stands out:
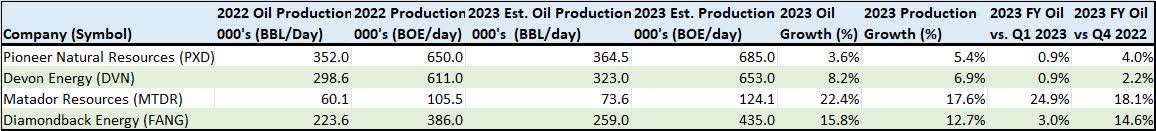
This is far from an exhaustive list of US E&Ps. However, I’ve included data for Matador Resources as well as three other larger E&Ps with significant exposure to the Permian Basin.
In particular, my table includes data for 2022 oil production in barrels per day (bbl/day) as well as total production in barrels of oil equivalent per day (boe/day). I’ve also included the mid-point of management’s most recent guidance for full-year 2023 oil, and total, production.
The final columns show 2023 production growth in percentage terms for crude and on an oil equivalent basis. I’ve measured growth compared to 2022 production total as well as average daily output in Q4 2022 and Q1 2023.
Most US E&Ps, even those producing from the Permian Basin, the cheapest-to-produce shale oil field in the US, are expecting only modest production growth for 2023.
There’s good reason for that:
Boom, Bust and Shareholder Returns
Modest production growth is not a negative. Indeed, many of us with experience watching the group wince at the very thought of E&Ps ramping up their capital spending ((CAPEX)) in search of production growth.
According to the US Energy Information Administration ((EIA)), total US oil production ramped up from 5.593 million bbl/day in mid-2011 to a peak of about 13 million bbl/day in early 2020.
This period marked the shale boom when most US producers sought rapid production growth at any cost. Producers were willing to outspend cash flows by borrowing money, or issuing stock, to fund higher CAPEX and drilling activity.
The result was the dramatic growth in US production I just outlined. However, there was a heavy cost for shareholders: Most producers failed to generate consistent free cash flow or return significant capital in the form of dividends and share buybacks.
There was plenty of growth, but meager profitability.
This shale boom hyper-growth phase began to crumble as oil prices collapsed starting in late 2014, rendering much shale-focused drilling activity unprofitable. And by the time of the 2020 COVID lockdown-driven collapse in global demand and commodity prices, the borrow-and-grow strategy of the boom years was already largely dead.
Most US producers, particularly larger E&Ps, began switching to a different business model that some have dubbed “Shale 2.0.” The idea is simple – rather than targeting growth in barrels produced regardless of cost, most US shale producers seek to maximize free cash flow, setting their capital spending based on a sober, conservative view of the commodity price outlook and their cost structure.
Many E&Ps like Devon and Pioneer Natural Resources ( PXD ) have also unveiled plans to tie shareholder returns directly to profitability, paying a base dividend plus supplemental variable distributions based on quarterly cash flows.
To protect cash flows, US producers have largely responded to the sell-off in oil and natural gas prices from last year’s peak by cutting their drilling plans for 2023:
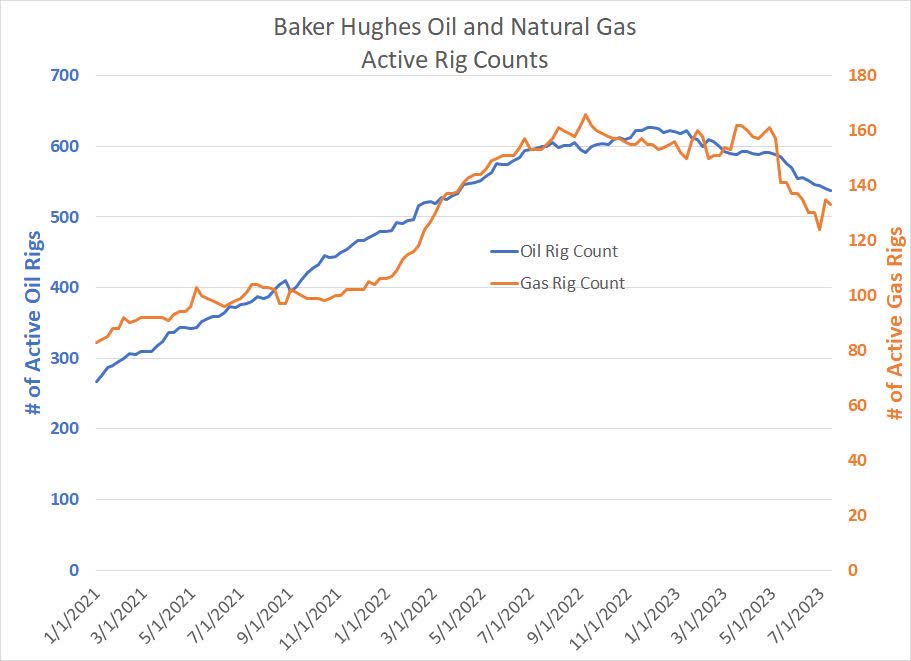
This chart shows the number of rigs actively drilling for oil (blue line) and natural gas (orange line) in the US since the end of 2020. Amid a broader recovery in oil and gas prices in 2021-22, US producers ramped up their drilling activity, albeit at a more restrained pace than was common before the shale bust.
The natural gas rig count peaked in September 2022 and producers have shed 33 rigs since that time, equivalent to almost a 25% decline from last year’s highs. For oil, the rig count peaked in November and producers have laid down 90 rigs since that time, a more than 14% decrease.
It takes time for a well to be drilled, fractured, and put into production, so the impact of a falling rig count, and the associated decline in the total number of wells drilled and fractured, takes time to show up in the form of flat-to-falling production. That lagged impact is the main reason you’re still seeing some production growth for the full-year 2023 compared to 2022 from some US shale producers. However, look at the column in my table showing full-year 2023 production growth compared to Q1 2023 and growth is less than 1% for both Pioneer and Devon on the oil side.
Even the two producers in my table showing meaningful growth in production this year – Diamondback ( FANG ) and Matador ( MTDR ) – are both benefiting from the impact of recent acquisitions. However, in MTDR’s case, the $1.6 billion acquisition of Advance Energy Partners completed in mid-April is a more transformational deal.
In addition, as I’ll explain in just a moment, I expect the production tailwind from MTDR’s Advance acquisition to last through 2024 as well.
However, just because MTDR stands out as an oil production growth story doesn’t mean I’m changing my methodology for valuing the E&P.
Free Cash Flow is Still King
For each of the E&Ps I’ve written about on Seeking Alpha this year I’ve followed the same basic process, creating a model of the company’s production and costs based on management guidance. I then use that model to estimate potential free cash flow based on conservative commodity price projections and use those estimates to derive a discounted cash flow target for the stock.
Just because MTDR is growing production changes little – I’m still looking for profitable production growth that can support a higher valuation for the stock.
So, let’s start with a look at MTDR’s results in Q1 2023:
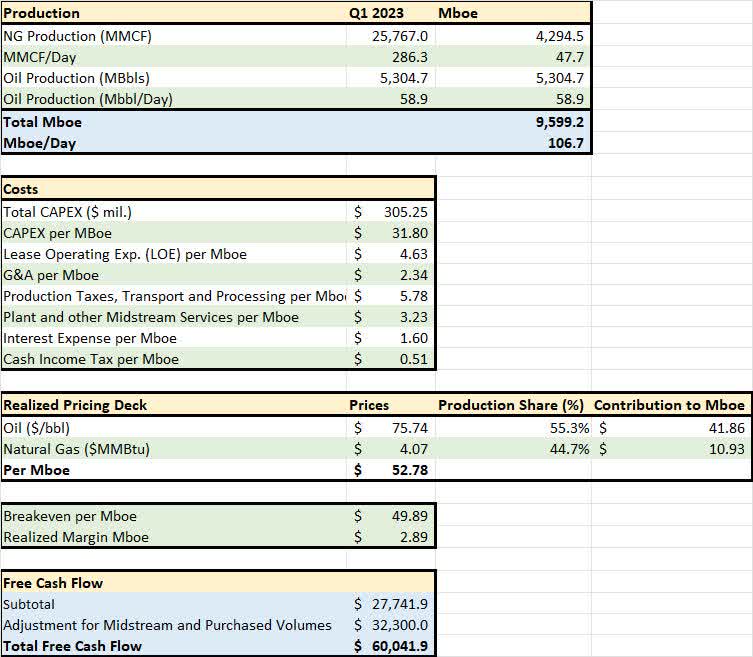
MTDR Q1 2023 Free Cash Flow Model (MTDR Q1 2023 Results, 10-Q and Presentation Slides)
This table lays out MTDR’s results in Q1 2023 .
A few points to note here. First, MTDR announced the acquisition of Advance Energy Partners on January 24, but the deal didn’t close until April 13, after the end of Q1 2023. So, the results presented for Q1 include no volumes from Advance.
Second, as I noted earlier, MTDR has two business segments, the upstream E&P business and the midstream pipelines and processing business. While MTDR breaks out capital spending and expenses related to its midstream business, it’s tough to separate these two businesses for analysis because they’re so integrated – MTDR’s upstream business benefits from its ownership of midstream assets and the parent company also benefits directly from third- party midstream revenues.
So, both pieces of MTDR’s business are covered in my table above.
Let’s run through some of the more important line items in the table.
The top section deals with MTDR’s Q1 2023 production in terms of oil and natural gas volumes produced; as I noted earlier, MTDR includes NGLs volumes as part of the gas production stream. I’ve also reported total Q1 2023 production in the form of barrels of oil equivalent ((BOE)), using the conventional conversion factor of six thousand cubic feet of natural gas to one barrel of crude oil.
Also, by convention, I’m using the Roman numeral “M” to denote 1,000 and “MM” for 1 million (1,000 times 1,000 equals 1 million).
In Q1, a little over 55% of MTDR’s output was crude oil with the rest from natural gas, which in MTDR’s case means natural gas and NGLs.
The second section of the table presents the company’s costs. CAPEX of $305.25 million in Q1 2023 consists primarily of the cost of drilling and completing (fracturing and putting into production) new wells with only around $14 million directed at spending related to the company’s midstream assets. I’ve also reported that CAPEX on a $/boe produced basis – MTDR’s Q1 2023 CAPEX comes to $31.80 per boe.
Lease operating expenses (LOE) are costs associated with maintaining and producing oil, and gas from existing wells. Production taxes, transportation and processing would include taxes paid based on the value of oil and gas produced from wells (not income taxes) as well as the cost of transporting commodities to market and money paid to process natural gas into methane and barrels of NGLs.
You’ll also note that additional line item titled “Plant and Other Midstream Services.” These are primarily the costs of running the company’s processing plants and maintaining its existing base of gathering pipelines and related equipment. While this does not directly relate to MTDR’s core business of producing and selling oil and gas, it’s still important – some of this cost could be attributed to handling MTDR’s produced volumes while some would be in support of third-party volumes and generates real midstream revenue and income for MTDR shareholders.
The remaining costs are likely familiar to most investors including general and administrative (G&A) expenses, interest expenses and income taxes, all expressed on a $/boe basis.
The third section of my table shows the actual realized prices MTDR received for its oil and gas production in Q1 2023.
The company realized a price of $75.74/bbl for its oil output in Q1; since MTDR had no significant oil hedges in Q1, that’s the actual price it received with no hedge adjustment.
For gas, the company’s unhedged price was $3.93/Mcf with hedges boosting that to $4.07/mcf. If that looks a bit high relative to depressed gas futures prices in Q1 2023 recall that MTDR’s reported gas volumes also include some NGLs pricing uplift; in Q2 2023, MTDR guided for its gas volumes to sell for a premium of between +$0.25/mcf and +$1.25/mcf to benchmark Henry Hub gas prices.
To create a realized price in terms of barrels of oil equivalent, I simply multiplied realized prices by their relative share of Q1 2023 production.
Putting this all together, the sum of all cash costs – mainly for the E&P segment but also significant sums for the midstream business as I just outlined – comes to $49.89/boe in Q1 2023 compared to a realized price of $52.78/boe and a cash margin of $2.89/boe. Multiplying that margin by total production yields a rough estimate of free cash flow of $27.75 million in Q1.
However, recall that this cash flow breakeven includes some costs related to the midstream segment. Meanwhile, my calculation of revenues from oil production – BOEs of production produced multiplied by realized pricing – includes none of the revenues associated with handling third-party midstream volumes. The last lines adjust free cash flow for midstream cashflow and purchased volumes, which represents natural gas MTDR purchases and resells at a markup.
All told my Q1 2023 free cash flow estimate is about $60 million.
Free cash flow isn’t a GAAP measure, so different companies define it in different ways. However, MTDR reported Q1 2023 free cash flow of $57.24 million and some analysts on Wall Street calculated Q1 2023 FCF as high as $63 million based on the same report. So, this model appears to be a good approximation.
Let’s step the analysis forward for 2023 as a whole.
Cash Flow Model for 2023
As I noted earlier, MTDR’s acquisition of Advance Energy Partners was announced back in January and closed in mid-April.
During the company’s Q4 2022 earnings call held on February 21, 2023 management offered some guidance for 2023 production and costs that included the planned closing of this deal in Q2 2023.
By the time the company reported Q1 2023 results on April 25, MTDR had only owned Advance for about two weeks. Management did offer some more qualitative updates to its 2023 guidance, but didn’t change the actual outlook guidance table for 2023.
So, to start I built a simple model for 2023 cash flows based on that guidance; later, I’ll adjust some of these assumptions based on management’s more qualitative remarks on the Q1 2023 call:
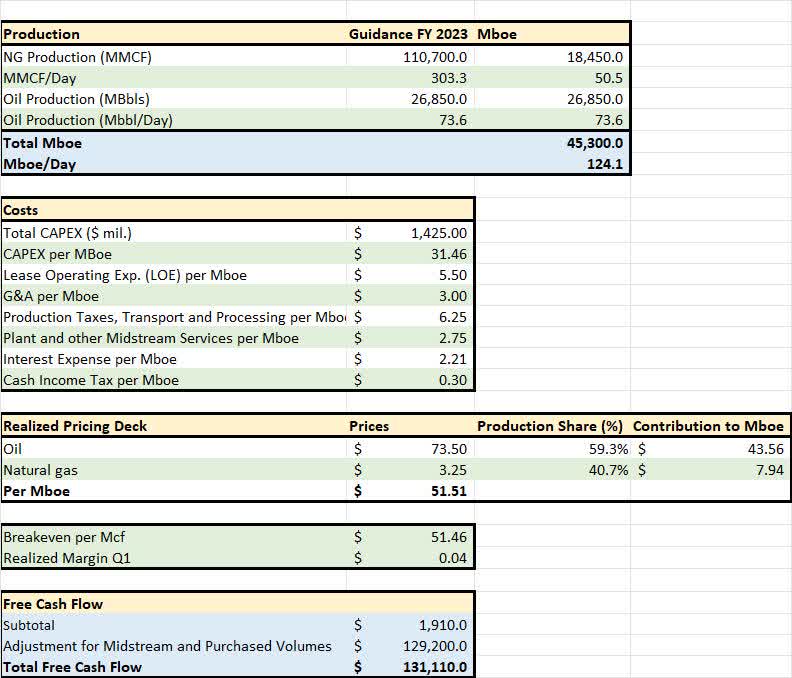
MTDR Free Cash Flow Model for 2023 (MTDR Q1 2023 Earnings Press Release)
This table uses the same format to that presented for Q1 2023 above, so the line items should be largely familiar.
The production and cost estimates were most recently presented in the company’s Q1 2023 earnings presentation in April; however, as I’ve outlined, the guidance was unchanged from the original guidance issued in late February.
A few points jump out from this slide. First and foremost, while crude oil accounted for a little over 55% of Q1 2023 volumes, that's expected to increase to a little over 59% for full-year 2023 production. The main reason is that wells on the acquired Advance acreage, where MTDR is focusing a good deal of its 2023 spending, have a bit higher oil cut – percentage of production that’s crude – than the average MTDR well across its acreage.
Advance has about 18,500 net acres located close to or contiguous with MTDR’s existing acreage in the core of the Northern Delaware Basin. On the company’ Q1 presentation, MTDR reported a well located near Advance’s existing acreage that produced 89% oil in its first 30 days of production, which is well above MTDR’s average oil cut.
Also, while reserves are an imperfect guide to production percentages, about 73% of Advance’s reserves are oil compared to 56% for MTDR as of December 31, 2022 before the acquisition.
Also keep in mind that 2023 guidance includes one full quarter without Advance’s oily output and a little under three quarters with Advance. So, when stepping forward to consider 2024 output, when all four quarters would include wells on Advance acreage, it’s logical to expect a higher oil cut. This is beneficial because more oil production boosts the value of a barrel of oil equivalent produced.
I’ve bumped up MTDR’s cash interest expense compared to Q1 to reflect the additional debt – a draw on MTDR’s revolving credit line – the company took on to acquire Advance. The company plans to prioritize repayment of debt related to the deal using available free cash flow; MTDR estimates it will repay about $700 million worth of borrowing by year-end 2024, bringing total debt back to a little under $1.2 billion.
For the realized pricing deck, MTDR has no remaining oil or natural gas hedges for 2023.
MTDR doesn’t provide pricing discount estimates for the whole of 2023, but management did offer guidance for Q2 2023. The midpoint of that guidance is for natural gas production to sell at a $0.75/mcf premium to Henry Hub (NYMEX) benchmarks and for crude oil at a discount of $1/bbl to West Texas Intermediate ((WTI)).
To derive my realized pricing guidance for 2023, I combined actual pricing reported for Q1 2023, the actual average pricing for WTI and Henry Hub natural gas in Q2 2023 (April, May and June averages based on daily pricing data). I then applied the Henry Hub gas pricing premium and WTI pricing discount I just outlined.
For the balance of 2023 I used average prices so far in July coupled with the calendar strip for the last five months of the year, using the same pricing discounts I outlined for Q2 2023. The strip is nothing more than the average price of oil and gas futures for delivery in the months of August-December 2023.
Finally, to account for the midstream business I simply annualized the cash flow adjustment I used in Q1 2023.
All told, based on these estimates I derive a rough cash flow estimate of about $131 million for 2023. That’s a bit below the midpoint of Wall Street consensus estimates for the year; per Bloomberg, the lowest free cash flow estimate for 2023 is $65 million and the highest is $416 million.
In short, based on the midpoint of guidance, MTDR will struggle to generate significant additional free cash flow in 2023 – my modeled FCF of $131 million works out to a free cash flow yield of around 2.1% based on the current price of the stock. Weakness in free cash flow is due to a combination of the drop in commodity prices and higher CAPEX and operating expenses due to industry-wide cost inflation and the need to layer in additional spending to support the acquired Advance acreage.
The good news is that I see significant upside to these estimates for the balance of 2023 and significant growth over the next few years even on conservative pricing assumptions.
Conservative Guidance
As I outlined earlier, MTDR published its first guidance for 2023 production and costs in late February. This was after the company announced the Advance acquisition but before the deal closed in mid-April. The company did include the impact of the deal on its 2023 guidance though, at that time, the exact closing date of the deal was unknown, so guidance could be considered preliminary.
By the time of the company’s Q1 2023 conference call on April 26, the Advance deal had closed but MTDR had only owned Advance for about two weeks. Management did not update their guidance table, though they did include a line in the presentation slide that they expect total estimated 2023 production to be “near the high end” of their previously issued guidance.
It appears the lack of new, higher guidance disappointed some on Wall Street.
Management was asked for additional details about potential production growth in 2023 and 2024 several times during the Q&A portion of the call; in addition, despite better-than-expected Q1 2023 production and results, the stock sold off 3.55% in the first trading day following its Q1 2023 release.
While the SPDR Oil & Gas Exploration and Production fund ( XOP ), a widely followed exchange traded fund (ETF) that tracks the group, was also down by 1.75% on the same day, MTDR shares still underperformed.
Regardless, if you care to read between the lines of the Q1 conference call , there was encouraging news on costs and production growth.
The very first question on the call covered management’s guidance for drilling and completion (D&C) costs in 2023. Specifically, the company guided for full-year D&C costs of $1,124 per foot of well length.
Look at my cash flow models above, and you’ll see that CAPEX is the single largest cost for MTDR just like most other E&Ps. And the single largest component of CAPEX is the cost of drilling, fracturing, and putting new wells into production through the year – this is all summarized by that crucial D&C cost per foot guidance.
Here's the response from the Co-Chief of Operations, Chris Calvert:
And, yeah, so the $1,124 that you mentioned, that was our full-year guide, and that was with a 10% to 20% increase from service cost inflation. That we really started working on in December of last year. And so, we did not put anything out publicly, but our D&C cost per foot for this quarter definitely came in below that; they came in around $1,014 per foot, so we were proud of where we were, and those efficiencies were through reductions in drill times, Simul-Frac, remote Simul-Frac.
We had kind of -- in 2022, we had basically used Simul-Frac on about 45% of our wells. We put a target to use over half of our wells in 2023 to be Simul-Frac, and in the first quarter we beat that. And so, a lot of this efficiency has come from reduction on the drilling times, increased use of Simul-Frac, increased use of dual fuel. So, we're definitely extremely excited and proud of the work that we did on the capital efficiency side in reducing those D&C cost per foot.
But one thing I would like to mention, on the service cost side, we really haven't seen other than small cost components such as diesel fuel that you and I spoke about in previous conversations. We really haven't seen costs come down all that much from the vendor side. We have a couple of our heavy-components on both drilling and completion that were actually up quarter-over-quarter from the fourth quarter of 2022 till today, or till the first quarter of '23. And so a lot of those savings, really mostly all of those savings have been through efficiencies. And that's reduced drill times, going back reusing existing pads on the production facility side, increased use of dual fuel, better partnerships with third-party operators and specifically San Mateo when it comes to water usage, and getting better rates on our water for stimulations. And that's -- we lean on our partnership with San Mateo for that.
And so it really has been a push from the operations group to mitigate those service cost inflations that we've seen. But, like we say, it's really one quarter's worth of work. And so, while we're proud of where we are, we still have a lot to do in this year. And so, the $1,124 that we put forward in the capital guidance plan, that was put forward in December. And we're still happy with where that number is, but we're extremely proud of where we came in in the first quarter.
Source: MTDR Q1 2023 Earnings Call Transcript
Simply put, in Q1 2023, D&C costs per foot came in about $110 per foot below the company’s full-year 2023 guidance. Effectively what that means is that MTDR can drill the same number of wells with less CAPEX or drill more wells, and likely generate more production growth, with the same amount of CAPEX.
Even better, this was not due to a decline in the fees drilling services companies charge for their work and equipment. Rather, the better-than-expected costs were due to greater efficiency and the use of new well designs that cut the amount of time needed to drill and complete a well.
There are a number of components to these efficiency gains. One is what’s called “Simul-Frac.” As I mentioned earlier, shale wells must be fractured before they’re put into production, a process that involves pumping primarily water and sand into the well under pressure. This process is done in stages across the length of the producing horizontal segment of a well.
Simul-Frac essentially involves fracturing two horizontal wells at the same time (simultaneously) rather than in sequence, using a single fracturing fleet. A fracturing fleet is a collection of pumps, trucks, crews and other equipment used to fracture a well.
The benefit of this process is that it takes less time to complete wells. That translates to less cost per well and it cuts the time required from drilling a well to first commercial oil production. In 2022, MTDR fractured about 45% of its wells using this method and guidance was based on more than half in 2023 as a whole; in Q1 2023 the company has already exceeded that guidance.
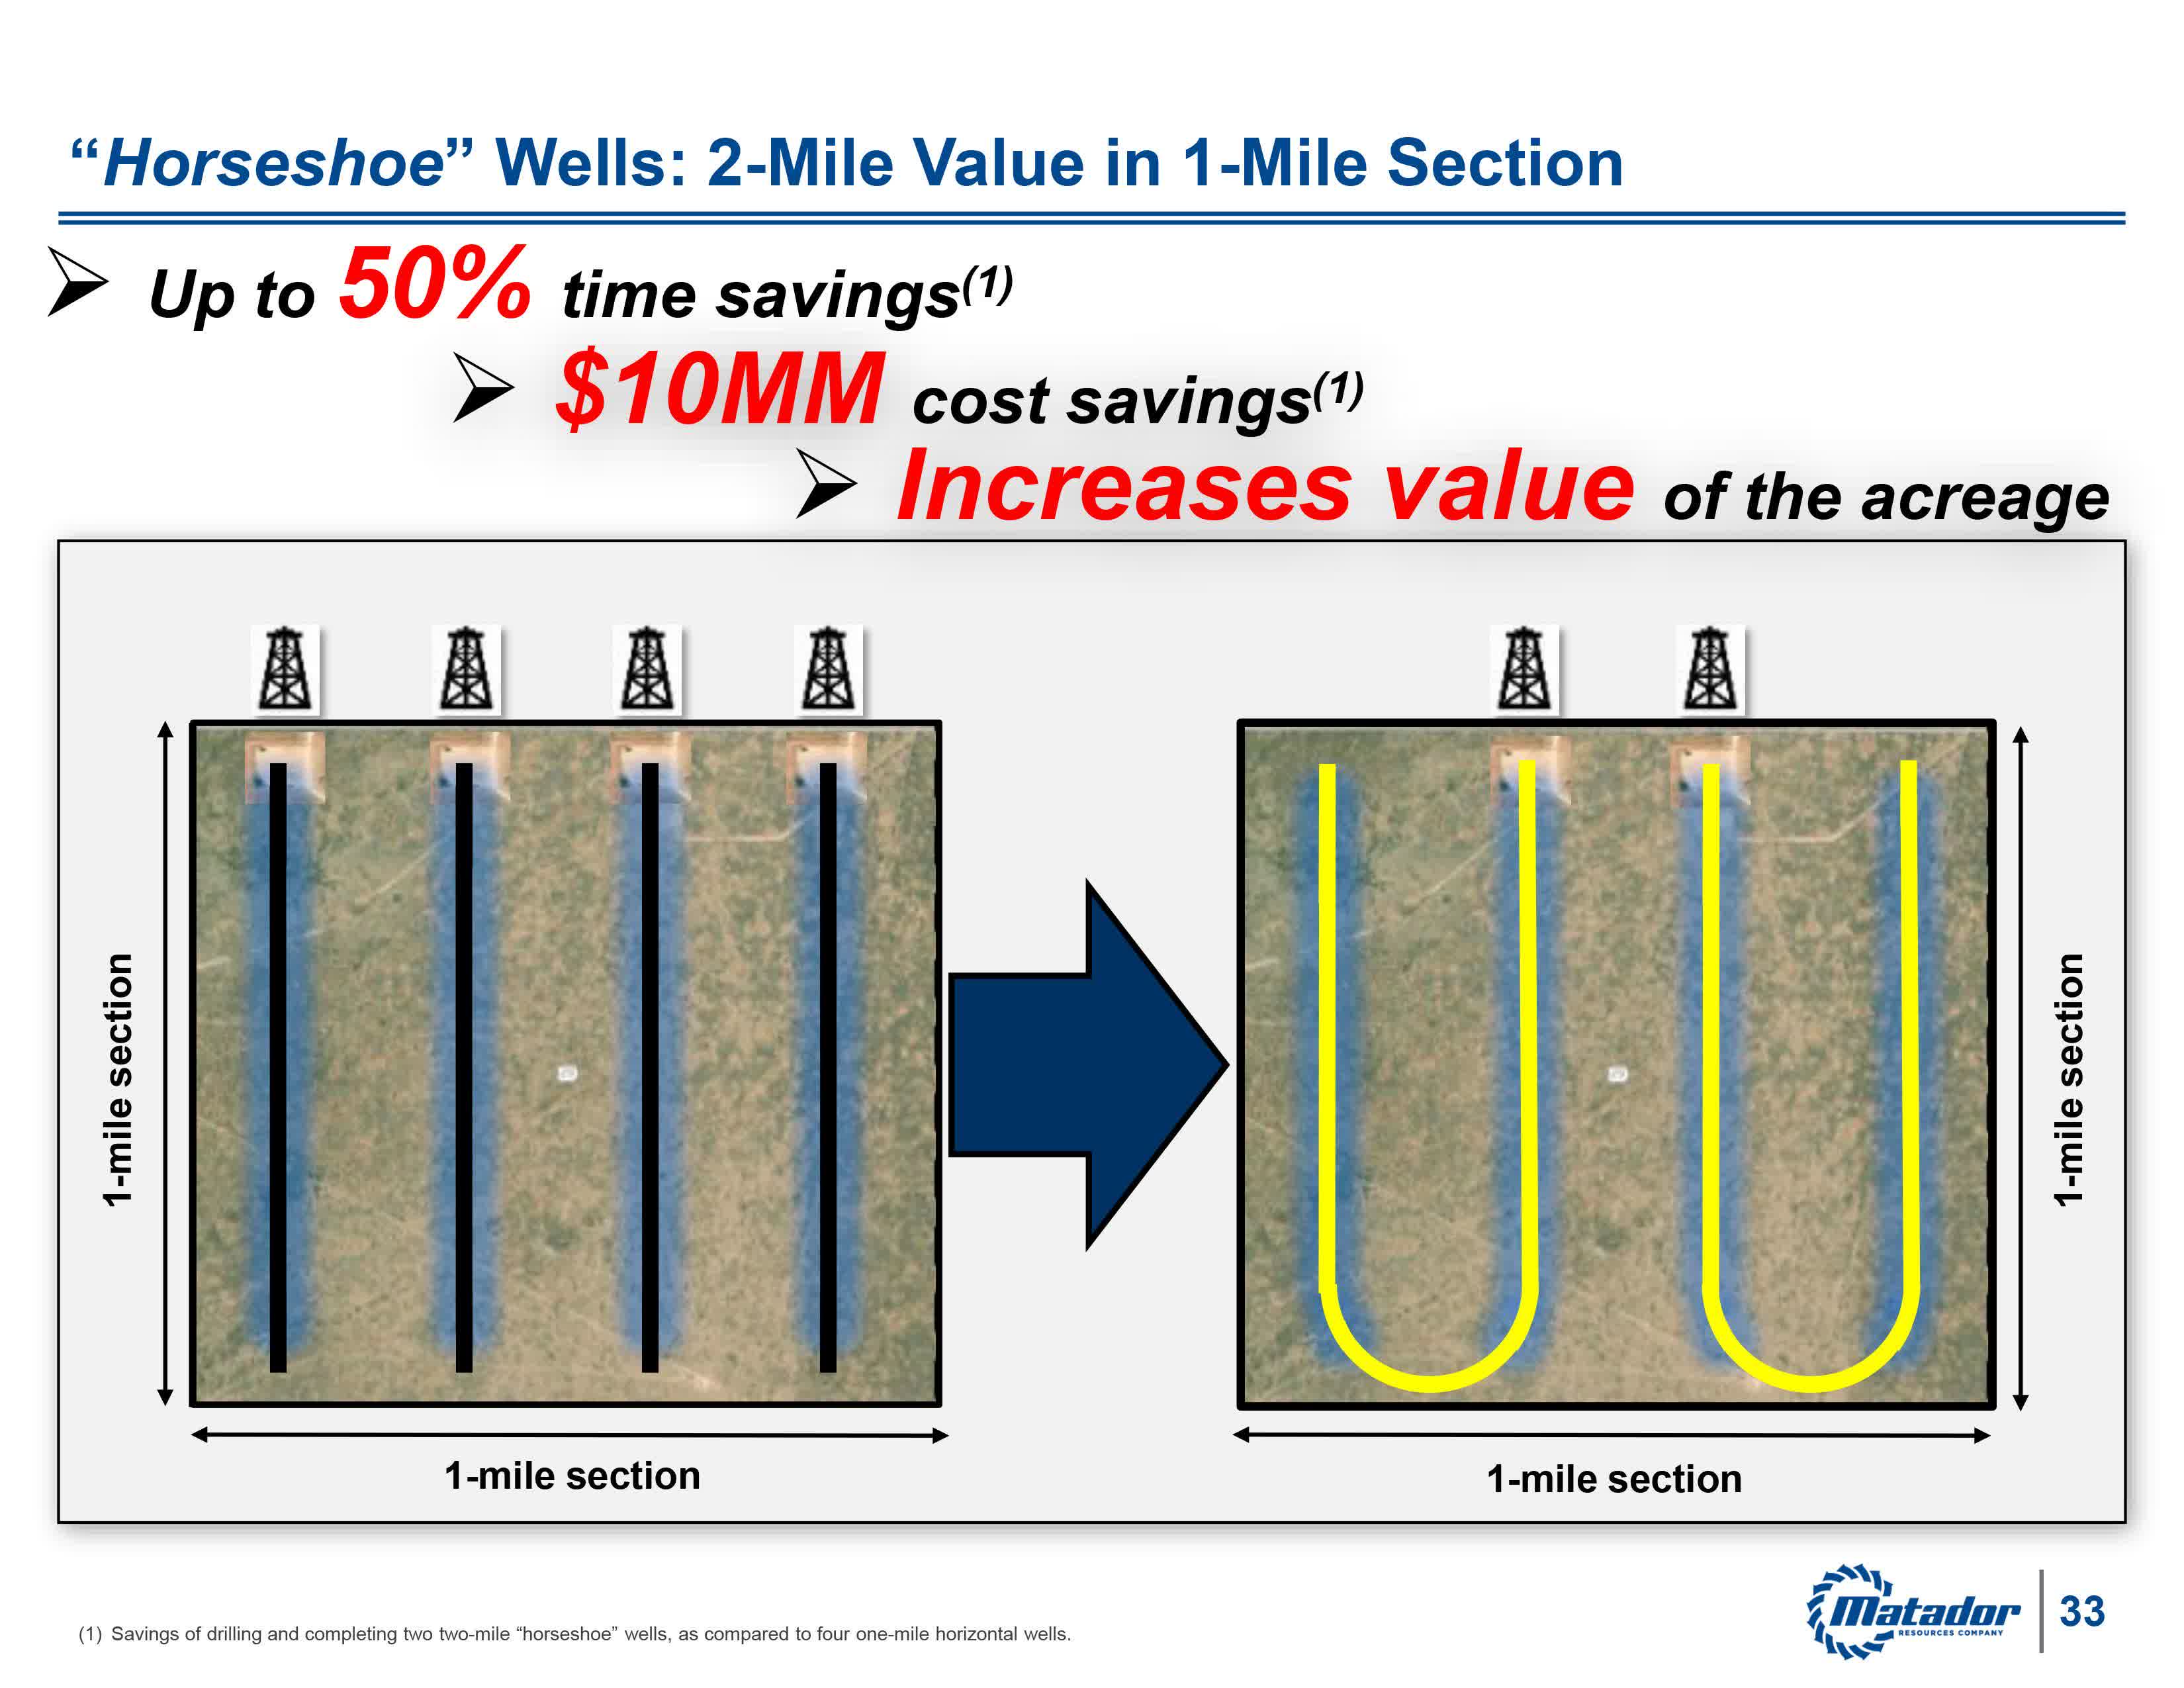
A second example is what the company calls “Horseshoe” wells. Here’s a useful illustration from management’s presentation at the annual shareholder’s meeting on June 9.
An Illustration of Horseshoe Well Design (MTDR Annual Shareholder Presentation)
Basically, a shale well usually involves drilling a vertical segment down to the productive reservoir rock and then sideways through the reservoir. On a square mile section of acreage, instead of drilling four horizontal wells, MTDR has been experimenting with drilling two U-shaped (horseshoe shaped) wells.
This saves time and money. For example, when you drill a horizontal well you might drill vertically down and then drill a 1 mile+ long lateral section. By cutting from four wells to two wells, you reduce the number of vertical sections of well by one-half, which saves on the cost of steel pipe.
This is nothing totally new – other operators have used horseshoe wells – and it can’t be used across all MTDR’s acreage; however, the company estimates $10 million in cost savings from drilling two U-shaped wells compared to four one-mile-long horizontal wells.
These incremental efficiencies and improvements to well design are crucial as they reduce costs, improving capital efficiency. In short, they reduce the numbers in the expense section of my cash flow models and decrease the commodity prices needed for a company like MTDR to produce free cash flow.
On top of this, keep in mind the company’s capital and expense guidance assumed 10% to 20% industry-wide cost inflation. That was the norm last year as high commodity prices boosted demand for drilling, fracturing and other services related to drilling and completing wells. Service operators like Halliburton ( HAL ) increased the prices they charged accordingly.
MTDR indicates that this service cost inflation continued in Q1, but it was able to perform better than expected through "self-help" in the form of the efficiency improvements I just outlined.
A broader decline in cost inflation is a second potential tailwind this year. As I outlined earlier, we have seen a continued decline in drilling activity since Q1 2023 and that’s starting to result in some reports of reduced service cost inflation across the industry. Certainly, some costs, such as the price of diesel fuel have moderated from last year’s highs.
Bottom line: When you couple efficiency improvements with the potential for service cost inflation nearer the low end of MTDR’s +10% to +20% 2023 guidance, I believe MTDR is likely to see costs below the midpoint of their guidance range for the year as a whole.
So, let’s turn to the production side of the equation. MTDR beat their Q1 2023 production guidance by about 6% and guided Q2 production growth estimates higher; however, as I mentioned earlier, they didn’t change their full-year 2023 guidance.
This was the subject of a lot of discussion on the call.
CFO Brian Willey had this to say about MTDR’s production growth this year:
This is Brian Willey, Chief Financial Officer and President, and I'm happy to answer your question, and thanks for joining the call today. We are really excited about the Advance assets. So, very strategic, great assets, perfect fit into our existing assets. And so we're thrilled about them, and they have produced better, I think in the first quarter than we expected. As a reminder, we don't get credit for that production yet, because we didn't own the assets. But we are excited and encouraged by the fact that they produced better than we thought.
And so, we've had, I guess, keys to the car now for a couple of weeks, and so still early on as we drive the car here. But we are excited about it. I think, in fact, we can -- I can turn to Chris in a minute, but I think our completions group started yesterday. We switched out their completions group to ours, and we're starting to complete the wells. And the 21 wells you mentioned, we do expect kind of the second half of the year, those will come on. Kind of in that third or fourth quarter, as you said. And then, as we look to next year. We have 49 total wells that are going to be in progress at the end of the year. 21 of those are going to be the wells that we're currently drilling on the Advance acreage and will be completing later this year. So, we expect those to come on early next year. At the end of the year, we're going to end up with 143,000 or so on a run rate. And that's a great run rate as we kind of go into next year, and those 49 wells in progress will just add to that, including the 21 wells that are at Advance.
So, we're really excited about 2024. If you look at just comparing 2022 to fourth quarter, to 2023 to fourth quarter, on a true just BO basis, so an oil-only basis, that's a 40% growth is what we expect. And so, that sets us up really well for a great 2024, both on a BO basis, on an oil basis, and then just also on a total BOE basis.
Source: MTDR Q1 2023 Earnings Call Transcript
Simply put, the CFO noted the company had only owned the Advance acreage for about two weeks at the time of their call and they were early in integrating the company’s operations. In particular, at the time of the April call, the company was completing a huge package of 21 Advance wells; management noted that MTDR has never completed more than 13 to 15 wells at a time.
These wells are due to start producing oil in Q3 or Q4 of this year. The exact timing was still a bit uncertain and that alone can have a significant impact to their annual guidance; after all, if a well comes online in late October rather than late September, that’s about 30 days less production included in 2023 totals.
On top of that, the company is drilling an additional 21 well package that's supposed to come online by early 2024; however, once again, the timing of those completions is crucial. If some of those wells go into production in December instead of January, that can also have a significant impact on the company’s 2023 production totals.
In short, it appears management was being conservative by not boosting guidance, especially given the fact they’d just finalized the Advance acquisition. In fact, that’s standard practice for MTDR as the company has consistently exceeded their previously published quarterly production guidance over the past two years.
A second question regarding the company’s guidance received an even more direct response later on in the call:
Hey, Neal, it is Glenn Stetson, EVP of Production. Yeah, thanks for the question. So, Brian mentioned it, but we've been at the helm, so to speak, or in the driver's seat for a couple of weeks. So, give us a little time, and I think we'll have a nice update for you in July. But we're encouraged so far, both by the existing production and how those wells were doing the day we took over, and that all went really smoothly.
Source: MTDR Q1 2023 Conference Call Transcript
Simply put, MTDR strongly hints they plan to update their guidance during their Q2 2023 earnings release and conference call scheduled for July 26.
I see this as a significant potential upside catalyst for the stock in the near-term as even a modest change to CAPEX and production guidance could have a significant impact on the company’s near-to-intermediate term free cash flow outlook.
Adjusting the 2023 Model
Granted, none of this is concrete and there are no certainties in financial markets.
However, in my experience management teams sometimes try to provide more subtle guidance during conference calls that can help analysts adjust their estimates. The comments I’ve just outlined suggest that’s the case here.
So, let’s take a second look at that 2023 cash flow model with some adjusted estimates:
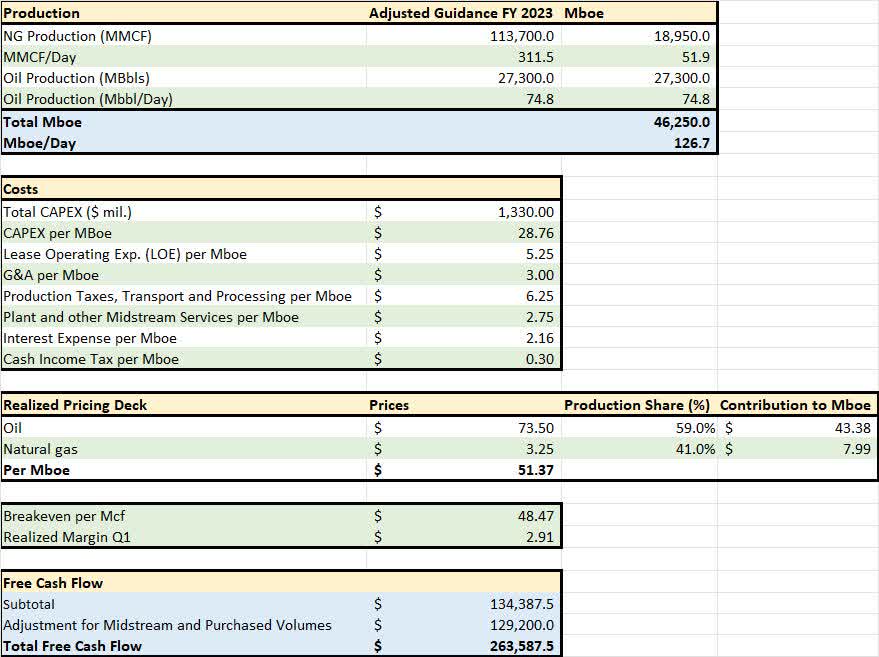
MTDR Adjusted 2023 Free Cash Flow Model (MTDR Q1 2023 Guidance, Author's Estimates)
This is the same model I presented earlier except I’ve increased the production guidance from the midpoint of management’s range to the high end. In addition, I reduced the CAPEX and LOE estimates to the low end of prior guidance; note this still assumes 10% overall service cost inflation for 2023.
The bottom line is this modest adjustment coupled with the same commodity price estimates nearly doubles the rough cash flow estimate to $265 million for 2023.
Even more impressive is the implication for 2024 and beyond.
A Look Ahead
During the Q1 2023 call, management also declined to offer specific growth guidance for 2024 production (next year) though they were asked, in one way or another, by two different analysts on the call.
However, they did offer a bit of commentary around the outlook.
First up, MTDR expects the exit rate of production in Q4 2023 to be 143,000 Boe/day. Even if MTDR just holds production at that Q4 2023 exit rate that annualizes to about 52.2 million barrels of oil equivalent in 2024 compared to the midpoint of their 2023 guidance at 45.3 million Boe in 2023, a year-over-year growth in production of 15.2% for next year.
Second, management indicated it hopes to be able to do more than just hold production constant next year at that 2023 exit rate. Further, when you consider MTDR already has a massive 21 well package due to come online by early 2024 as I explained earlier, it seems production momentum, at least early in the year, would be strong.
So, let’s run the model for 2024, plugging in some rough estimates based on MTDR's 2023 production exit rate:
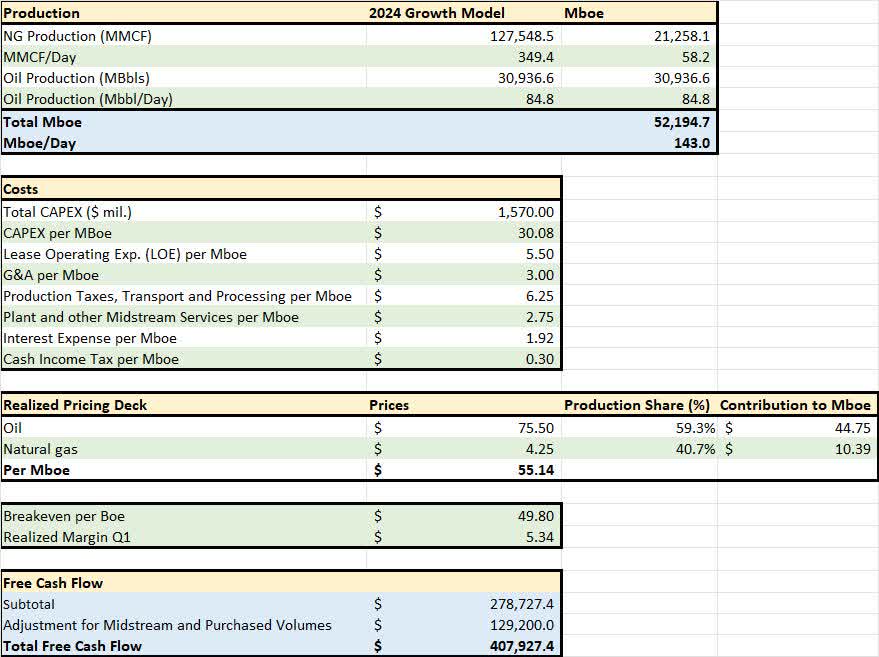
MTDR Free Cash Flow Model for 2024 (MTDR Q1 2023 Guidance, Author's Estimates)
As you can see, for the production estimates in the top section I’m just assuming MTDR is able to keep its production constant at the Q4 2023 exit rate, which seems conservative based on management’s commentary.
I also boosted the CAPEX estimate for 2024 by 10% from this year’s midpoint to $1.570 billion, which keeps the CAPEX per Boe around $30 per barrel all-in.
For realized prices, the 2024 natural gas calendar strip – the average price of gas futures for delivery every month of next year – is $3.50 and I’m applying the same $0.75 price premium (due to NGLs content) used this year pushing the realized price to $4.25/mcf.
For oil, I just penciled in the recent closing price less $1/bbl. A deep dive into the commodity outlook is a bit beyond the scope of this article, though I recently outlined some of my thoughts in a piece here on Seeking Alpha titled “ Oil’s Recession Warning .”
To summarize, oil prices are well off their 2022 highs mainly due to fears of a potential demand-chilling global economic downturn. However, per International Energy Agency (IEA) estimates, Saudi Arabia needs Brent oil prices north of $80/bbl just to balance its budget and the country has been cutting output to prop up prices. Longer term, I believe oil will need to trade around $90/bbl to incentivize adequate supply to meet demand in a normal economic environment.
Since WTI has generally traded at a roughly $5/bbl discount to Brent, that works out to a long-term oil price estimate of $85+/bbl. I think that’s conservative and, of course, the $75.50/bbl estimate I’ve plugged into my model for next year is even more conservative.
The bottom line is that using these assumptions, MTDR could easily be expected to produce over $400 million in free cash flow for 2024 as I illustrate in the table above.
The potential upside for cash flows over the longer term is even more impressive. If we use these same assumptions except raise our oil price assumption for 2024 from $75.50 to $85/bbl, free cash flow implied by this model jumps to more than $700 million. And if we assume production growth of 20% in 2024 year-over-year relative to this, a slight bump from assuming flat production at the Q4 2023 average level, free cash flow climbs to $800+ million.
It’s also important to understand that MTDR’s CAPEX is high relative to many of its peers on a $/boe basis.
For example, Devon Energy has significant operations in the Delaware Basin of the Permian and in Q1 2023, the company reported it spent $572 million in CAPEX attributed to this region alone. In the same quarter, DVN produced 415 MBoe/day from its Delaware Basin Acreage. That works out to about $15.30 per boe in CAPEX compared to more than $30/boe for MTDR in my model above.
There are multiple reasons for that. One is that there’s an old rule of thumb in the business that it’s easier (and cheaper) to grow natural gas production than oil production and DVN’s oil cut in Q1 2023 was a little over 50% compared to 59% oil for MTDR this year.
In addition, DVN’s CAPEX estimate for Q1 doesn’t include any midstream spending whereas MTDR’s does. However, even if I strip out all planned midstream CAPEX from MTDR’s guidance this year, the midpoint of the company’s upstream CAPEX at $1.25 billion works out to $27.60 per Boe, still well above DVN.
I believe the most important explanation relates to how I started this article – production growth.
Simply put, some producers like Pioneer Natural Resources publish an estimate called maintenance CAPEX, which basically represents the amount of CAPEX needed to hold production roughly constant. If a company needs to cut CAPEX below that maintenance level, they can preserve cash flow at the expense of falling oil and gas production.
At the same time, if a producer wishes to grow output to take advantage of higher commodity prices, they’ll need to drill more wells on their acreage, which implies a higher CAPEX and, most likely, a rise in CAPEX/Boe as well.
So, DVN is growing production this year, but at a slow pace while MTDR is one of the fastest-growing producers in my coverage universe and it’s spending significant additional sums to develop newly acquired acreage. MTDR is spending well above maintenance CAPEX while DVN is spending at a level closer to maintenance CAPEX.
Near term, MTDR’s production growth potential is high and, as I just explained, momentum is likely to carry through next year. But, I suspect, at some point beyond next year, once the Advance acreage is more fully digested, management will transition from rapid growth to a more modest pace of development.
That will mean slower growth in production, but it would also likely entail an improvement in capital efficiency in the form of a drop in the company’s currently elevated CAPEX per Boe metric.
DVN is one of the more capital efficient companies out there and its acreage in the Delaware is particularly prolific in terms of natgas output, so I’m under no illusion MTDR’s capital efficiency could improve to that degree. However, the move from 15%+ production growth to a more modest pace of development could certainly be expected to reduce drilling and completion (D&C) CAPEX/Boe from $27.60 to the low $20’s per BOE.
Even an upstream CAPEX/Boe in the $22.50/BOE range would be significantly worse than DVN, but it would have a significant impact on cash flow generation for MTDR.
Take a look:
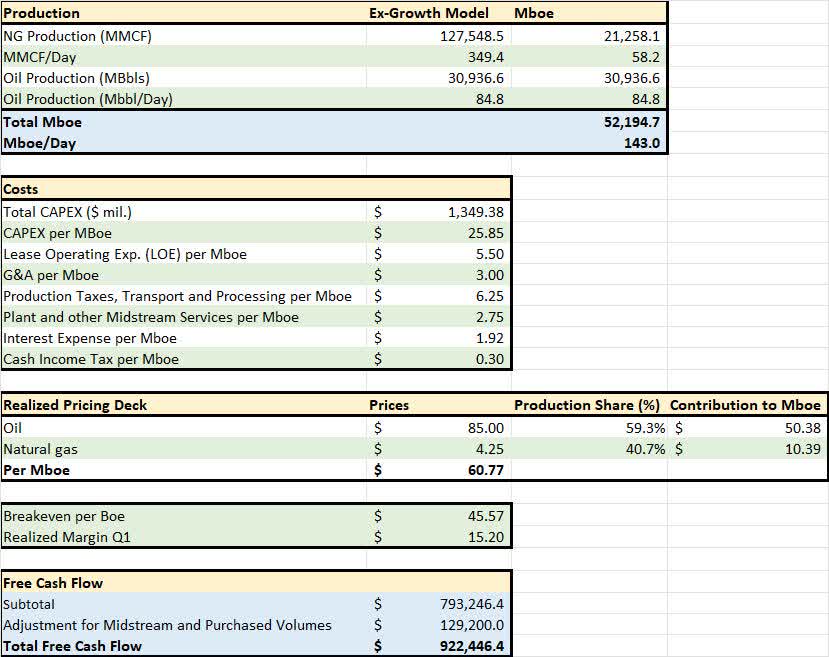
Long term ex-Growth Model for MTDR (MTDR Q1 2023 Guidance, Author's Estimates)
To create this model, I held production constant at the 2023 exit rate of 143,000 Boe/Day and penciled in long-term realized oil prices of $85/bbl and gas at $4.25/Mcf. However, I reduced the upstream portion of MTDR’s CAPEX to $22.50/boe, more in line with what could be expected should MTDR seek to simply maintain production beyond 2024 or grow at a more modest pace.
I’ve maintained $175 million in midstream CAPEX, which is in line with what MTDR expects to spend this year.
As you can see, this simple adjustment to capital efficiency boosts free cash flow to over $900 million per year. While that would be a dramatic improvement, it’s not out of line with Wall Street consensus, which sees free cash flow for MTDR climbing to an average estimate of $880 million by 2026 and more than $1 billion by 2027.
Target and Risks
Of course, deriving a fundamental target price is an exercise fraught with assumptions and pitfalls, but let’s consider the potential upside in the stock based on a simple discounted cash flow analysis.
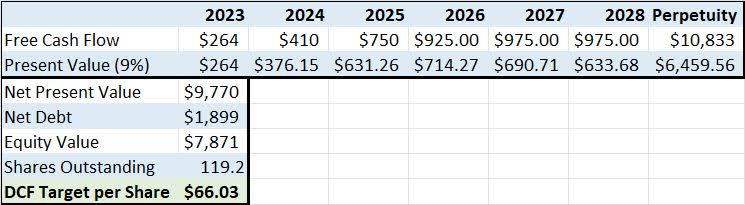
To create this estimate I used a weighted average cost of capital ((WACC)) of 9%, which is derived from a Bloomberg model that includes the actual cost of MTDR’s debt as well as an estimated equity cost based on MTDR’s stock price volatility relative to the market as a whole.
I used the above-derived estimates for MTDR’s cash flows for 2023 and 2024. Starting in 2025 I assume MTDR transitions to an ex-Growth strategy, benefiting from better capital efficiency and stable production. This increases my estimate of FCF to the above derived $925 million per year by 2026.
I then used the average of my 2026 cash flow estimate of $925 and the Wall Street consensus for 2027 to estimate long term cash flows at $975 million from 2027 and beyond. Based on current net debt of just under $1.9 billion, this produces an equity value of over $66 per share for MTDR, almost 27% above the current price.
If I simply use my 2026 ex-growth estimate of $925 million per year starting in 2027, the estimated DCF is still close to $63, a premium of 20% to the current quote.
Of course, there are downside (and upside) risks to this estimate.
The most obvious is commodity pricing. I’ve used a roughly $73.50/bbl estimate for oil and $3.25 for gas in 2023, rising to $75.50/bbl and $4.25/mcf in 2024 and $85/bbl and $4.25/mcf thereafter. If there’s a significant global economic downturn in 2023 or early 2024 that hits oil demand, it’s plausible that oil prices could drop back into the low $70’s/bbl and MTDR’s gas price realizations could drop back towards $3/mcf even with the NGLs uplift.
Since MTDR has minimal hedges in place, near term cash flow estimates are sensitive to assumed oil and gas realized pricing.
I also think there are upside risks to these estimates, particularly over the longer term. As I outlined, the International Energy Agency (IEA) estimates Saudi Arabia needs Brent oil prices north of $80/bbl to balance its budget.
So, $85 WTI as a long-term oil price assumption might prove too low – for years leading up to the 2014 price collapse, prices averaged in the $90 to $100/bbl range.
On the natural gas front, the 2025 Henry Hub calendar strip price is actually above $4/MMBtu right now as significant US liquefied natural gas ((LNG)) export capacity is slated to come online towards the end of 2025, boosting demand and prices. MTDR typically earns a $0.75 price premium to Henry Hub gas, so my long-term natgas assumption at $4.25 may be on the conservative side.
The bigger risks are near-term in nature.
In particular, the company is slated to report Q2 2023 earnings on July 2 6 and, based on weak oil and gas pricing in Q2 2023 coupled with MTDR’s elevated CAPEX spending as it integrates Advance acreage, it’s likely Q2 2023 free cash flow will be negative. While free cash flow was positive in Q1 2023 and is likely to rebound later in the year as new wells are completed and production rises, Q2 2023 cash flow won’t look encouraging in isolation and it’s possible that could spook some investors.
I believe the danger is manageable because the consensus on Wall Street is already looking for negative free cash flow in Q2, but it remains a headline risk.
Indeed in my view, Q2 2023 is likely to represent a bigger upside surprise and catalyst for MTDR shares. That’s because, as I outlined, management has strongly hinted it would provide a more substantive update to its production guidance on this call.
I suspect, based on Q1 2023 well performance and management commentary on the call back in April, that will mean a significant boost to the midpoint of expected production guidance and, perhaps, an early look at potential growth we might expect for next year.
Further, I also believe the company could adjust its 2023 CAPEX and cost guidance as it seems the combination of efficiency gains and falling service cost inflation might push costs below its prior guidance range.
MTDR shares have underperformed the benchmark SPDR S&P Oil & Gas Exploration and Production ETF so far in 2023, falling 8.2% compared to a 3.6% decline in XOP. The main reasons include MTDR’s lack of hedges and commodity price risk as well as concerns about the integration of Advance and the potential for costs to be higher than expected or production growth lower than projected.
Should MTDR guide production higher and/or costs lower, it should serve as a catalyst for the stock to close that performance gap with XOP.
Finally, for energy stocks, unlike most companies, Wall Street is afraid of growth due to the negative experience of poor profitability and the growth-at-any-cost shale boom years. I must admit, having lived through those years as an energy analyst, I have a bias against growth as well.
However, in this case, I believe MTDR is being conservative. The Advance deal was a good one as acreage is contiguous with MTDR’s existing operations and the company is focused on repaying debt taken on to close the deal. Capital spending is high, but that’s to be expected given the size of the Advance deal and the scale of MTDR’s near-term growth.
Based on guidance and estimates, MTDR isn’t planning to consistently outspend cash flow over the longer term.
Bottom line: MTDR is a rare growth story in the energy patch with a credible plan to grow production near-term while generating significant free cash flow in coming years even at modest commodity price assumptions. In the near-term, I believe a likely production, CAPEX and cost guidance update on the company’s Q2 2023 call on July 26 could be a significant upside catalyst for the stock.
For further details see:
Matador Resources: Oil Growth With A Near-Term Upside Catalyst