MATX - Matson Inc.: A Cautious Hold Amidst Mixed Signals
2023-10-20 12:02:56 ET
Summary
- Matson, Inc. remains resilient in the shipping and logistics sector, but faces declines in container volume and operating revenue.
- The company's e-commerce strategy shows promise, but declining efficiency and external risks make it a cautious investment.
- Matson's financial health is on shaky ground, with declining revenues, profitability, and cash flows, raising concerns about liquidity and operational inefficiencies.
Investment Thesis
Matson Inc. ( MATX ), with its diversified services and regional stronghold, particularly in China, remains a resilient player in the shipping and logistics sector. However, the company's year-over-year declines in container volume across key markets, notably a 24.6% drop in China, along with a steep 38.7% fall in total operating revenue, cast shadows over its operational prowess. Moreover, the company's liquidity ratios, with a current ratio of 1.05x and a quick ratio of 0.74x, are concerns, while its moderate debt-to-equity ratio of 34.5% offers some solace. On the positive side, Matson's e-commerce strategy seems promising, given the 8% YoY growth in the sector. The company's established brand value in China over 13 years also serves as a growth catalyst. Despite the opportunity to capitalize on e-commerce, the declining efficiency marked by an 80.4% fall in operating income and external geopolitical risks make it a cautious play.
Even though Matson has seen an upward trend in both revenue and EPS estimates for Q3 2023, with a low revenue estimate of $780.2 million and a high of $808.71 million, and EPS ranging from $2.56 to $2.76, these are short-term indicators and don't negate the long-term challenges it faces. On valuation, while the LTM EBITDA multiple suggests a stock price range of $104.73 to $117.50, offering up to 31.7% upside, the projected EBITDA paints a less rosy picture, suggesting a price range of $69.88 to $78.99, a downside of up to 21.7%. A blended valuation suggests the stock is currently fairly valued but with limited upside potential.
Given these mixed signals, a conservative, long-term investor would be best advised to hold the stock, carefully watching the company's next moves to address these operational and financial challenges.
Overview
Matson's year-over-year container volume has decreased in all its key markets : 7.1% in Hawaii, 24.6% in China, 7.5% in Guam, and 7.2% in Alaska, signaling reduced business activity. Starting with Ocean Transportation, Matson's Hawaii division experienced a 7.1% drop in business. This decline came despite a strong local economy marked by low unemployment and robust tourism. Similar downturns were noted in Guam and Alaska, where business decreased by 7.5% and 7.2%, respectively, due to factors like lower general demand and reduced seafood exports. The company's sizeable 24.6% volume decrease in China is concerning as it could imply lost market share and reduced demand. This was attributed to a range of issues such as the discontinuation of the CCX service, scheduled ship maintenance, and fewer trips overall. The company lost $1.4 million in a joint venture with SSAT, because of lower fees and less activity. Despite these setbacks, Matson managed to charge above-average rates in these regions, thanks to its reputation for quality and reliability.
In the Logistics segment, Matson generated an operating income of $14.3 million, which was $8.8 million lower than the previous year. This dip was primarily because of reduced earnings from supply chain management services. The company's consolidated operating income declined to $96.7 million-a $396.4 million drop compared to the previous year. On the positive side, Matson reduced its total debt and generated $827.3 million in cash flow from its operations.
In terms of market conditions, e-commerce has grown 8% year-over-year in the first quarter and is expected to outpace total U.S. retail sales, a trend that Matson is capitalizing on. The company expects this trend to be a significant driver for its China service. Further, the company has built brand value over 13 years in China and expects the Chinese market to be a significant demand driver. Additionally, Matson plans to continue charging above-average freight rates and expects to benefit from lower taxes in the next quarter, which remained relatively stable at 22.5% due to specific deductions they can claim. While there are challenges, the company's future appears stable due to business opportunities like capitalizing on the growing e-commerce market, providing specialized supply chain management services, and potential expansion in Alaska, given the rise in oil prices.
To sum it up, Matson's resilience stems from its diversified services and regional operations, cushioning it against downturns in any specific area. Key growth catalysts for Matson include thriving local economies characterized by low unemployment and strong tourism, particularly in Hawaii, Guam, and Alaska. The company is also strategically positioned to tap into the escalating demand in e-commerce. However, it must remain vigilant about external challenges like geopolitical tensions affecting Transpacific routes and rapidly evolving consumer preferences in an ultra-competitive digital environment. To stay ahead, strategic investments in technology and possibly even acquisitions could be necessary. While the road ahead is fraught with challenges, Matson has laid a strong foundation for future growth, provided it leverages its strengths and opportunities wisely.
Revenue Analysis
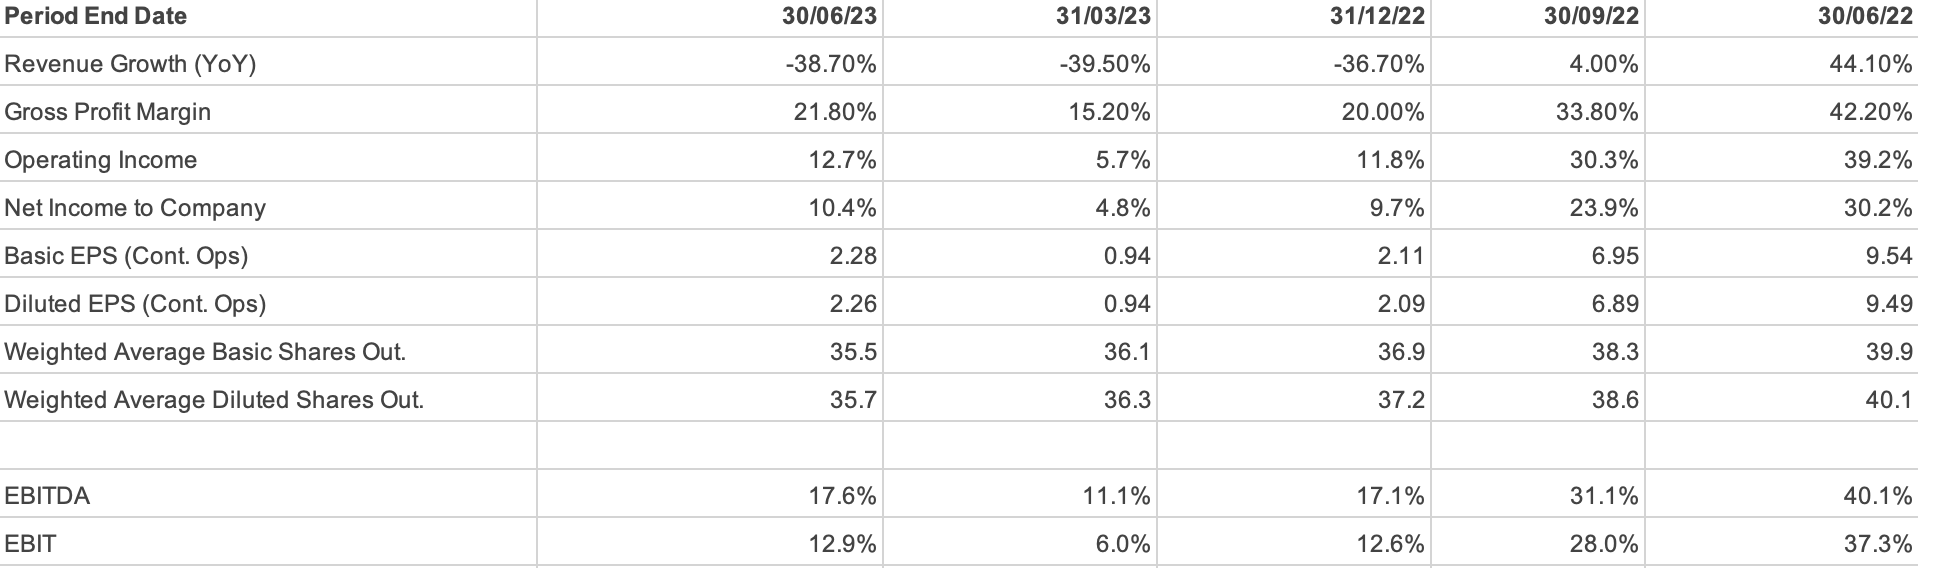
The revenue streams are heavily skewed. About 80% of the revenue comes from the Ocean Transportation segment, which generated $616.9M in Q2 2023, a significant drop of 41.2% from $1,049.2 million in Q2 2022. The Logistics sector declined by 26.2% from $211.9 million in Q2 2022 to $156.5 million in Q2 2023. Altogether, the total operating revenue has plummeted by 38.7%, from $1,261.1 million to $773.4 million, in one year. Given the 41.2% decline in revenue in the Ocean Transportation sector and a 26.2% drop in the Logistics sector-two areas that together contribute to over 80% of the company's total revenue-there is clear evidence that the company has weaknesses in its operations. If these sectors continue to underperform, the company's overall revenue could be further compromised.
On the expense side, operating costs have decreased by 17%, from $728.4 million in Q2 2022 to $604.7 million in Q2 2023. While reducing costs might generally be a positive sign, in this context, where revenue is also declining, it's a small relief. More concerning is the increase in Selling, General & Administrative (SG&A) expenses, which went up by 9.8%, from $64.3 million to $70.6 million. This increase in SG&A indicates that the company is becoming less efficient at a time when it can least afford to be.
The declining efficiency is further corroborated by the decline in operating income, which plunged by 80.4%, from $493.1 million in Q2 2022 to just $96.7 million in Q2 2023. Net income followed suit, dropping by 78.8% from $380.7 million to $80.8 million. This downward trajectory in both income metrics raises questions about the quality of earnings in my view.
The operating revenue experienced a 38.7% decline, going from $1,261.1 million in Q2 2022 to $773.4 million in Q2 2023. Looking forward, If this decline rate continues, applying the same 38.7% reduction to the Q2 2023 revenue yields an estimated Q2 2024 operating revenue of approximately $473.4 million. Similarly, the net income fell sharply by 78.8%, dropping from $380.7 million in Q2 2022 to $80.8 million in Q2 2023. Using the same 78.8% decline rate for projection, the expected net income for Q2 2024 would be around $17.1 million.
The Ocean Transportation sector, despite its significant revenue drop, remains the company's main value driver. But its declining revenue is an immediate concern, making the Operating Income, which has contracted by 80.4%, the key metric that needs attention.
In summary, Maston Inc. has red flags waving, from declining revenue and profitability to increasing SG&A costs, pointing to operational inefficiencies and vulnerabilities. The lack of diversification in revenue streams further escalates the risks, making the company prone to sectoral shocks.
Balance Sheet Analysis
The current ratio of 1.05x implies that the company can just barely meet its short-term liabilities with its short-term assets. This is a clear sign that liquidity, or the ability to quickly convert assets into cash, could be an issue down the line. The quick ratio, which excludes less liquid assets like inventories from the equation, is at 0.74x. This suggests that the company might find it challenging to pay off its current liabilities quickly, which is a red flag.
The debt-to-equity ratio stands at 34.5%. This indicates that the company is not overly dependent on debt to run its operations. Correspondingly, the interest coverage ratio is 34x. This shows that the company can easily cover its interest payment and from a long-term solvency perspective, the company is in a relatively safe zone.
The net profit margin is 10.44%. The margin is low by industry standards, signaling poor profitability. In terms of trend analysis, the total assets have shrunk from $4,330.0 million to $4,218.1 million, hinting at a negative trend. This trend is consistent with the decline in revenues and net income, thereby painting a worrying picture of the company's health.
When we look at capital expenditures (CapEx), we see that investment in property and equipment has increased from $1,962.5 million to $2,029.0 million. This increment of $66.5 million suggests that the company is still looking to invest in growth, albeit cautiously. On the efficiency front, the operating margin at 12.51% indicates moderate operational efficiency.
In terms of capital structure, the company has a long-term debt of $408.5 million compared to shareholders' equity of $2,290.0 million, showing a bias towards equity financing, which is generally less risky. The cash position has significantly dropped from $249.8 million to $122.0 million, raising concerns about potential cash flow issues.
In a forward-looking analysis, the company's declining total assets and liquidity ratios, coupled with a decreasing trend in revenues, point towards a cautious future. For a one-year forecast, assuming the current declining trend in total assets of 2.59% continues, the projected total assets for next year would be around $4,107.6 million. Current assets, facing a steeper decline of 23.9%, are projected to plummet to about $440 million. Adding to these concerns, the company's total assets have already decreased by $111.9 million, a 2.59% decline, while the current liabilities have lessened by $32.6 million, only a 5.6% decline. This lag in reducing liabilities compared to assets further aggravates liquidity concerns.
Overall, the company's financial health seems to be on shaky ground, with declining revenues and net income, falling total assets, and troubling cash balances. The key red flags include liquidity issues evidenced by the low current and quick ratios, and the significant decline in revenue and cash reserves.
Free Cash Flow Analysis
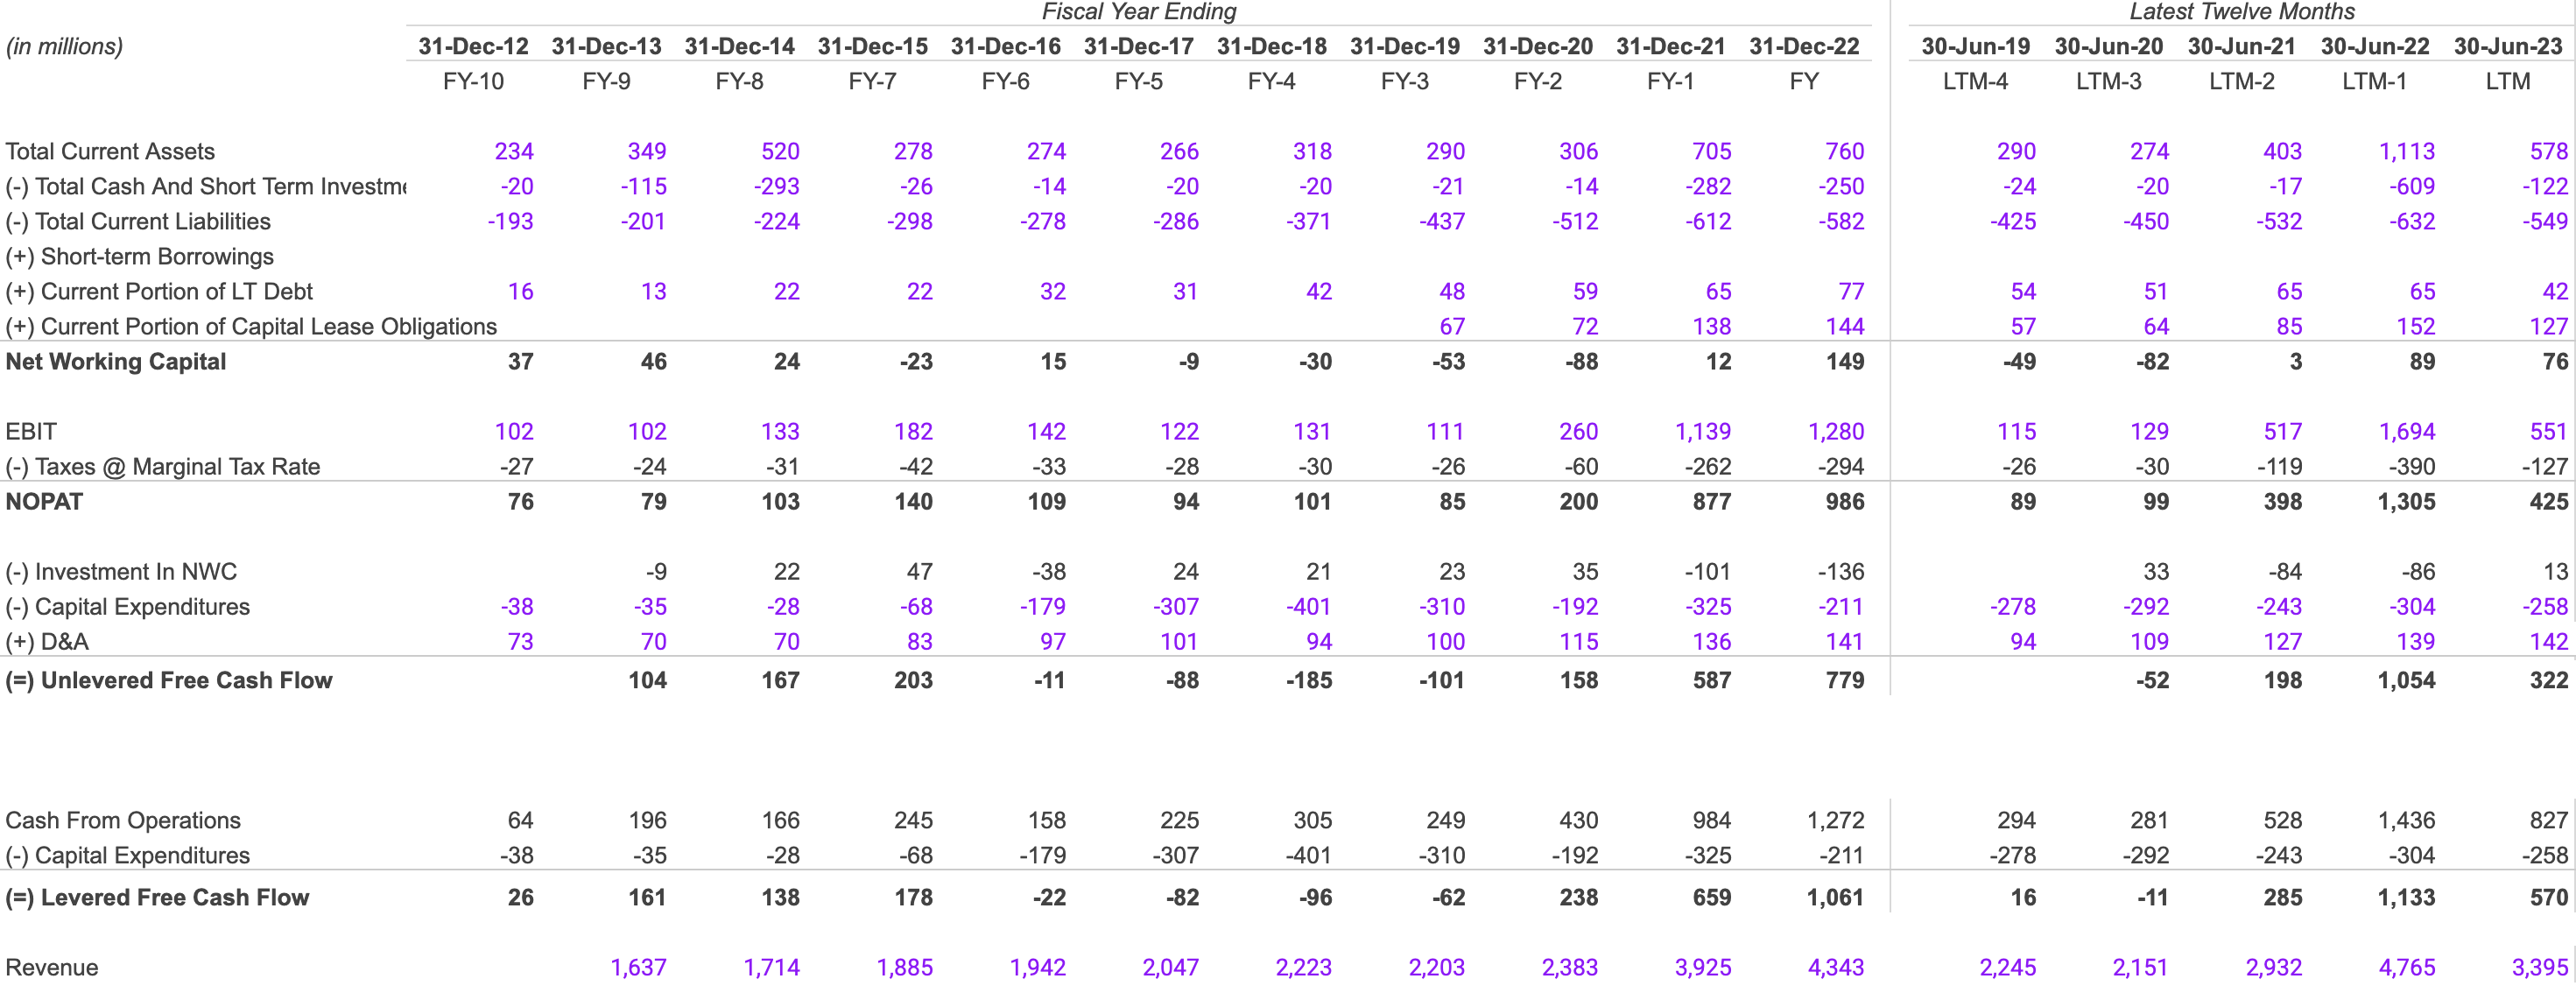
The NOPAT margin has declined from 27.3% in 2022 to just 12.5% in 2023. This almost halving is a significant red flag and suggests operational inefficiencies. Total current assets have declined by 48%, from $1,113 million in 2022 to $578 million in 2023. Concurrently, revenue has shrunk by 29%, from $4,765 million in 2022 to $3,395 million in 2023. While the capital expenditures have increased from $243 million in 2021 to $258 million in 2023, indicating some level of investment in growth, the key metric to watch is the NOPAT margin, whose decline necessitates attention.
Turning our eyes to the future, assuming a continuing decline in total assets and maintaining the same NOPAT margins, projections for 2024 are not comforting. Revenue could decline by 10% to approximately $3,056 million, and NOPAT could also decrease to around $381 million.
Working capital has improved from $3 million in 2021 to $89 million in 2022 but slightly reduced to $76 million in 2023. While the dip is not severe, it could be a precursor to tighter liquidity conditions.
Cash from operations has shown remarkable growth, increasing by 172% from $528 million in 2021 to $1,436 million in 2022, but then fell to $827 million in 2023-a decline of 42.4%. The drop in both working capital and cash from operations in 2023 could signal operational inefficiencies that must be scrutinized.
Furthermore, the unlevered free cash flow has dropped by 69% from $1,054 million in 2022 to $322 million in 2023, while the levered free cash flow has reduced from $1,133 million to $570 million in the same period. If these trends continue, we could see these numbers halve by 2024.
In summary, while the company showed promise in 2022, the financial metrics from 2023 raise multiple red flags, from liquidity to profitability and cash flows. I believe immediate action is required, particularly in improving the NOPAT margin and stabilizing cash flows.
Shareholder Yield
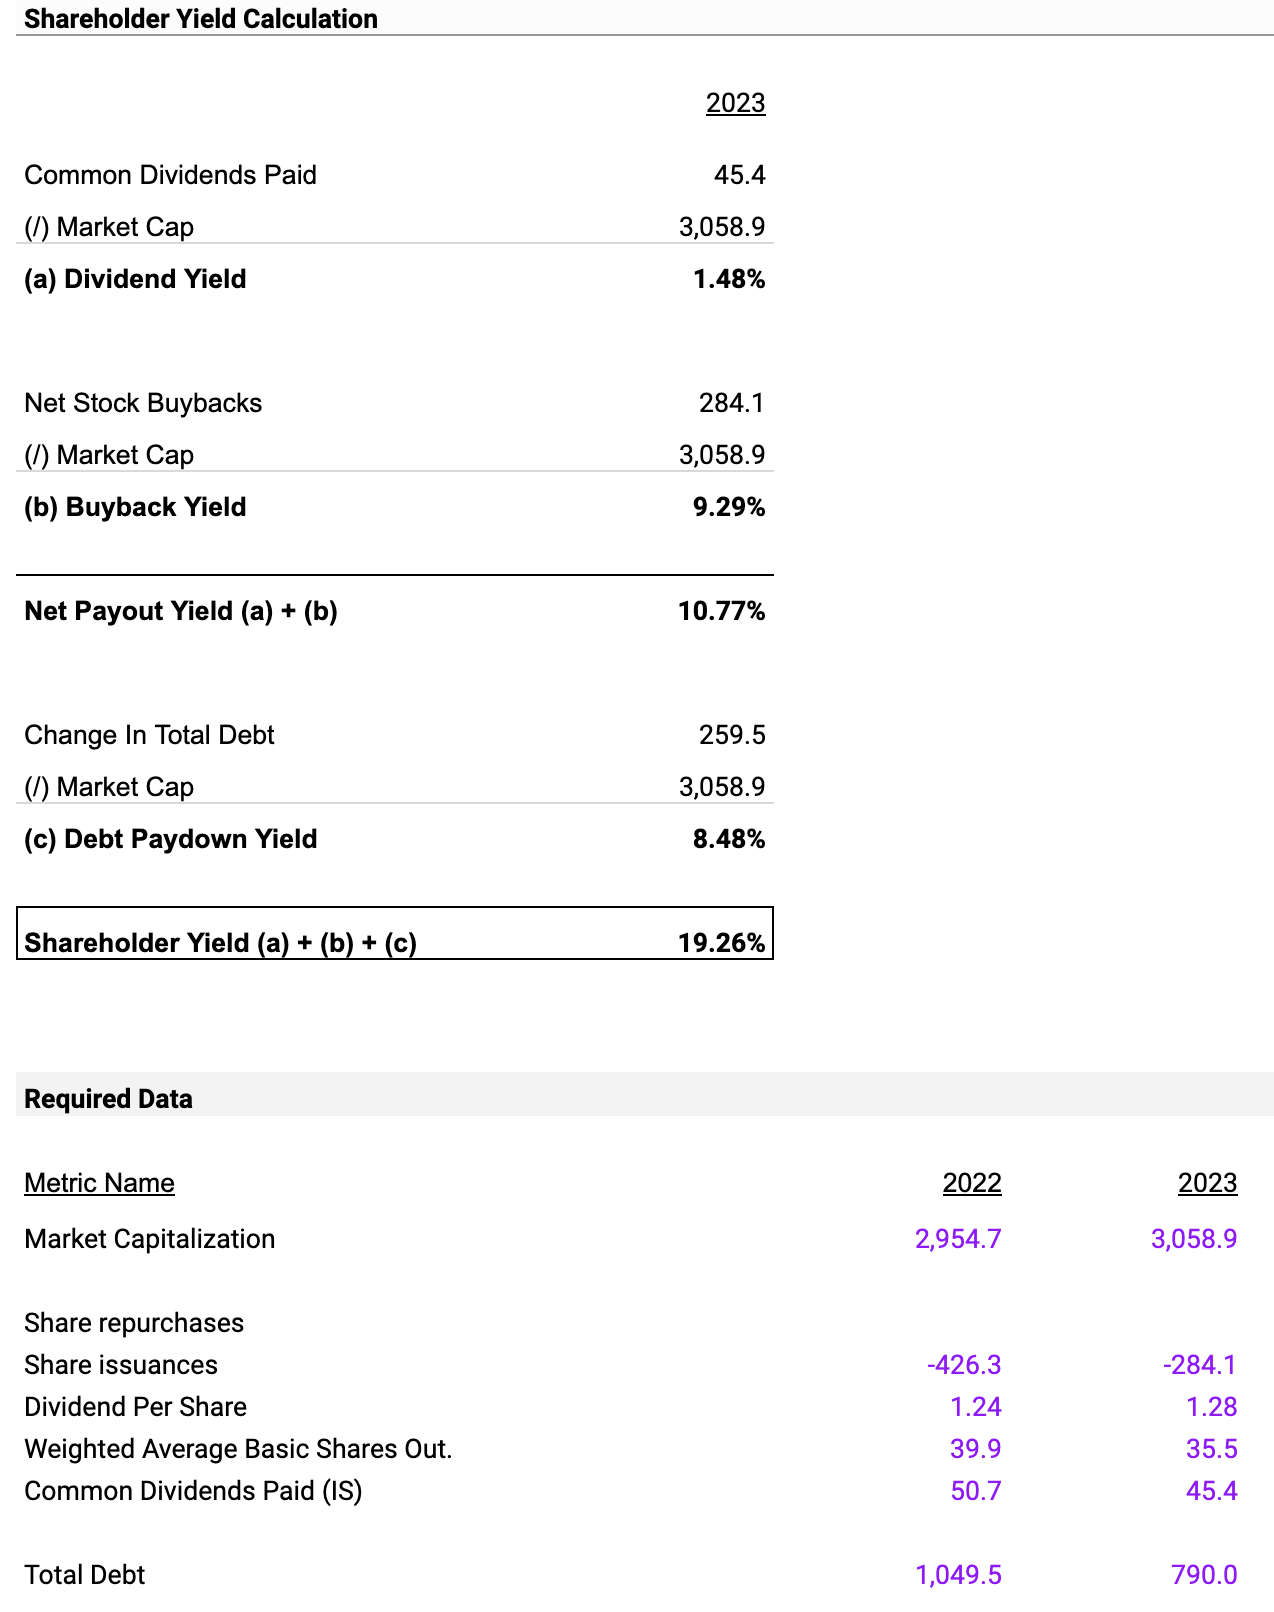
The dividend yield is 1.48%, calculated from $45.4 million in dividends against a market cap of $3058.9 million. Meanwhile, the buyback yield is significantly higher at 9.29%, derived from net stock buybacks of $284.1 million. This stark difference suggests that the company is leaning toward share repurchases rather than giving dividends. It could mean that the company lacks confidence in its long-term growth prospects and is using buybacks as a way to artificially inflate earnings per share. The Net Payout Yield is 10.77% and the overall Shareholder Yield is 19.26%. These figures suggest that the company is aggressive in returning value to shareholders, combining dividends, buybacks, and debt paydowns.
The Debt Paydown Yield is 8.48%, which means the company is focusing on reducing its debt, contributing to the overall shareholder yield. High shareholder yield is generally a positive sign for investors, but it could also be a red flag indicating that the company doesn't have better avenues for investment.
Looking ahead, if the company maintains its current dividend and buyback policies, we could expect a similar shareholder yield next year. However, this hints at limited growth opportunities.
Earnings Commentary For Next Quarter
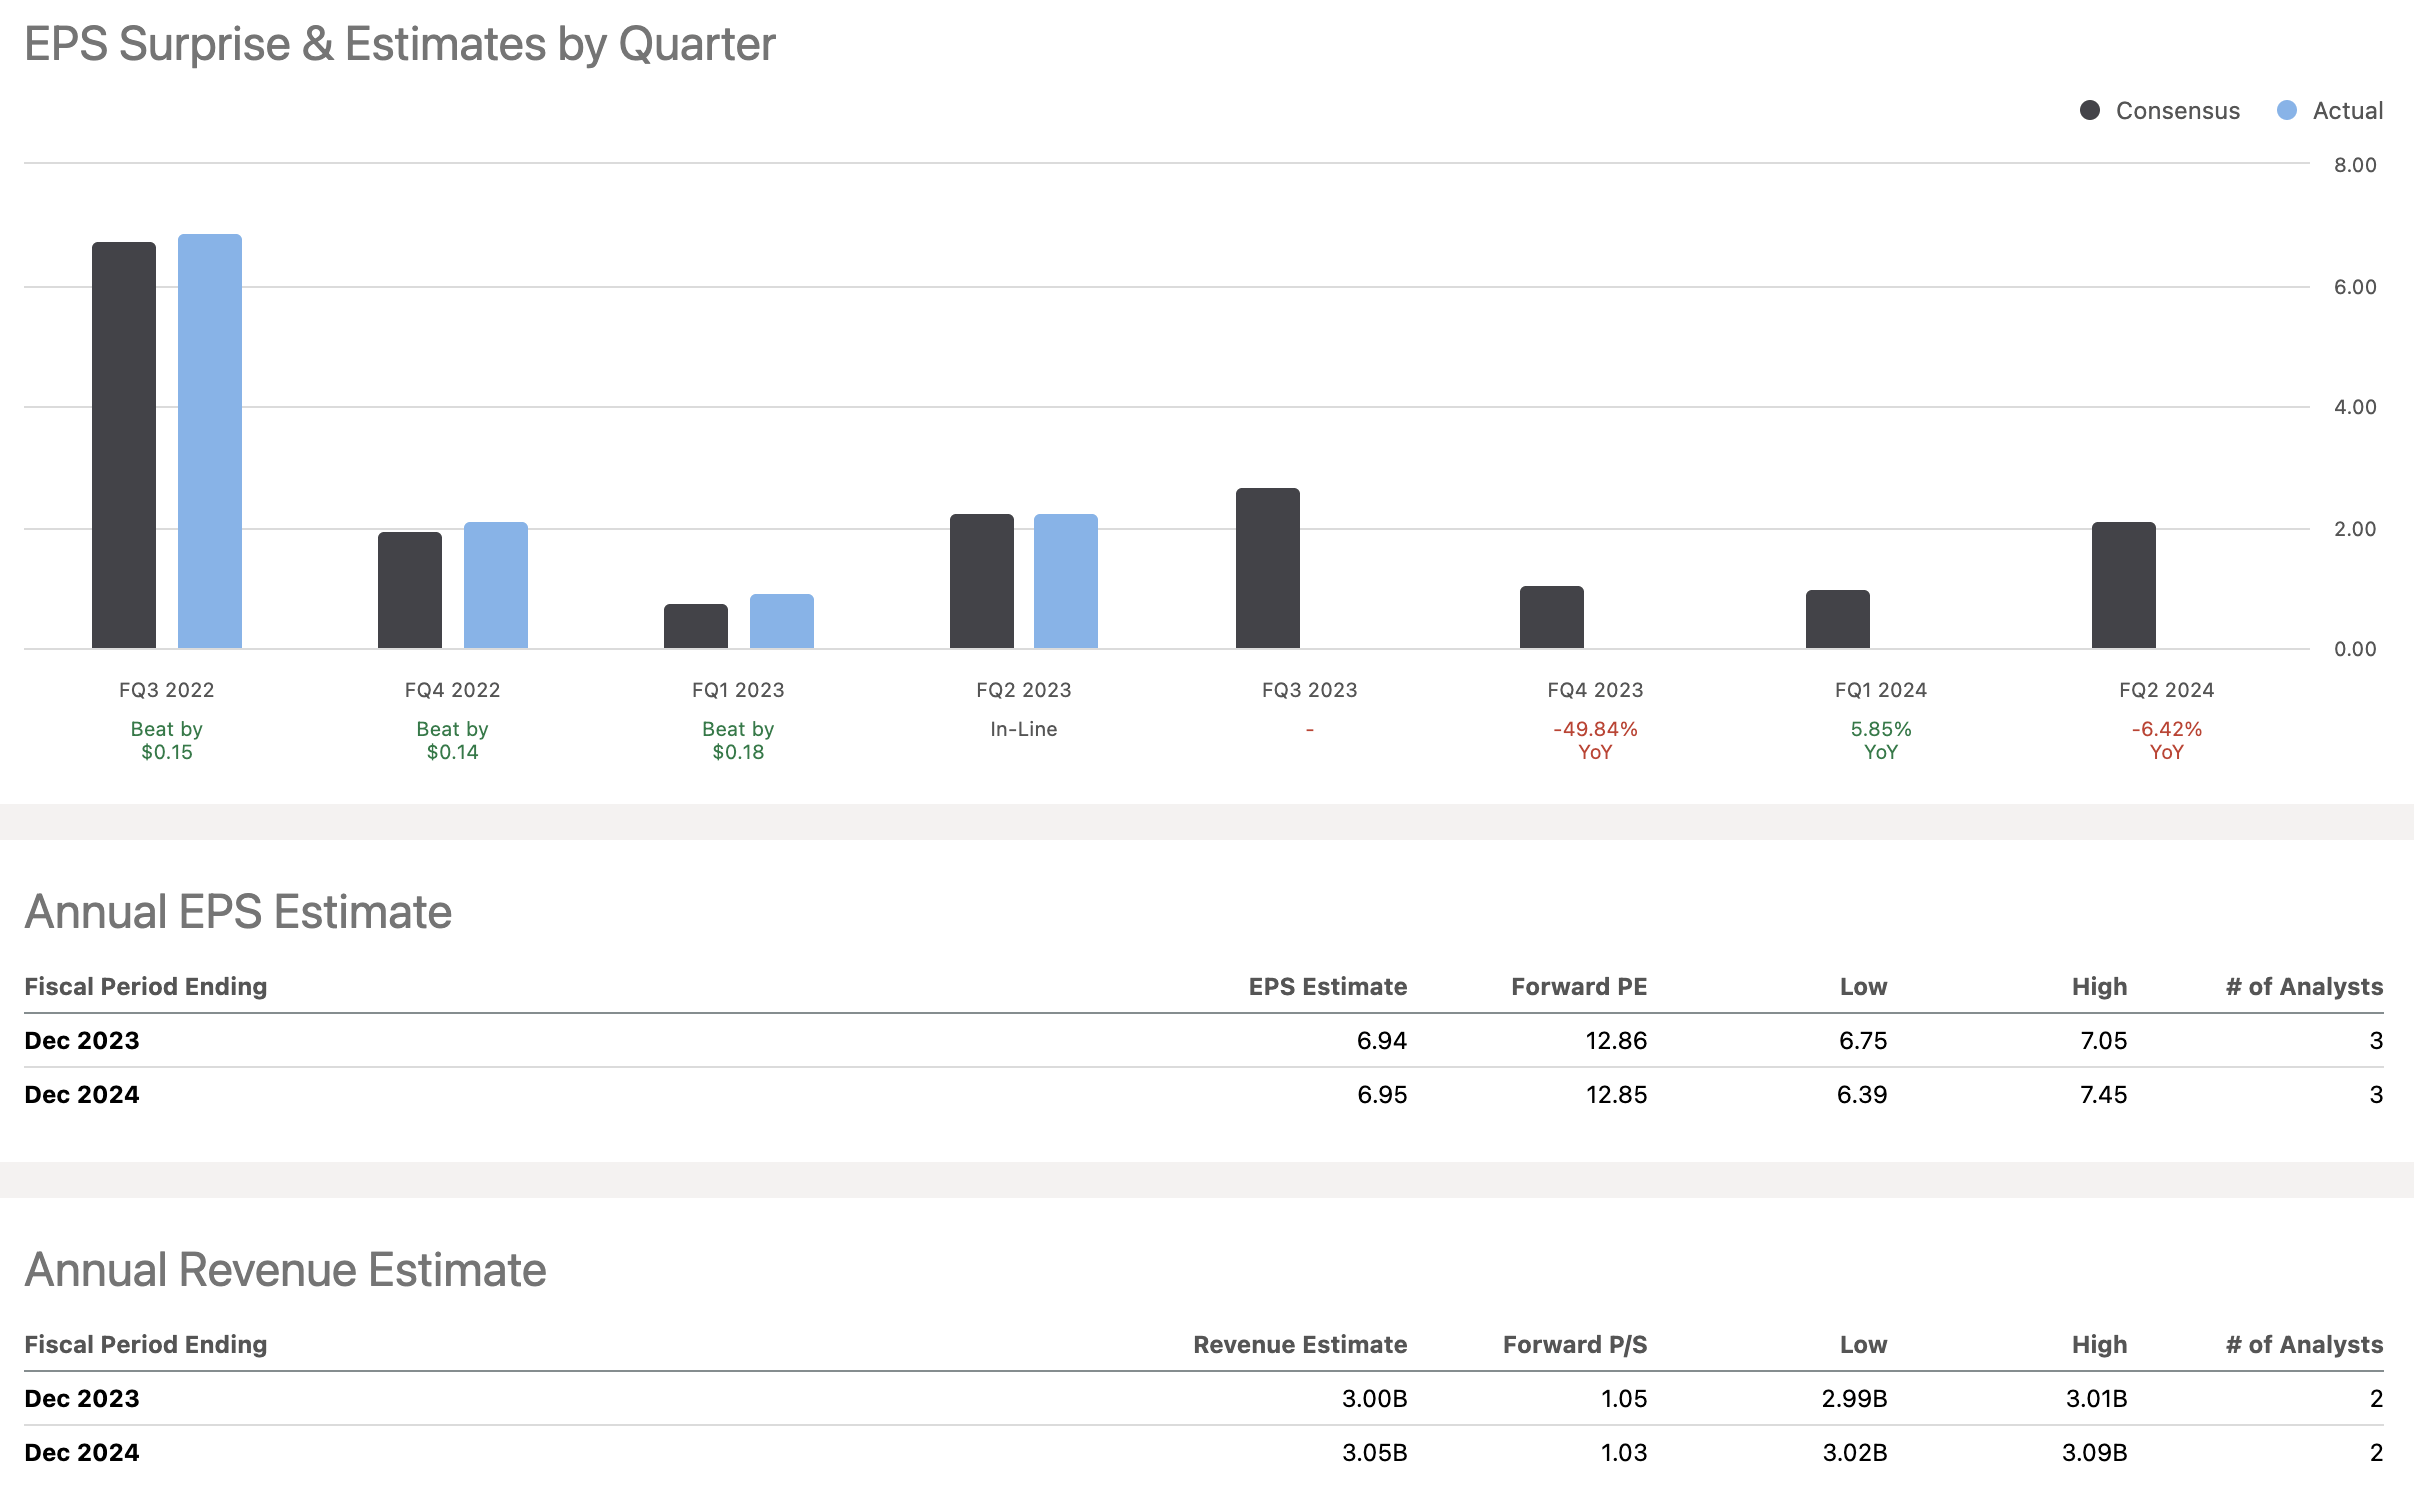
For Matson, Inc., the quarter ending September 30, 2023, for revenue forecasts, the contributing analysts provide a range of projections: a low estimate of $780.2 million, a high estimate of $808.71 million, and a median and average forecast of $794.455 million each. The importance of this revenue range lies in its upward tilt compared to previous quarters, suggesting positive momentum.
The EPS projections for Matson also suggest growth, ranging from a low of $2.56 to a high of $2.76, with an average sitting at $2.69 and a median at $2.75.
Thus, Matson is likely to experience an upward trend in both revenue and EPS for the quarter ending September 30, 2023.
Valuation
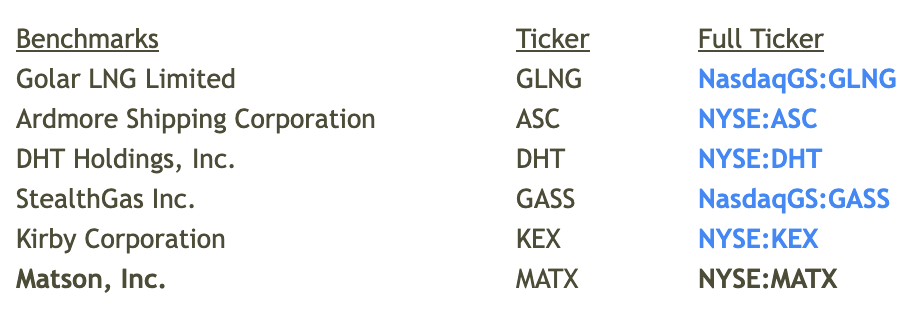
In conducting a comparable valuation of Matson, Inc. on an EV/EBITDA basis, five benchmark companies were selected: Golar LNG Limited (GLNG), Ardmore Shipping Corporation (ASC), DHT Holdings, Inc. (DHT), StealthGas Inc. (GASS), and Kirby Corporation (KEX). These companies were chosen due to their similarity in the shipping and logistics sector, which makes them appropriate for a like-for-like comparison.
LTM EBITDA Multiple Analysis
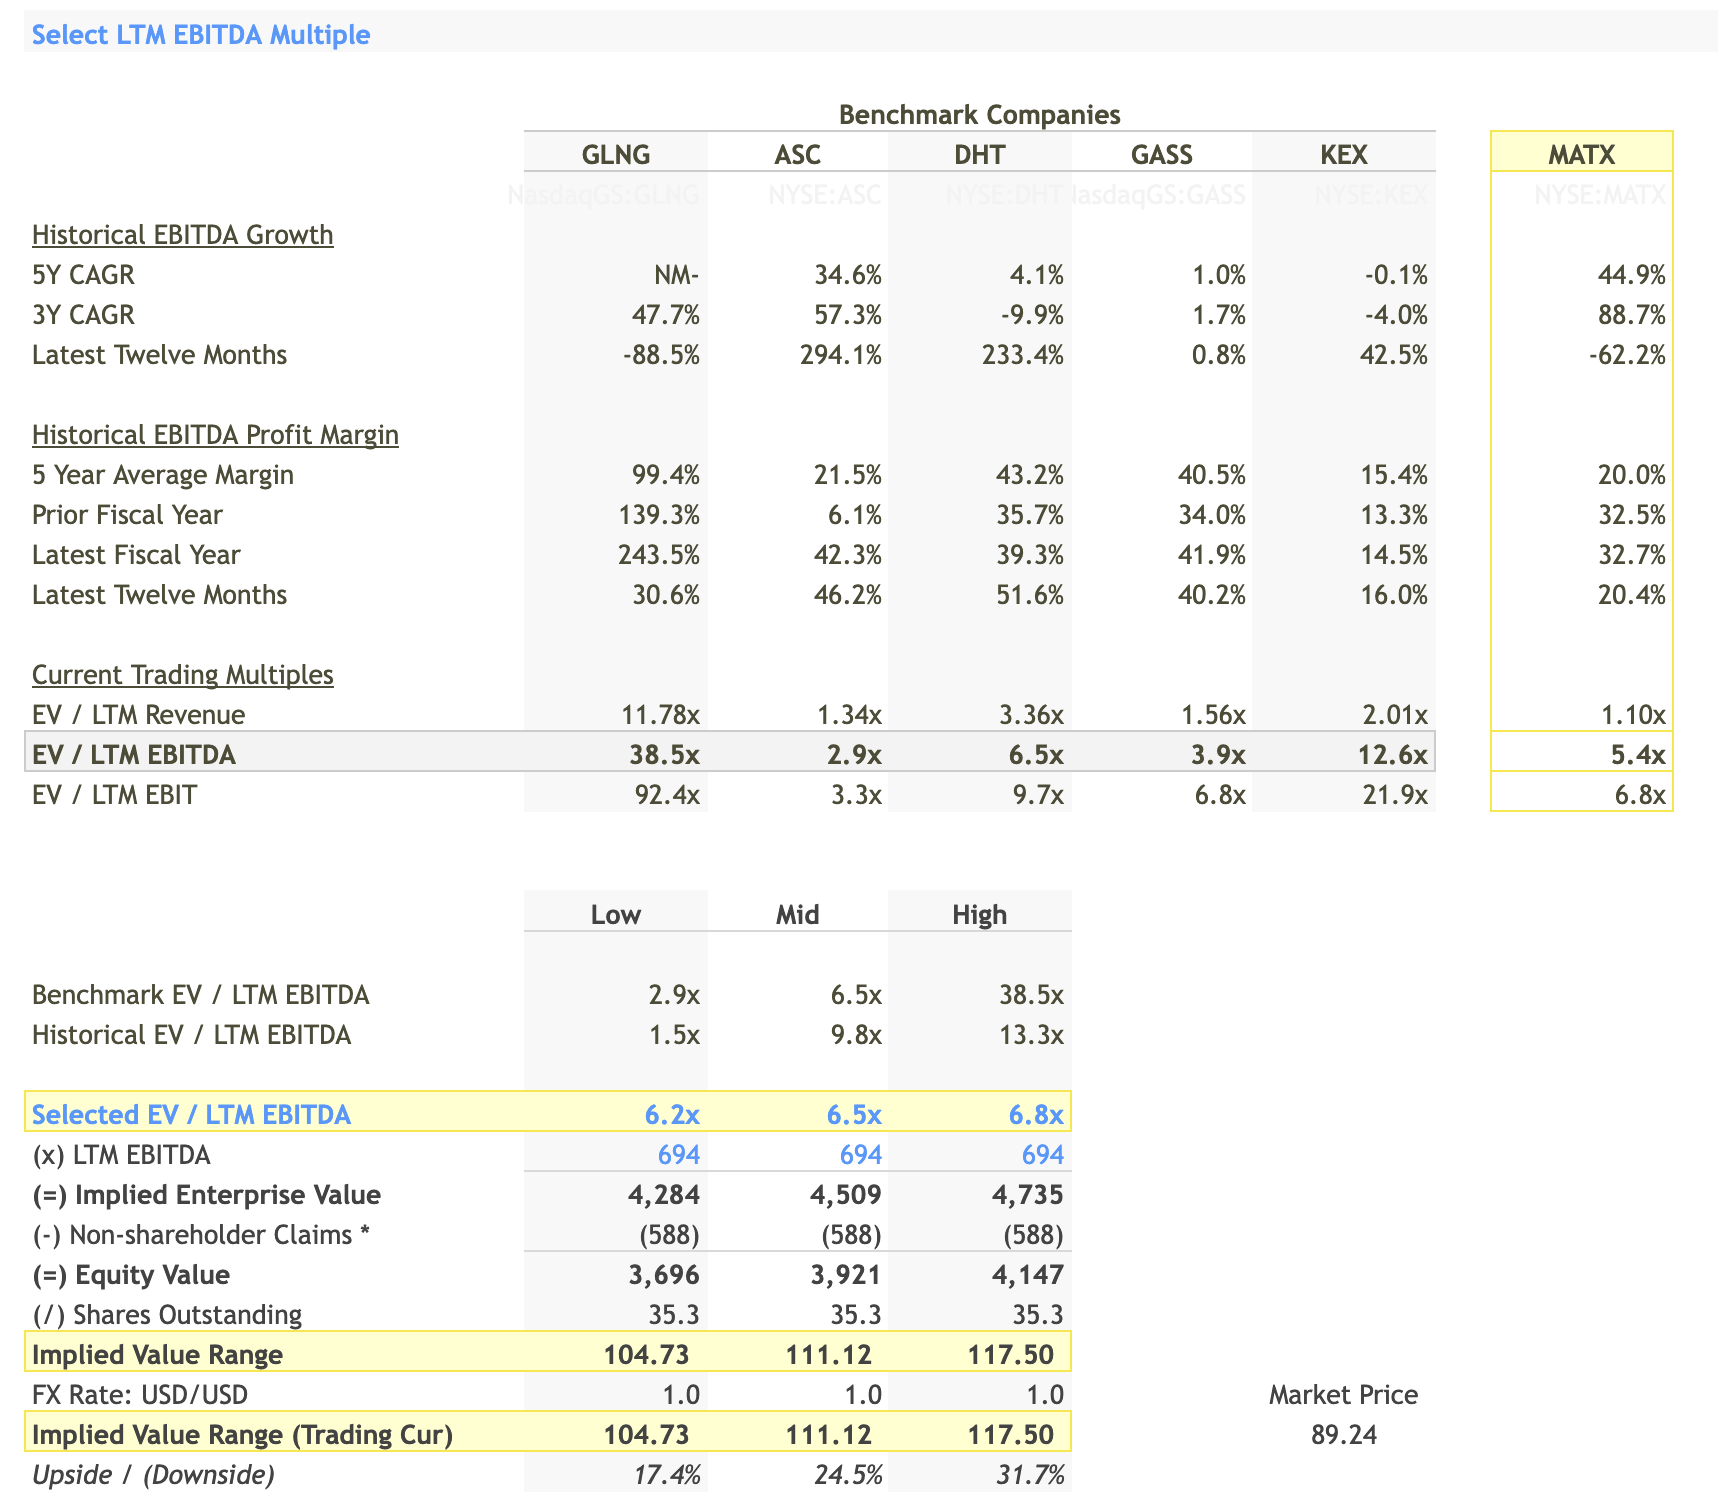
The Last Twelve Months (LTM) EBITDA multiples for the benchmark companies range from 2.9x ((ASC)) to 38.5x ((GLNG)). Such a wide range suggests varying business models, risk profiles, and market expectations within the same industry. Matson has an LTM EBITDA multiple of 5.4x, which sits on the lower end of the spectrum but above the lowest benchmark ((ASC)).
Given the wide range in the benchmark companies, the selected LTM EBITDA multiples were narrowed to 6.2x, 6.5x, and 6.8x. These multiples are closer to Matson's current 5.4x and offer a conservative yet optimistic range for valuation. These were multiplied by Matson's LTM EBITDA of $694 million, giving implied enterprise values of $4,284 million, $4,509 million, and $4,735 million, respectively. After adjusting for non-shareholder claims of $588 million, the implied equity value ranges from $3,696 million to $4,147 million. Divided by the 35.3 million shares outstanding, the implied stock price range is between $104.73 and $117.50, representing an upside of 17.4% to 31.7% compared to the current market price of $89.24.
Projected EBITDA Multiple Analysis
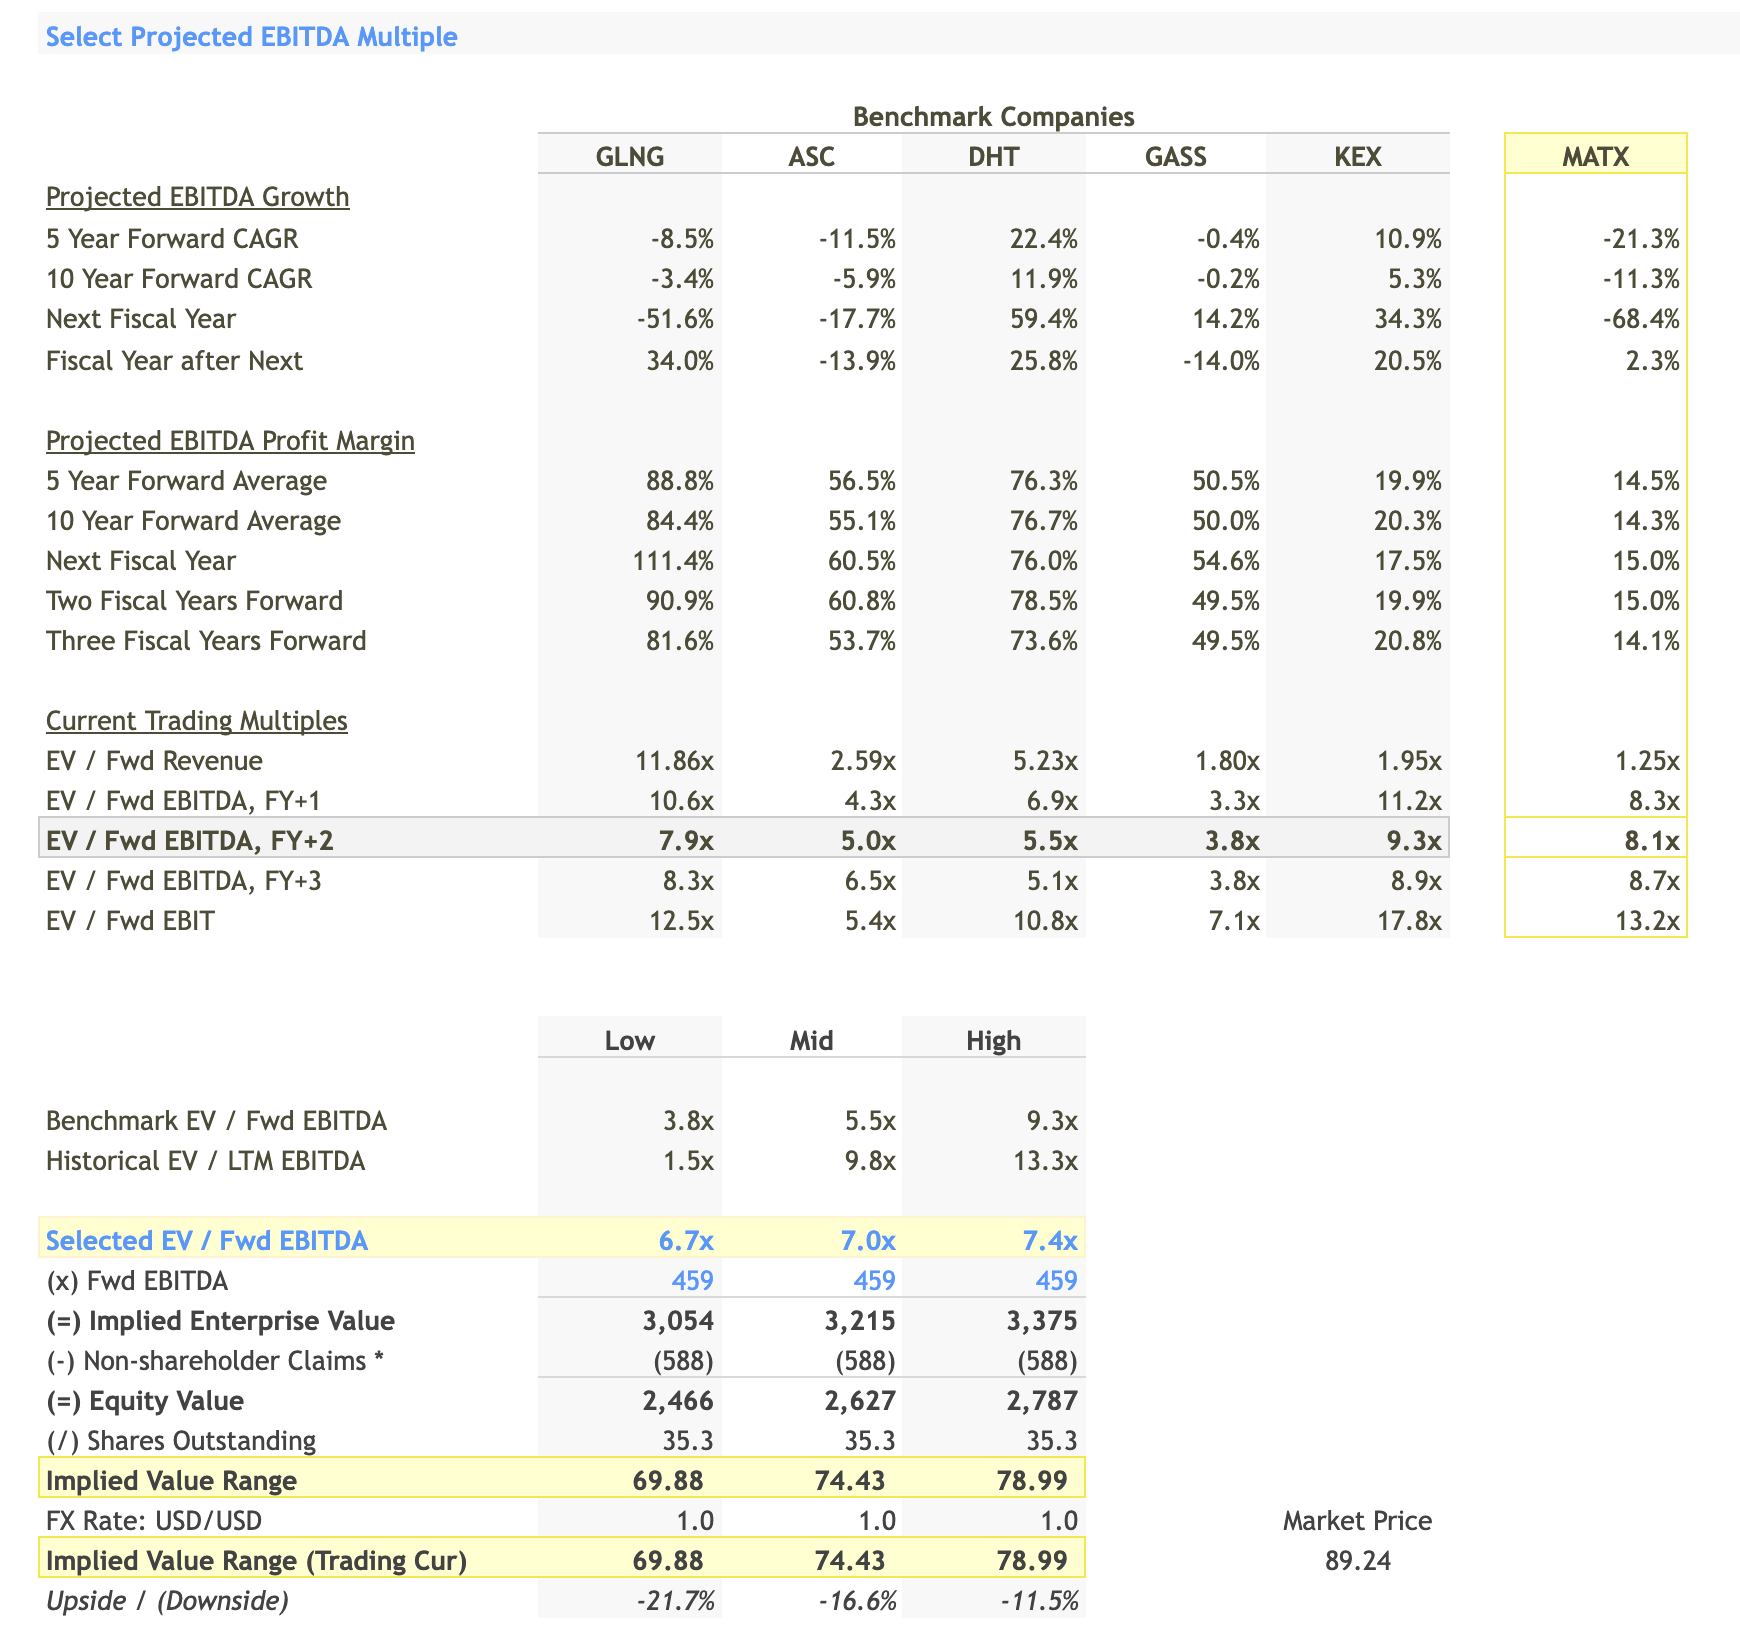
The projected EBITDA growth rates for our benchmark companies over the next 5 and 10 years show a mixed picture. Matson, Inc. is projected to have a 5-Year Forward CAGR (Compound Annual Growth Rate) of -21.3% and a 10-Year Forward CAGR of -11.3%. These negative growth rates are concerning and warrant a more conservative valuation multiple.
For the projected EBITDA multiples, benchmark EV/Fwd EBITDA ranges from 3.8x ((GASS)) to 9.3x ((KEX)). The selected projected EBITDA multiples are 6.7x, 7.0x, and 7.4x. These multiples are slightly higher than the industry mid-point but justified given Matson's stronger historical EBITDA margins.
When applied to Matson's forward EBITDA of $459 million, the implied enterprise values range from $3,054 million to $3,375 million. After deducting $588 million for non-shareholder claims, the equity values range from $2,466 million to $2,787 million. This gives an implied stock price range of $69.88 to $78.99, indicating a downside of 21.7% to 11.5% compared to the current market price.
Fair Value Range: LTM EBITDA vs Projected EBITDA Method
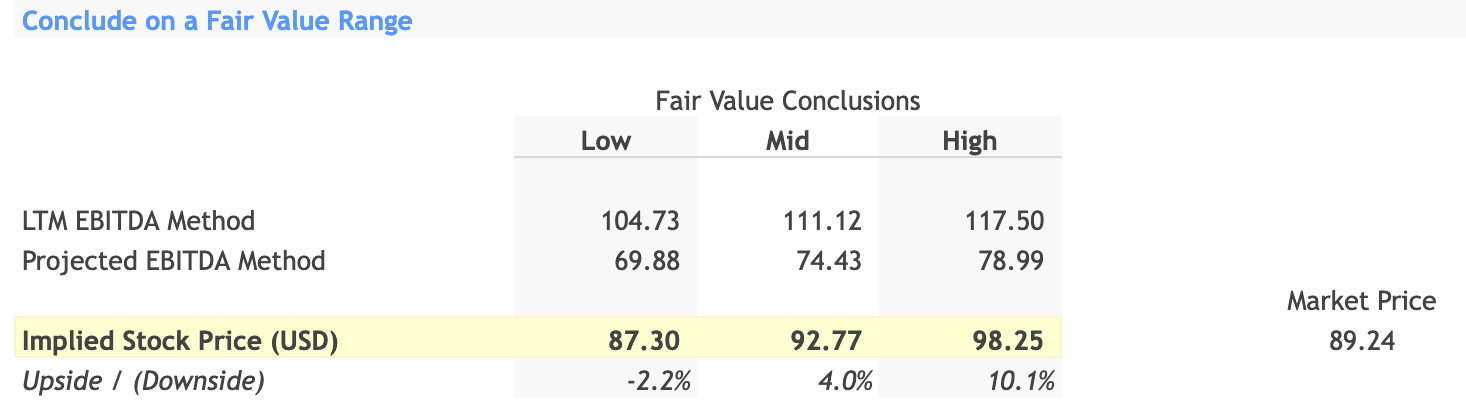
We have calculated the fair value of Matson's stock using two different methods: one based on the Last Twelve Months (LTM) EBITDA and another based on Projected EBITDA.
-
LTM EBITDA Method : The implied stock price range here is from $104.73 to $117.50.
-
Projected EBITDA Method : This method suggests an implied stock price range of $69.88 to $78.99.
Synthesizing the Ranges
The LTM EBITDA method gives us a more optimistic valuation range compared to the projected EBITDA method. This discrepancy is most likely due to Matson's negative projected EBITDA growth rates, which make future earnings look less appealing.
Implied Stock Price and Conclusion
When we look at the two methods, the blended implied stock price range could be calculated as the average of the two methods, giving us a range of $87.30 to $98.25.
Compared to Matson's current market price of $89.24, this blended range suggests that the stock is fairly valued at the lower end of the range but has a potential upside of up to 10.1% at the higher end. Therefore, the analysis suggests a "Hold" decision on the stock. The stock does have some upside potential but also carries risks, especially considering the negative projected EBITDA growth rates. Therefore, a "Hold" decision seems most appropriate at this time. I believe this approach is conservative but rational, given the differing signals from the LTM and projected EBITDA valuations.
For further details see:
Matson, Inc.: A Cautious Hold Amidst Mixed Signals