MAXN - Maxeon Solar: A Reversal In Fortunes
2023-08-15 15:19:00 ET
Summary
- Maxeon Solar's Q2 results fell short of expectations, with shipments and revenue below guidance.
- The company is facing challenges due to a preference for lower-priced alternatives and excess channel inventories in the system.
- Forward valuations for Maxeon Solar have yet to reflect the expected downward revisions in sales and EBITDA estimates.
- The stock broke down from its ascending channel but is not far away from a prospective congestion zone.
Introduction
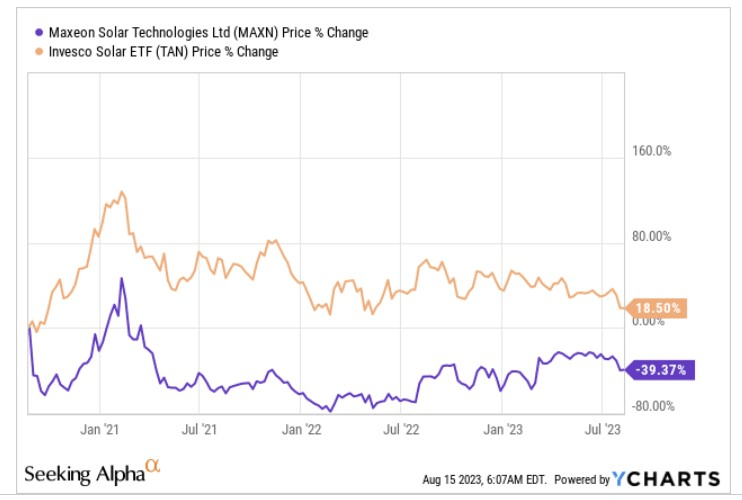
Up until the latest Q2 results- which were announced last week- the stock of Maxeon Solar ( MAXN )- a Singapore based, solar power technology entity, had proven to be a rather dependable bet this year, delivering returns of 19%, even as its solar peers (as represented by the TAN ETF) slumped by around 40%.
MAXN’s main draw has been its IBC-based (interdigitated back contact) Maxeon line of solar panels, which account for the bulk of group revenue ( 54% ) . Sure, these IBC-based panels of MAXN may not be as cost-competitive as some of the traditional front-contact-based solar alternatives, but by placing the contacts at the rear-side (rather than the front), MAXN is better positioned to extract superior efficiency on account of lower shading at the front area. These back contact cells are also less pressurized by the energy conversion and loss challenges that front-contact-based alternatives typically face.
All in all, the Maxeon line of IBC panels is better positioned to engender superior solar efficiency for a given amount of space. The material quality that MAXN uses is also of a certain premium level that degrades at a rate of only 0.2% per year, as opposed to the industry norm of 0.7% for other conventional alternatives. MAXN’s warranty period is also the longest in the industry at 40 years or so. Thus, even though the ticket prices of these Maxeon panels may be pricier than the competition, over time, these panels are likely to not only be more durable, but will also generate 20% more energy (relative to standard alternatives) from the same footprint for a quarter of a century.
Dismal Q2 Results
Last week MAXN published its Q2 results with total shipments and revenue coming in well below expectations. The company’s shipments were expected to come in at a range of 860-900MW but eventually ended up coming 6% short. Meanwhile, Q2 revenue which was expected to hit a range of $360m-$400m came in 3% below the lower-end of the guided range.
As implied in the section above, MAXN wants to be seen as a premium player in this industry, and this positioning could work well when the consumer environment is more resilient and financing conditions are cheap. Unfortunately, that isn’t quite the case at the moment, particularly in Europe where there appears to be a predilection towards lower-priced Chinese alternatives which in turn has resulted in excess inventories building up in the channels. Even if MAXN doesn’t necessarily compete directly in this low-value space, channel inventory bubbles inevitably cause price pressure across the industry, and MAXN’s salesforce is having a difficult time selling a premium offering when price cuts appear to be the norm.
Note that this channel inventory issue has been felt in the US markets as well which were more keenly impacted by the implementation of NEM3.0 in California, something which is expected to weigh adversely through H2-23.
Looking ahead, management believes they can mitigate some of the European market pressures by pivoting more toward the commercial and industrial (C&I) arenas, but this too will bring its own set of challenges. Firstly, the sales cycle in C&I is a lot longer, secondly, C&I is inherently lower margin, and will likely cause further pressure on gross margins ((GM)) which have surprisingly held up reasonably well in Q2 despite the company implementing ASP price adjustments. Regardless, going forward, they won’t be able to maintain GM strength, and management noted that this would likely drop to low double-digits on account of the challenging market conditions.
Forward Valuations Are Yet To Reflect Further Downward Revisions
What’s important to consider is that before the dismal Q2 results, the sell-side positioning towards MAXN's stock had been largely favorable; 86% of the sell-side analysts who covered the stock had a ‘Buy’ or ‘Strong Buy’ rating, with no ‘Sell’ calls whatsoever. The average price target of $32.88 too is currently 2x higher than where the share is currently perched. We suspect some of this optimism may get dialed down in the weeks ahead as FY estimates witness some large contractions.
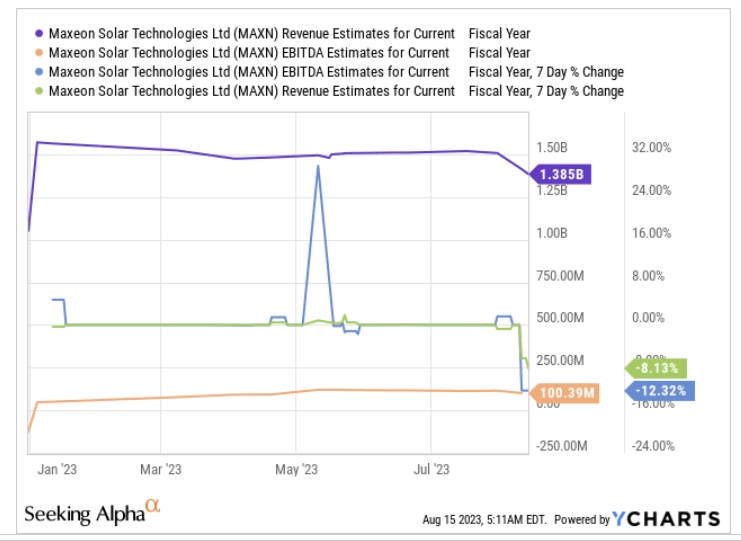
Previously, management had guided for FY23 sales to come within a range of $1400m-$1600m ; that range has now been scaled down by roughly 13% to a range of $1300m-$1500m . On the EBITDA front, the adverse impact is expected to be even more pronounced with an FY range of only $80m-$100m, as against $95m-$120m previously. Note that at the mid-point of this range, you'd be looking at a contraction of EBITDA by 16%.
Despite a roughly 30% contraction in the share price after the results were released, there are still question marks over the stock’s forward valuations as we don’t believe that consensus as a whole has yet made the required adjustments to their numbers.
The latest 7-day data shows that there's been an -8% contraction in revenue estimates and a -12% contraction on the EBITDA front. Even after that, the current consensus revenue figure of $1.385bn, and EBITDA figure of $100.4m are still above the upgraded sales and EBITDA range provided by MAXN management. Thus, we think in the weeks ahead, you’re likely to see more downward revisions in MAXN’s consensus numbers towards the mid-point of the guided range.
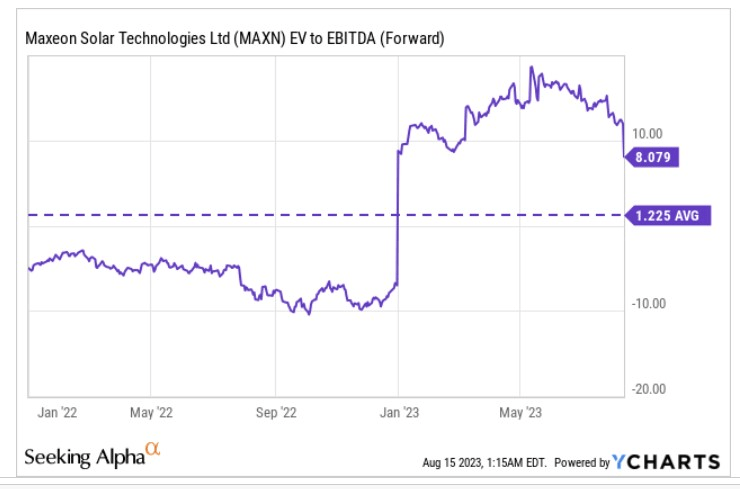
Thus, MAXN may currently be priced at a forward EV/EBITDA of roughly 8x, a long way from its historical average, but expect this to go up to around 8.17x soon enough unless we see further contraction in the market-cap.
Closing Thoughts - Technical Considerations
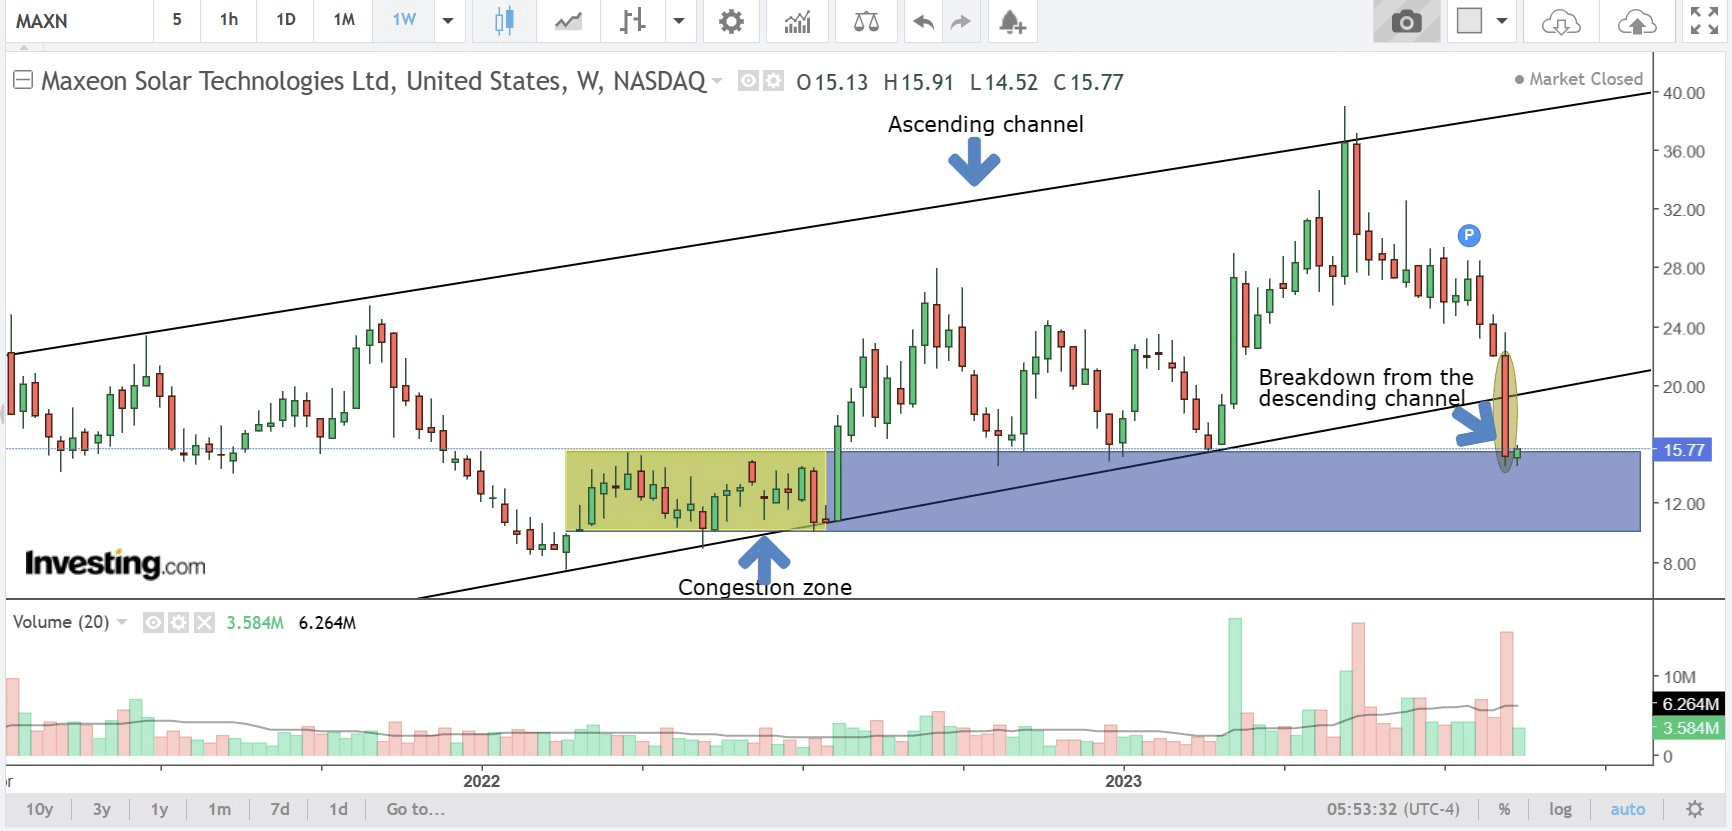
On MAXN’s weekly chart, note that for close to 16 months the stock had been trending up within an ascending channel. Such was the shock of the Q2 results that the stock ended up breaking the lower boundary of the channel.
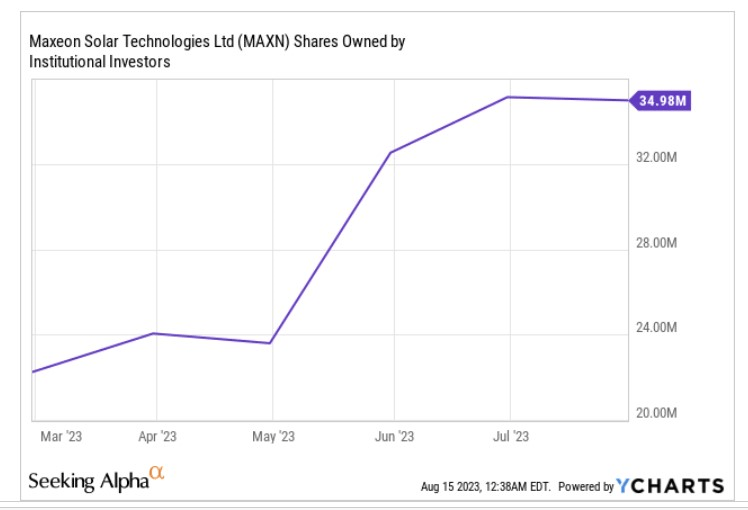
Favorable sell-side positioning pre-results would likely have motivated the smart money to buy into this counter, and you can see how the total shares owned by these institutions had picked up this year. There's a good chance some of these institutions unwound their positions post results and the typically huge positions that they hold may have driven the selling.
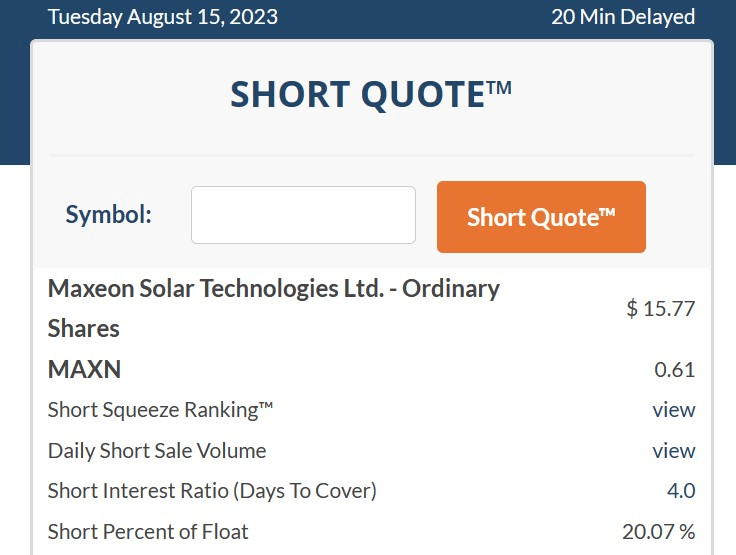
It looks like even the short-sellers appeared to have gained confidence. Pre-results, the percentage of float that was short was around 17% ; now the latest data suggests that this increased even further to 20%.
When the stock has just broken from an important channel, and selling conditions also appear to be strong, it would be unwise to jump into this counter straight away; rather, we would advise investors to wait for a few weeks to see if MAXN can take support and build a base within the $10-$15 range. History has shown that this terrain has previously worked as a congestion zone (see the area highlighted in yellow, in the weekly chart image), and we could see a repeat of the same.
For further details see:
Maxeon Solar: A Reversal In Fortunes