CRAK - May Non-OPEC And World Oil Production
2023-09-14 05:08:00 ET
Summary
- May Non-OPEC oil production dropped by 412 kb/d to 50,010 kb/d. The largest decreases came from Canada 118 kb/d and Russia 193 kb/d.
- OPEC’s C + C production decreased by 592 kb/d in May while YoY it increased by 39 kb/d.
- The China National Bureau of Statistics reported that production during June dropped by 146 kb/d and dropped a further 37 kb/d in July to 4,073 kb/d.
- World oil production decreased by 1,004 kb/d in May. The largest decrease came from Saudi Arabia 700 kb/d followed byRussia with 193 kb/d.
A guest post by Ovi
Below are a number of Crude plus Condensate (C + C) production charts, usually shortened to “oil”, for Non-OPEC countries. The charts are created from data provided by the EIA’s International Energy Statistics and are updated to May 2023. This is the latest and most detailed world oil production information available. Information from other sources such as OPEC, the STEO and country specific sites such as Russia, Brazil, Norway and China is used to provide a short term outlook for future output and direction for a few of these countries and the world. The US report has an expanded view beyond production by adding rig and frac spread charts.
Where STEO data was used, the ratio of C + C to All Liquids was calculated . The average for the last eight months was used to project the June and July production numbers in a few cases.
World oil production and projection charts are presented at the end of this post.
May Non-OPEC oil production dropped by 412 kb/d to 50,010 kb/d. The largest decreases came from Canada 118 kb/d and Russia 193 kb/d.
Using production data from the September 2023 STEO, a projection for Non-OPEC oil output was made for the period June 2023 to December 2024. (Red graph). Output is expected to reach 52,785 kb/d in December 2024, which is 377 kb/d higher than the December 2019 peak of 52,408 kb/d. It is also 410 kb/d lower than projected in the previous Non-OPEC post because the EIA made a significant reduction/revision to Russian output back to January 2018.
From June 2023 to December 2024, oil production in Non-OPEC countries is expected to increase by 1,801 kb/d, a seemingly unrealistic forecast. According to the STEO, the major contributors to the increase are expected to be the US, close to 600 kb/d and Canada close to 800 kb/d, both estimates considered to be on the high side.
May Non-OPEC W/O US production dropped by 398 kb/d to 37,374 kb/d. June 2023 production is projected to increase by 766 kb/d. Major contributors will be Canada and Brazil. See associated charts below.
From June 2023 to December 2024, production in Non-OPEC countries W/O the US is expected to increase by 1,266 kb/d.
Note that December 2024 output exceeds the pre-covid high of 39,062 kb/d in January 2020 by 344 kb/d.
Non-OPEC Oil Production Ranked by Country
Listed above are the World’s 10 largest Non-OPEC producers. The criteria for inclusion in the table is that all of the countries produce more than 1,000 kb/d.
May’s production drop for these ten Non-OPEC countries was 362 kb/d while as a whole the Non-OPEC countries saw a production decrease of 412 kb/d.
In May 2023, these 10 countries produced 83.2% of Non-OPEC oil production.
OPEC’s C + C production decreased by 592 kb/d in May while YoY it increased by 39 kb/d . World MoM production decreased by 1,004 kb/d while YoY output increased by 1,441 kb/d.
Non-OPEC Oil Production Charts
The EIA reported that Brazil’s May production increased by 60 kb/d to 3,201 kb/d.
Brazil’s National Petroleum Association (BNPA) reported that output in June and July increased to a new record high. July increased by 146 kb/d to 3,513 kb/d mainly due to new project start-ups in the Pre-Salt layer, red markers.
According to the September MOMR: “Recent monthly growth is attributed to two new FPSOs, which started production in May. This includes Anna Nery, installed at the Marlim complex in the offshore Campos Basin, and Almirante Barroso in the Buzios subsalt field. M-o-M recovery in Tupi and some post-salt fields also improved Brazil’s performance. Overall, crude oil output is expected to be supported by offshore start-ups announced since the beginning of the year.”
According to the EIA, Canada’s production declined by 118 kb/d in May to 4,212 kb/d. The April and May drops to 4,212 kb/d were due to significant maintenance at the oil sands mines and upgraders. The STEO is forecasting a production rebound of 391 kb/d from May to 4,603 kb/d in July.
The EIA reported China oil output in May increased by 46 kb/d to 4,256 kb/d.
The China National Bureau of Statistics reported that production during June dropped by 146 kb/d and dropped a further 37 kb/d in July to 4,073 kb/d.
While China’s production growth has risen steady since 2018, it may be approaching its post pandemic high.
Every January for the last four years, China’s production has taken a massive jump. In January 2022, production climbed by 307 kb/d to 4,185 kb/d. In 2023, production jumped in both January and February by 322 kb/d to a new high of 4,295 kb/d. Production then drops after these big increases. Are the production jumps associated with new wells being brought online and why in winter?
According to the EIA, Kazakhstan’s output decreased by 91 kb/d in May to 1,814 kb/d. The STEO is forecasting a production increase in June and then a drop to 1,848 kb/d in July.
Mexico’s production in May was 1,969 kb/d an increase of 5 kb/d over April. Output dropped to 1,915 kb/d in July according to Pemex.
Mexico has recently revised its definition of condensate. This has resulted in the EIA adding an extra 60 kb/d, on average, to the Pemex report. The red markers include the additional 60 kb/d.
The EIA reported Norway’s May production to be 1,792 kb/d. The Norway Petroleum Directorate ((NPD)) reported that June’s production rebounded to 1,818 kb/d and then to 1,846 kb/d in July. (Red markers).
According to the NPD : “Oil production in July was 0.6 percent less than the NPD’s forecast and 0.4 percent lower than the forecast so far this year.”
According to this source : “The North Sea’s biggest oil field Johan Sverdrup now has the capacity to produce as much as 755,000 b/d of crude.” Current production of close to 1,850 kb/d appears to be close to Norway’s oil production peak.
Oman’s production has risen very consistently since the low of May 2020. However production began to drop in October 2022. Oman’s May output dropped by 22 kb/d to 1,044. The STEO indicates that production will continue to drop. July production is expected to drop to 1,037 kb/d.
Qatar’s May output was unchanged at 1,322 kb/d, possibly due to lack of updated information.
The EIA reported Russia’s May C + C production dropped by 193 kb/d to 9,323 kb/d. This drop does not reflect the 368 kb/d significant reduction/revision made to Russian output in January 2018 shown in the chart.
Using data from Argus Media , Russian production was estimated from April to August. For August, Argus reported that Russian production of crude was 9,470 kb/d, blue markers. May production is available here . Using information from this S&P Global article, Russian condensate production is close to 8% of crude production. Adding 8% to August crude results in C + C production of 10,228 kb/d, red markers.
Clearly there is a major discrepancy between the EIA’s C + C production and other sources which just report Crude . See next table.
This table shows the significant difference between the latest Russian C + C production reported by EIA compared to many other sources. The EIA reports C + C. However by reviewing the data in this table, it appears the EIA’s latest Russian production is closer to crude.
The Argus C + C row is Argus Crude multiplied by 1.08 as noted above. The OPEC crude data is taken from the OPEC MOMR. The just released September MOMR makes the following statement: “ Russia’s liquids production in July fell by around 30 tb/d m-o-m to average 10.8 mb/d. This includes 9.5 mb/d of crude oil and 1.2 mb/d of NGLs and condensate. “
Crude production as reported by the IEA and OPEC are very similar.
STEO all liquids production is taken from the current September report. STEO C + C uses the ratio of past EIA C + C production for Russia with the STEO all liquids data. The current average ratio over the past eight months is 0.8934.
Looking at the latest EIA production data for May, it is more closely aligned with the Crude information from other sources than C + C as inferred from the Argus data. It will be interesting to see if there is a correction to the EIA data in the June report.
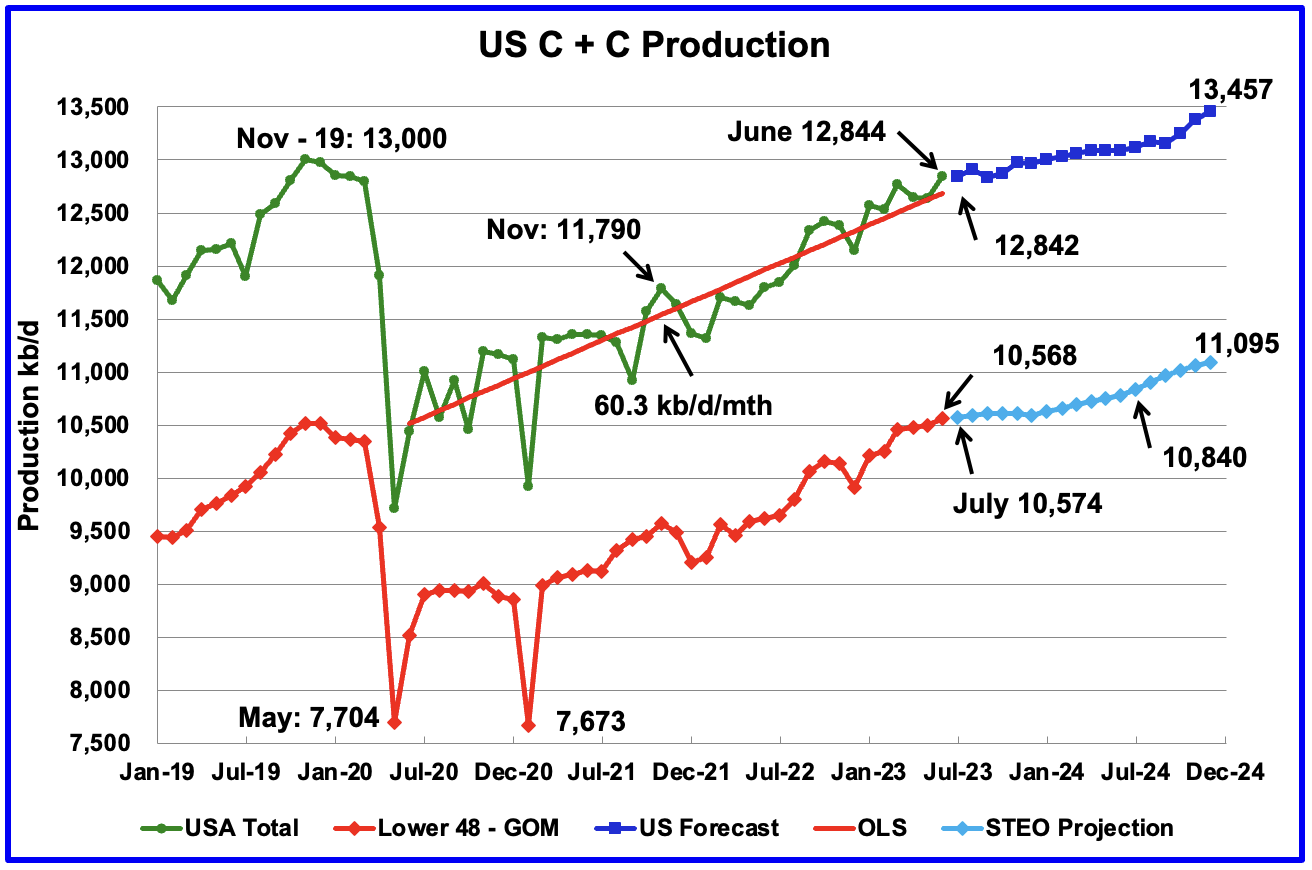
U.S. June oil production increased by 207 kb/d to 12,844 kb/d. The large increase is primarily due to a 147 kb/d increase in the GOM.
The dark blue graph, taken from the September 2023 STEO, which has been updated since the last post, is the forecast for U.S. oil production from July 2023 to December 2024. Output for December 2024 is expected to be 13,457 kb/d, which is 98 kb/d higher than posted in the September US post.
For both the US and the Onshore L48, little change is production is expected in July.
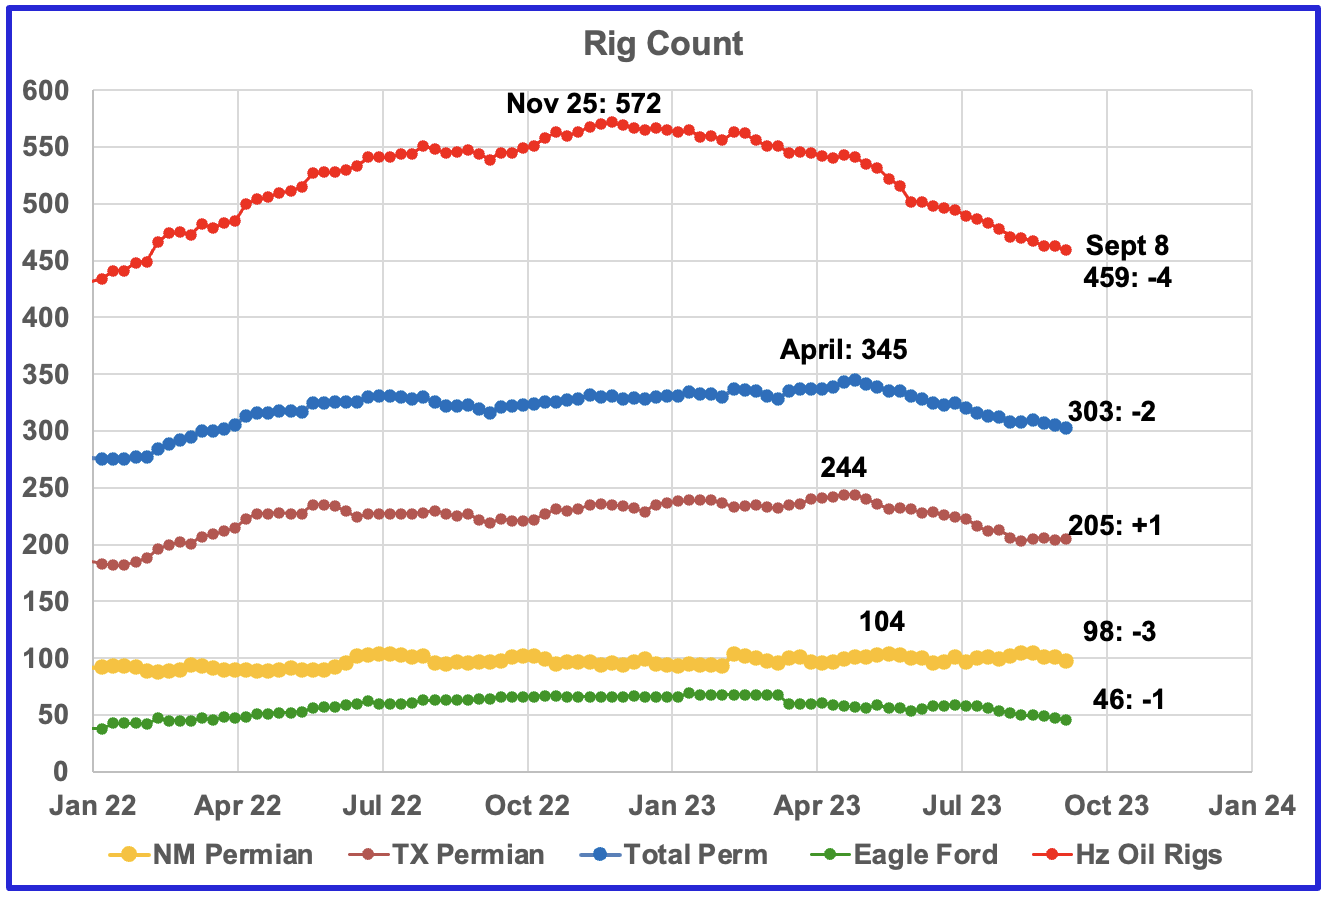
- A high of 572 Hz oil rigs was reached in the week ending November 25, 2022. In the week ending Sept 4, 2023 the number of rigs dropped by 4 to 459 and is down 113 from the November high of 572
- Permian rigs were down 2 to 303 with Texas Permian up 1 and NM Permian down 3 to 98
- Eagle Ford was down 1 to 46
- NG was down 1 to 101, not shown
Since January 2022, the frac spread count has wandered between 250 and 300 fracs per week. For all of 2022 the average weekly frac count was 280. However in the last week of August and early September, the frac count dropped below 250 but recovered to 252 in the week ending September 8.
The frac count is still 28 spreads below the 2022 average of 280 and includes fracs of NG wells.
These six countries complete the list of Non-OPEC countries with annual production between 500 kb/d and 1,000 kb/d.
Their combined May production was 3,875 kb/d, down by 11 kb/d from April.
The overall output from the above six countries has been in a slow steady decline since 2014 and appears to have accelerated after 2019.
Argentina is now producing more than 500 kb/d and should be added to the Six small countries above. However I don’t plan to do that because it’s a country with growing production while the others are declining.
Oil production is rising in Argentina because of the opening of the Vaca Muerta formation. According to this sSource : “Vaca Muerta shale formation accounts for nearly half of Argentina’s oil and 60% of its natural gas, potentially producing one million barrels of oil per day by 2030.”
A Different Approach to World Oil Production
Instead of dividing the World oil producing countries into OPEC and Non-OPEC, this section will divide the countries into two groups on the basis of their production capacity. The division will be The Big Three, US, Saudi Arabia and Russia, and the Rest, i.e. the World oil producers W/O the Big 3. The top producer in the Rest, currently China, produces less than half of the lowest producer in the Big Three.
Peak production in the Big 3 occurred in April 2020 at 34,336 kb/d. The peak was associated with a large production increase from Saudi Arabia. Post covid, production peaked at 33,287 kb/d in September 2022. The drop since then is due to production cutbacks in Russia and Saudi Arabia.
May production was down 907 kb/d to 32,086 kb/d.
Production in the Rest has been in a slow decline since peaking in November 2016 at 52,279 kb/d.
Production rose post covid to 49,215 kb/d in February 2023. Since then production has dropped by 1,047 kb/d to 48,058 kb/d. The two biggest contributors to the drop since February are Canada 411 kb/d and Iraq 230 kb/d.
World Oil Production Ranked by Country
Above are listed the World’s 12th largest oil producers. In May 2022, these 12 countries produced 76.2% of the world’s oil. On a MoM basis, their production decreased by 1,144 kb/d while on a YoY basis, production increased by 917 kb/d.
World oil production decreased by 1,004 kb/d in May. The largest decrease came from Saudi Arabia 700 kb/d followed by Russia with 193 kb/d.
World Oil Production Projection
World oil production in May decreased by 1,004 kb/d to 80,153 kb/d.(Green graph).
This chart also projects World C + C production out to December 2024. It uses the September 2023 STEO report along with the International Energy Statistics to make the projection. (Red markers).
The red graph forecasts that World crude production in December 2024 will be 82,805 kb/d and is 1,387 kb/d lower than the November 2018 peak. Note the large increase of 700 kb/d to 82,000 kb/d in January 2024 . This could be due to Saudi Arabia plus other OPEC+ countries partially reversing their previous cuts.
World without the US oil output in May decreased by 990 kb/d to 67,517 kb/d. June’s output is expected to increase by 939 kb/d to 68,456 kb/d. December 2024 output of 69,348 kb/d is 3,053 kb/d lower than October 2018 output of 72,401 kb/d.
World oil production W/O the U.S. from June 2022 to December 2024 is forecast to increase by a total of 892 kb/d.
Editor's Note: The summary bullets for this article were chosen by Seeking Alpha editors.
For further details see:
May Non-OPEC And World Oil Production