MCI - MCI: Best Of Both Worlds - Solid 8.4% Income And Capital Appreciation
2024-01-21 09:00:00 ET
Summary
- Barings Corporate Investors is a closed-end fund that primarily invests in privately placed, below-investment grade, long-term debt obligations.
- The MCI CEF has an unparalleled record among bond funds, providing its owners with high income and capital appreciation at the same time.
- We believe it is an excellent fund for income investors; we would rate the fund as a "conditional buy" for new investors. For existing investors, it is a "hold." It may be preferable to dollar-cost-average the buy instead of a lump sum.
Introduction:
Barings Corporate Investors ( MCI ) is a closed-end fund, or CEF, incepted in August 1971. The fund is one of the few CEFs that are more than 50 years old and still going strong. The fund primarily invests in privately placed, below-investment grade, long-term debt obligations. Many times, these debt investments are accompanied by equity features. The debt investments provide the fund with the income, while the equity feature provides scope for capital appreciation. The fund is helped by having access to Barings's extensive deal network of private equity sponsors.
As per the fund's literature :
"First offered to the public in 1971, Barings Corporate Investors ((MCI)) seeks to provide a consistent yield while at the same time offering an opportunity for capital gains. MCI's principal investments are in the privately placed, below-investment grade, long-term debt obligations of companies primarily domiciled in the U.S. These direct placement securities may, in some cases, be accompanied by equity features such as warrants, conversion rights, and occasionally preferred stocks. We typically purchase these investments directly from their issuers, who tend to be smaller companies and may also temporarily invest in marketable investment-grade and other debt securities (including high yield) and common stocks. MCI is managed on a total return basis and distributes substantially all of its net income each year in the form of quarterly dividends."
Other salient features of this fund are as follows:
- Focused on privately placed long-term debt or loan obligations to small companies, with 65% of them being first-lien senior secured loans.
- The fund uses roughly 10% leverage to enhance the potential for generating income. The leverage is reasonably low, which makes the fund that much safer. Generally, the leverage can make a fund more volatile than it would be otherwise.
- The fund has an excellent past record of performance, especially when you consider the fact that it is primarily a high-yield debt fund. Longer term, as of Sep. 30, 2023, the fund returned 10.6%, 11.9%, 9.5%, 10.0%, and 11.3% for the 1, 3, 5, 10, and 25-year periods, respectively, on the NAV (net asset values) basis. These results assume that all distributions were reinvested.
- The fund pays a quarterly distribution, with a policy of paying nearly all of its investment income to shareholders. As a result, the distribution amount can vary from year to year, even though it has regularly increased the distribution payouts. One recent exception was in 2020 when the fund reduced the distribution amount.
- The fund invests mostly in U.S. based companies, with only minor investments in Canada and the U.K. It is invested 90% in debt obligations and 10% in equity.
- It is a highly diversified fund and has a total of 339 holdings (as of Sep. 30, 2023). The top 10 holdings accounted for nearly 18% of the total assets.
- As of Sep. 30, 2023, the fund under its management had roughly $388 million in total assets and $345 million in net assets.
- The fund is an actively managed fund and has an expense ratio of 1.10% on the managed assets (total assets including leverage), in addition to the interest expense on the leverage.
- As of Jan. 17, 2024, its distribution yield on the market price was 8.41% and 8.90% on the NAV (NAV as of Sep. 30, 2023).
- As of Jan. 17, 2024, MCI's market price commanded a premium of 10.72% to its NAV. However, on a 3-year average basis, it has traded at a discount of -9.19%.
How does the Fund compare with its benchmark or similar funds?
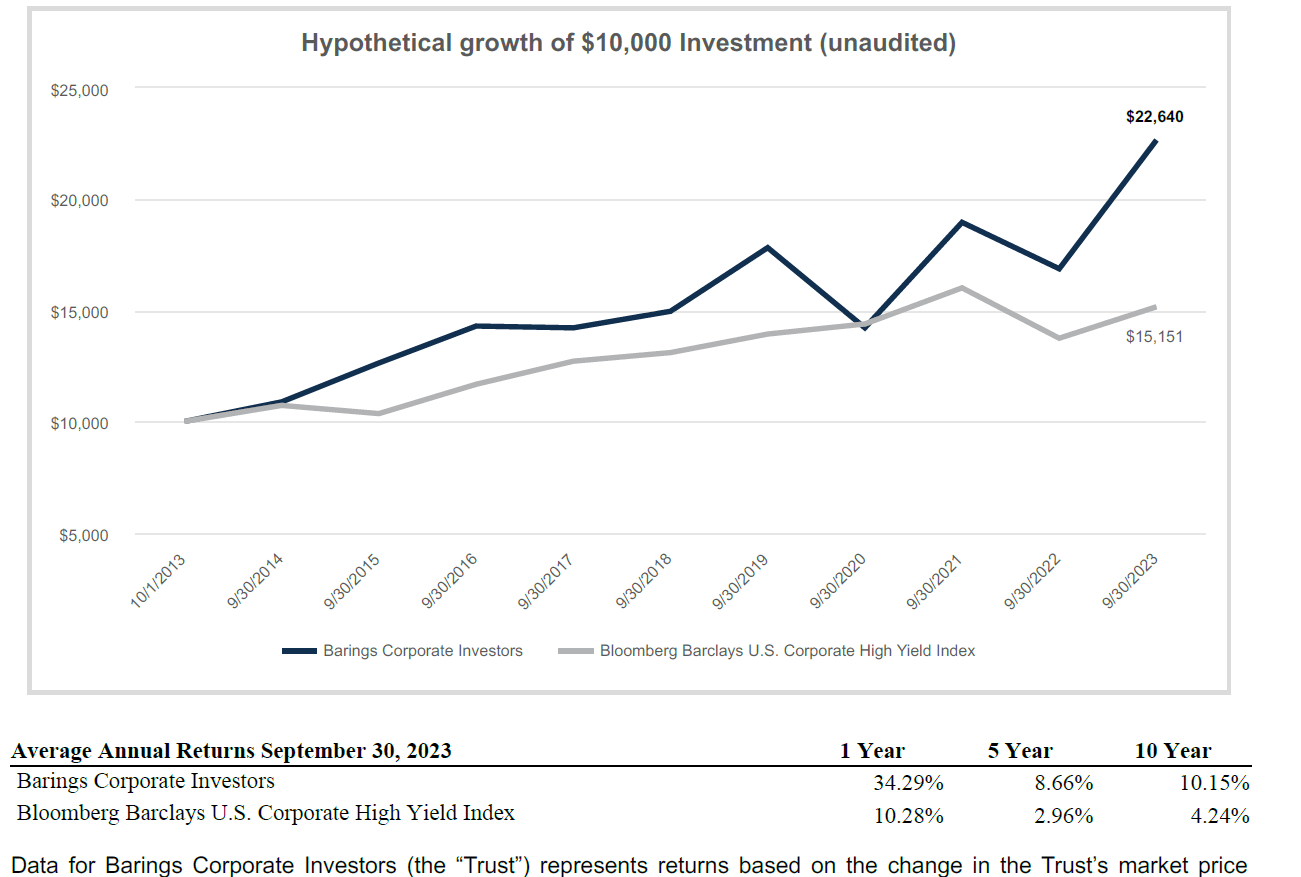
The fund's benchmark is the Bloomberg Barclays U.S. Corporate High Yield Index. Let's see how it compares with its benchmark. In fact, the fund has a vastly superior performance compared to its benchmark. The chart below is a bit outdated as of Sep. 30, 2023, but still gives an idea.
Chart-1:
Chart Courtesy: MCI Quarterly report.
Why invest in a fund like MCI? Well, we think there are two reasons: MCI is a great fund for income seekers with its quarterly and relatively reliable and fully covered high-income (over 8.4% currently), and secondly, its outstanding long-term total returns, in spite of being a debt fund.
As stated earlier, longer term, as of Sep. 30, 2023, the Trust returned 10.6%, 11.9%, 9.5%, 10.0%, and 11.3% for the 1, 3, 5, 10, and 25-year periods, respectively, based on the change in the fund's NAV (net asset values). These are some impressive long-term returns.
If we were to compare its performance with some other highly popular income funds, starting from Jan. 2005 until Dec. 31, 2023, it beats most of them. Further, MCI is especially attractive if you are withdrawing the income on a regular basis. For example, if we had invested $1 million in each of the five funds (MCI, UTG, UTF, XLU, and S&P500) on Jan. 1, 2005, and started withdrawing inflation-adjusted $40,000 (4% of initial capital) every year (from each portfolio), we would have the following balances as of Dec. 31, 2023:
UTG – Reaves Utility Income Fund ( UTG ).
UTF – Cohen & Steers Infrastructure Fund ( UTF ).
XLU – Utilities Select Sector SPDR ETF ( XLU ).
SPY – S&P 500 ETF Trust ( SPY ).
Table-1:
| Fund |
| Initial capital $1 million (invested Jan 2005), withdrawing ZERO income , all div. reinvested. Balance as of Dec. 31, 2023. |
| Initial capital $1 million (invested Jan 2005), withdrawing inflation-adj. $40,000 income annually (Total Income drawn $957,000 each fund). Balance as of Dec 31, 2023. |
| MCI |
| $5.64 million |
| $3.18 million |
| UTG |
| $5.09 million |
| $3.0 million |
| UTF |
| $5.11 million |
| $2.8 million |
| XLU |
| $4.42 million |
| $2.47 million |
| S&P500 |
| $5.60 million |
| $2.68 million |
Note: The calculations were done using Portfoliovisualizer.com . Past performance is no guarantee of future results. Also, the result would vary depending on which year you started the investment. S&P 500 has beaten most investments in the recent 5-10 year periods.
Financial Outlook:
Let's look at the Fund's Financial health and performance. The most recent detailed report that is available to investors is the 9-month report for the period of Jan. 2023 – Sep 30. 2023. The annual report as of Dec. 31, 2023, is already due but is not likely to be available for some time.
Net Investment Income:
The net investment income (or NII in short) is the net income that a fund earns from its investment in the form of dividends, distributions, and interests or derivatives like options, minus all of the fund's expenses, including management fees, operating expenses, commissions, and interest on leverage. For equity-based funds, especially in high-growth sectors like technology, the NII is not very relevant. However, for fixed-income or bond funds like MCI, it is very relevant. The main reason is that 90% of their investment is in debt securities and only 10% in equity portion. So, most of the distributions have to come from investment income and not capital gains.
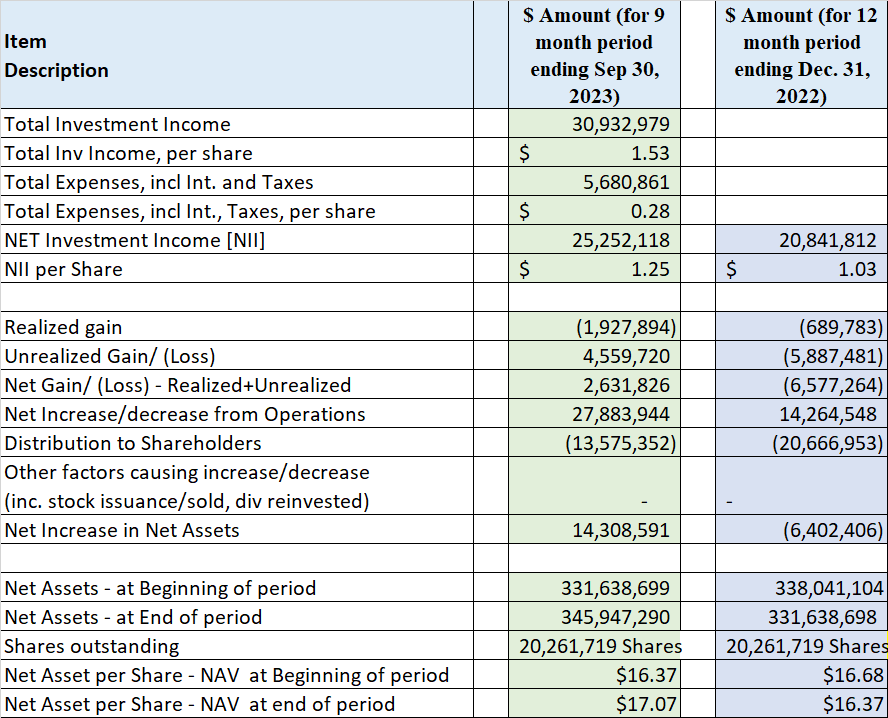
Here is what it looks like in terms of NII, Distributions, and Net Assets at the beginning and end of the statement period.
(all amounts are in US $ (except Shares Outstanding) for the 6-month period; negative amounts are shown inside parentheses, per the Semi-annual report, nine months ending Sep. 30, 2023, and the Annual report, 12-months ending Dec. 2022). However, we recognize that it is not a one-to-one comparison because of the asymmetry in the two reporting periods. However, per share data, the period is not relevant.
Table-2:
Data source: MCI's 2023 9-Months-Report and 2022 Annual Report.
Distributions:
MCI provides a quarterly distribution of $0.38 per share, which comes out to be a yield of 8.41% at current prices (as of 01/17/2024) and 8.90% on the NAV (as of 09/30/2023). It has paid the distributions on a quarterly basis since inception. Its distribution policy is to distribute most of its NII (net investment income). That means, it must adjust the distribution rate up or down frequently. It has been raising the distribution rate every quarter since mid-2022. However, it reduced the distribution amount back in 2020 during the pandemic. Incidentally, it did not cut the distribution during the 2008-2009 financial crisis.
So, is the distribution covered?
MCI is a high-yield debt fund. For most fixed-income types of funds, it is very important that they earn enough (or nearly enough) in NII (net investment income) to pay most of their distribution obligations. Sure, they can adjust the distribution amount up or down based on the NII, and that's what MCI does as well. However, it is a fact that most income investors don't like distribution cuts, so the management must navigate this carefully.
MCI's management has done a fairly good job managing the income over the years. But more than that, they have done a fabulous job of maintaining and increasing the NAV consistently. The fund started with an NAV of $23 in 1971. Subsequently, in 1998 and then again in 2011, it underwent split on a two-for-one basis. Today, the NAV is over $17. This is in addition to the high distribution it has paid all these years.
It employs only about 10% leverage to enhance the income. Let's look at the most recent report that we have available, ending on Sep. 30, 2023, for the first 9-months of 2023. We can see from Table-2 that the fund generated $1.53 per share in total investment income (for a nine-month period) but spent nearly $0.28 on the fund's expenses, leaving $1.25 per share for the distributions. Usually, in a 9-month period, it should pay three quarterly distributions; however, due to some specific timing, it only paid two quarterly payments of a total of $0.62 per share. However, $1.25 of NII was sufficient to pay three quarterly payments as well. So, the distribution is fully covered. Also, if we look at the distribution reports on the fund's website, we find no evidence of any ROC (return of capital) being paid.
Since its inception over 50 years ago, the fund has gone through many market conditions and many upheavals. We can only judge the management from its past record; it appears they have done a very good job over the years.
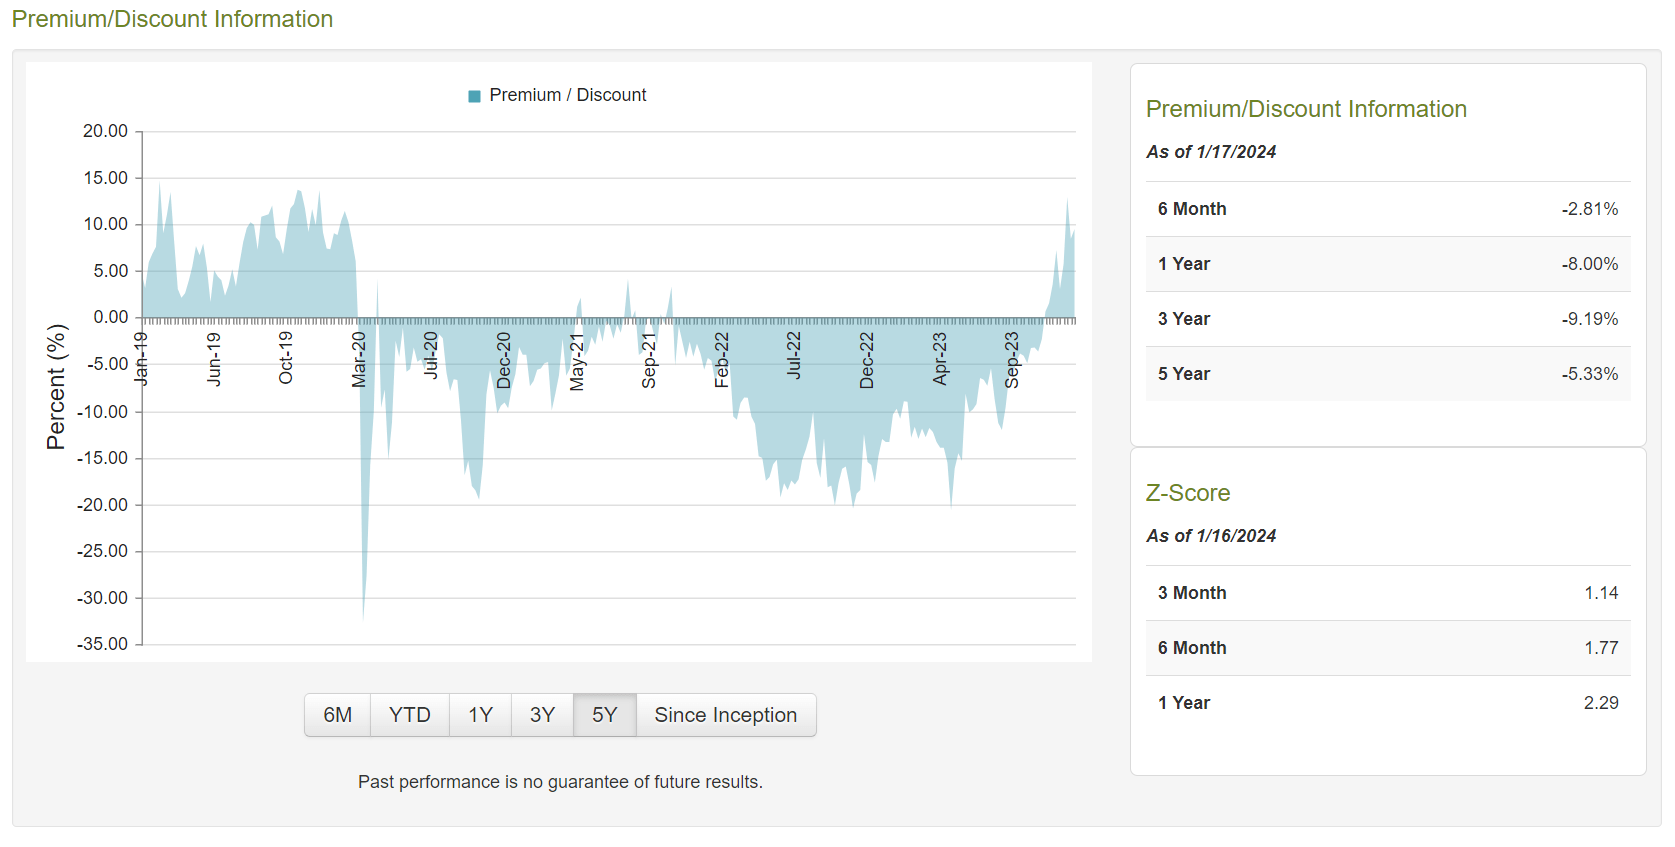
Discount/Premium:
The fund is currently trading at a premium of +10.72% (to its NAV). But if you look at its 3-year history, it has traded at an average discount of -9.19%%. So, the market price has basically moved from -9% (discount) to +10% (premium); in that sense, it is quite expensive. However, we should always look at both the premium/discount and the overall valuation of the fund within its sector.
Chart-2: MCI – Premium/Discount Chart
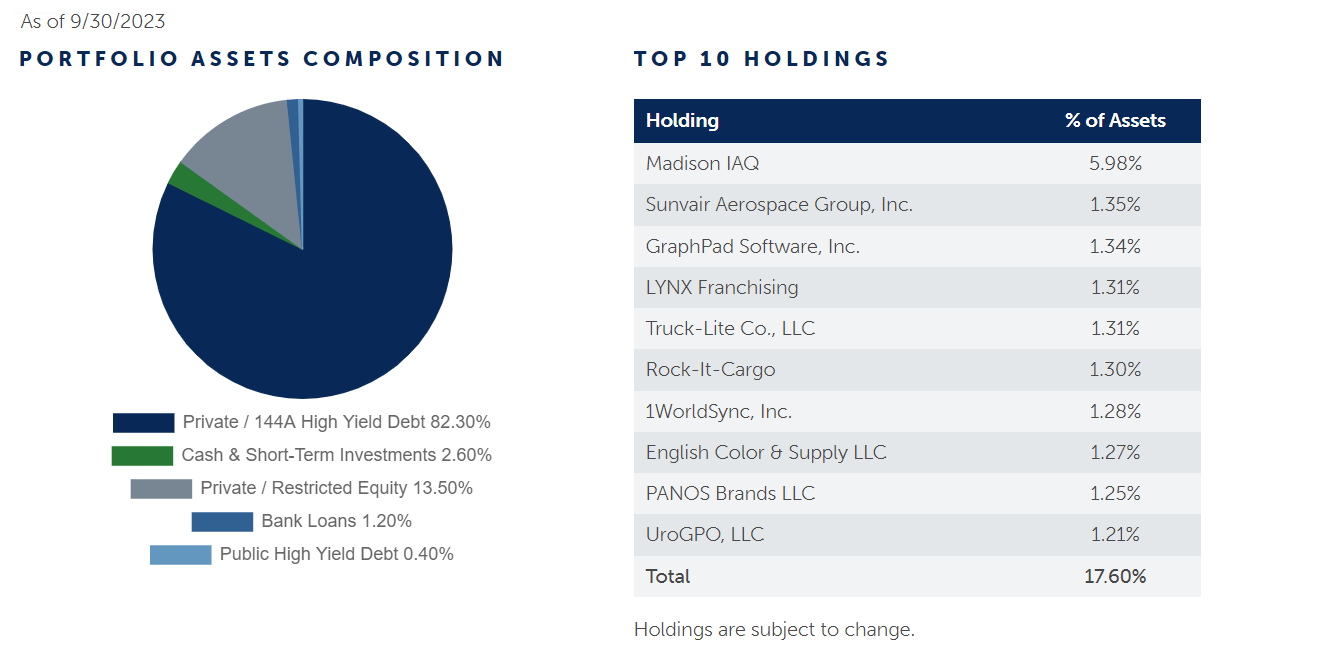
Funds Holdings:
The fund is fairly diverse and had 339 positions/securities as of Sep. 30, 2023. As we already know, the fund is invested mostly in the U.S. based private companies. With over 300 holdings, it is highly diversified, and the top 10 holdings make up only 17.60% of the total assets. The top 10 holdings and asset composition as of Sep. 30, 2023 (taken from Barings.com ) are presented below.
Chart-3:
Performance and Valuation:
If you are looking for high income and decent total returns, you are looking at the right fund. In fact, for most periods, MCI has either matched or outpaced the S&P 500 in total returns. Only in the last decade or so the S&P 500 outperformed MCI. However, since 2021, MCI has again outperformed the S&P 500. All that said, please note the S&P 500 is not the benchmark for MCI. In the table below, we have also included benchmarks for MCI, namely SPDR Corporate High Yield Liquid Bond ETF (JNK), iShares Corporate High Yield Bond ETF (HYG); however, JNK's and HYG’s histories only go back to 2008.
All that said, the long-term performance of MCI has been very impressive. Let's see how it compares over the last 40, 30, 10, 5, and 3 years with the S&P 500, JNK, and HYG (JNK, HYG performance from 2008-2023 only).
Table 4: (Data - period as specified, if not specified then as of Jan. 17, 2024)
| Item Desc. |
| MCI |
| JNK |
| HYG |
| S&P 500 |
| Annualized Return [CAGR] From 2008-2023 |
| 9.43% |
| 4.55% |
| 4.69% |
| 9.69% |
| Annualized Return [CAGR] From 1995-2023 |
| 15.81% |
| N/A |
| N/A |
| 10.35% |
| Annualized Return [CAGR] From 1985-2023 |
| 18.26% |
| N/A |
| N/A |
| 11.29% |
| Dividend Yield% (as of 01/17/2024) |
| 8.41% |
| 6.36% |
| 5.78% |
| 1.40% |
| Max. Drawdown (2008-2023) |
| -38% |
| -36% |
| -30% |
| -49% |
| Std. Deviation (2008-2023) |
| 18.73% |
| 12.01% |
| 10.94% |
| 16.22% |
| 10-Year CAGR |
| 10.10% |
| 3.22% |
| 3.42% |
| 11.88% |
| 5-Year CAGR |
| 12.75% |
| 4.35% |
| 4.19% |
| 15.53% |
| 3-Year CAGR |
| 20.60% |
| 0.87% |
| 0.99% |
| 9.85% |
| Fees (excluding interest) |
| 1.64% |
| 0.40% |
| 0.49% |
| 0.09% |
| Leverage |
| 10% |
| 0% |
| 0%1 |
| 0% |
| No of holdings |
| 339 |
| 1136 |
| 1189 |
| 504 |
| Assets |
| $389 Million |
| $9.2 Billion |
| 18.02 Billion |
| $484 Billion |
Note: Some of the data (e.g., number of holdings and leverage) may not be current as of Jan. 17, 2024.
Now, the past performance looks very good, especially long-term past performance. What about the future? After all, we would be investing today for the future performance. In the last two to three years, we have had high inflation and a high interest rate regime. The high-interest rates suppressed the valuation of all kinds of assets, but it was particularly hard on debt securities and bonds. Though MCI's NAV suffered in 2022, it rose in the first nine months of 2023. Throughout 2023, MCI has raised its distribution payout every quarter. This is probably the result of the higher income that the fund is earning due to high-interest rates (due to high exposure to floating-rate securities). Since it carries only 11% leverage, it was earning much more from its floating-rate securities than it was paying on the leverage. Since now, more than likely, we have reached the peak interest rates, and even if there is no immediate cut in March 2024, there is not likely to be any further increase. As the interest rates start declining, it will give a boost to valuations of the debt and bond assets. It will also mean that there will be less of a chance of client defaults, even though the MCI record on this count is outstanding as well. But at the same time, their investment income may come under pressure to some extent.
Long story short, we believe the reason for the recent surge in the premium (market price minus NAV) is that the market is expecting MCI's NAV to show a decent amount of appreciation in its annual report. Currently, the published NAV is dated to Sep. 30, 2023. For these reasons, we believe that MCI is close to being fairly valued in spite of the 10% premium.
Risk Factors:
Investors need to be aware of certain risk factors that are associated with this fund and CEFs in general. Risk factors could be summarized as follows:
- MCI's near to mid-term future performance may be somewhat impacted by the movement of interest rates. However, as of now, all indicators and expectations are pointing to interest rates going down in 2024. This will help boost the valuation of the fund's underlying assets. Lower interest rates will also lower the interest expense on its leverage amount.
- This is a fund that announces its NAV (net asset value) only once a quarter. So, it is more of a guessing game for the rest of the quarter. The premium/discount is also calculated based on a dated NAV. So, for example, it is trading at a 10%+ premium today based on the NAV as of Sep. 30, 2023.
- If high interest rates somehow were to rise from here or stay higher and longer than expected (there is at least some possibility), then that would be a headwind for the fund.
- The general risks such as the geopolitical situation.
- The possibility of occurrence of a recession in 2024, though most market participants are expecting a shallow one if that happens.
Concluding Thoughts:
If you are a retiree or less than five years away from retirement, and you need your capital to earn you 8% plus income yield, then MCI is a perfect income vehicle. Sure, past records do not guarantee anything, but if it is any indication, you can't go wrong with this fund. The only problem is that it is trading at a relatively high premium currently. Due to the high premium, you are basically paying one year's worth of distribution in premium. We see some reasons to believe that the fund's NAV may have increased significantly since Sep 30, 2023, but we should tread the water carefully and not go all in at this stage.
If you are a new buyer, you could buy the first lot of shares as a placeholder to monitor. Eventually, the premium should come down, and that may be a good time to add more shares. Though this fund is paying over 8% yield, we recommend reinvesting at least 2-3% back into the fund. The existing owners should hold the shares as we consider this to be a long-term holding that should serve its owners well.
For further details see:
MCI: Best Of Both Worlds - Solid 8.4% Income And Capital Appreciation