MCI - MCI Vs. PTY: Outclassed
2023-09-19 10:00:00 ET
Summary
- Barings Corporate Investors focuses on privately-placed, below-investment grade debt investments with occasional equity attributes.
- PIMCO Corporate and Income Opportunity Fund has a similar goal of maximizing total return through a dynamic asset allocation strategy.
- We compare the 2 high-yield funds and tell you why one is a clear winner.
Barings Corporate Investors ( MCI )
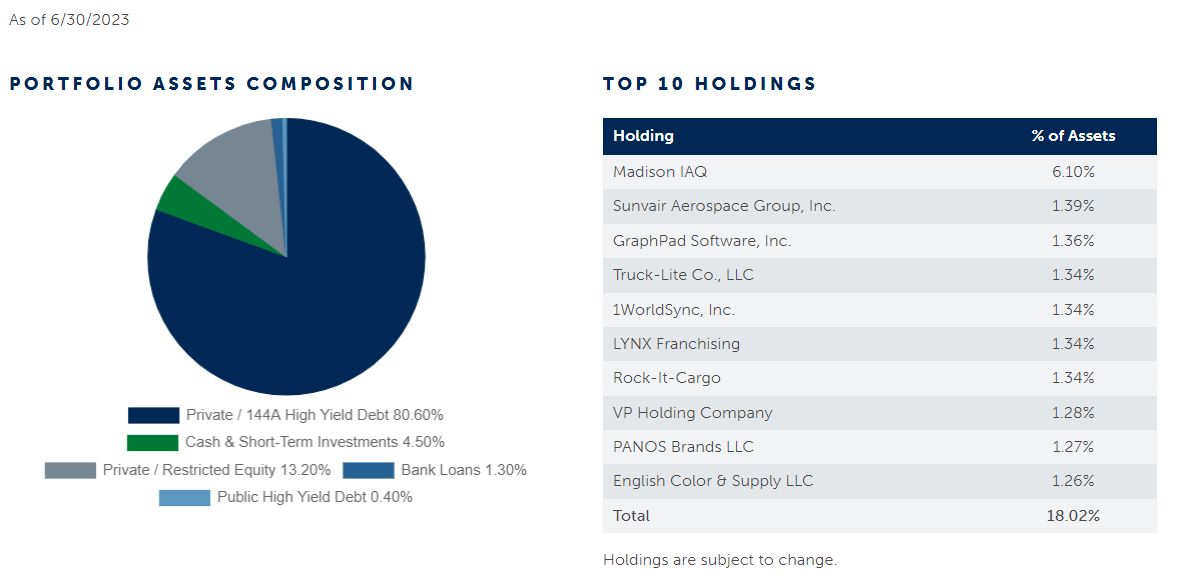
The MCI portfolio primarily comprises of "privately-placed, below-investment grade, long-term debt obligations". Occasionally, equity attributes such as warrants, conversion rights and preferred stock are tacked on to MCI's debt investments. From time to time, the fund also makes short term investments in other marketable securities, of both investment grade and high yield kind. This closed end fund aims to provide a steady yield, along with capital gains to its investors, in other words, the focus is on the total return. While the numbers are a bit stale dated, the portfolio composition and top 10 holdings as at June 30, 2023, give a glimpse of the process in action.
The top 10 made up close to a fifth of the portfolio, with the concentration in the number one pick forming a major chunk of that. We see the same pattern in the industry level allocation as of that date, with the technology sector outpacing the second incumbent, diversified manufacturing and the rest, by a huge margin.
MCI Website
PIMCO Corporate and Income Opportunity Fund ( PTY )
PTY also has a goal similar to MCI. Its website has a good summary of its purpose of maximizing total return, along with the strategy it employs to achieve it.
Using a dynamic asset allocation strategy that focuses on duration management, credit quality analysis, risk management techniques, and broad diversification among issuers, industries and sectors, the fund seeks maximum total return through a combination of current income and capital appreciation.
While MCI investments are primarily of the private kind, PTY has primarily stuck with public markets, though it can and does invest in private assets. The fund invests in corporate and non-corporate debt securities, which includes US government securities, municipal securities, mortgage and asset backed securities from both the public and private sphere. We can see the variety reflected in its August 31, 2023, sector allocation.
PTY Website
The fund also has the leeway to seek its total return in non-USD denominated and emerging market securities. It has not strayed far from its roots, as evident from the August 31 numbers.
PTY Website
In PTY's case, the industry allocation is more evenly divided at the top, with the health care sector at the forefront, followed by technology.
PTY Website
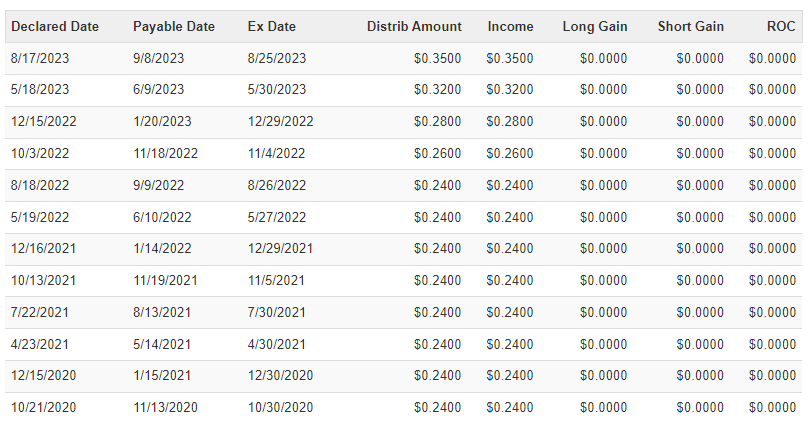
MCI has been raising its distributions at a brisk pace over the last year and currently pays 35 cents/quarter.
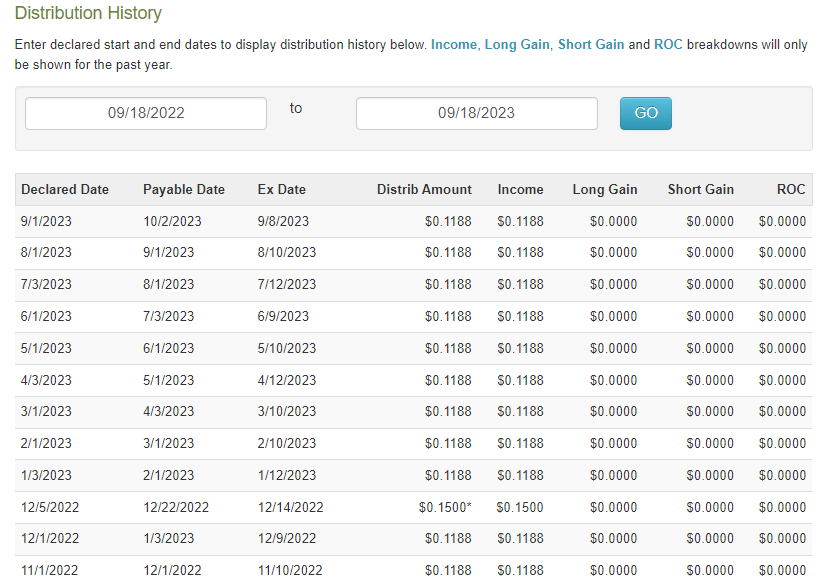
At the current price of $15.53, it yields around 9.0%. PTY on the other hand distributes, 11.88 cents on a monthly basis, coming out slightly ahead of MCI on a quarterly basis and does provide a higher yield.
PTY even threw in a special distribution in December of last year. The yield on PTY's current price of $13.79 is around 10.34%.
Now that we have introduced our two protagonists, we will go ahead and compare the two in terms of leverage, premium/discount to NAV and total returns on NAV. What we hope to show from this exercise is how all three work in favor of MCI, despite PTY being the fan favorite.
Leverage
A lot of funds employ leverage to boost their returns. The rationale is to take advantage of the spread between the cost of borrowing and the investment returns. This strategy works brilliantly when the interest rates are low, which has been the case for majority of the last decade. More recently though, rising rates have demonstrated the flipside of leverage. Investment income cannot keep up with the rising borrowing costs, resulting in leveraged funds dipping into the NAV or return of capital to maintain distributions.
Recent numbers show MCI's borrowings to be close to 11% of the total investments.
MCI - CEF Connect
The impact of the interest expenses on the annual expense ratio noticeably rose for 2022, as reflected on its 2022 Annual Report.
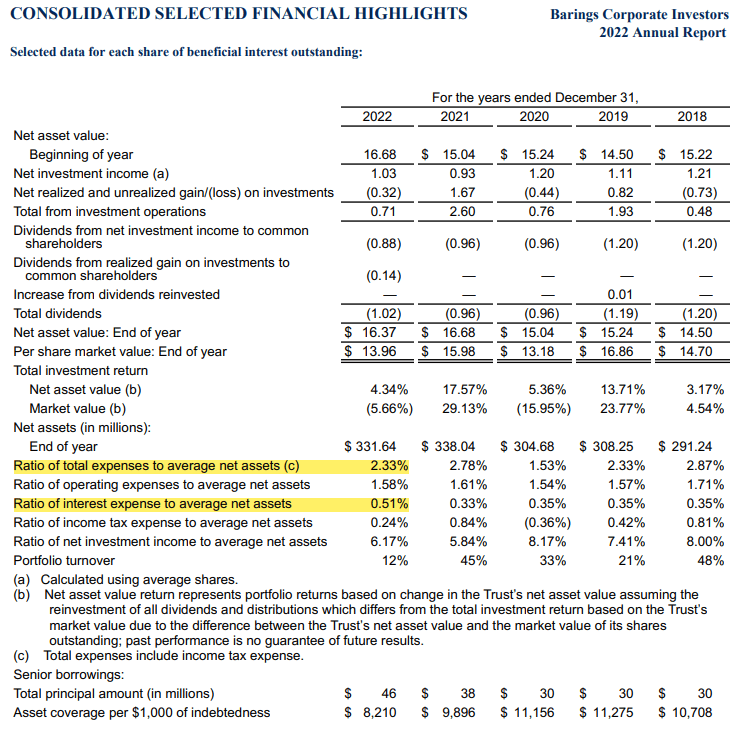
PTY employs higher leverage than MCI, with it being close to a fourth of its total asset value at last check.
PTY - CEF Connect
The annual report dated June 30, 2023, shows that the leverage costs even outpace the management fees, making the annual fund expenses a whopping 3.70%.
PTY - 2023 Annual Report
Premium/Discount to NAV
Investors, on the whole, display an affinity towards monthly versus quarterly distributions. That coupled with a double-digit yield, makes them weak in the knees when it comes to PTY. As a result, PTY has traded at a premium to its net assets for the last few years, going as high as 50% in 2021.
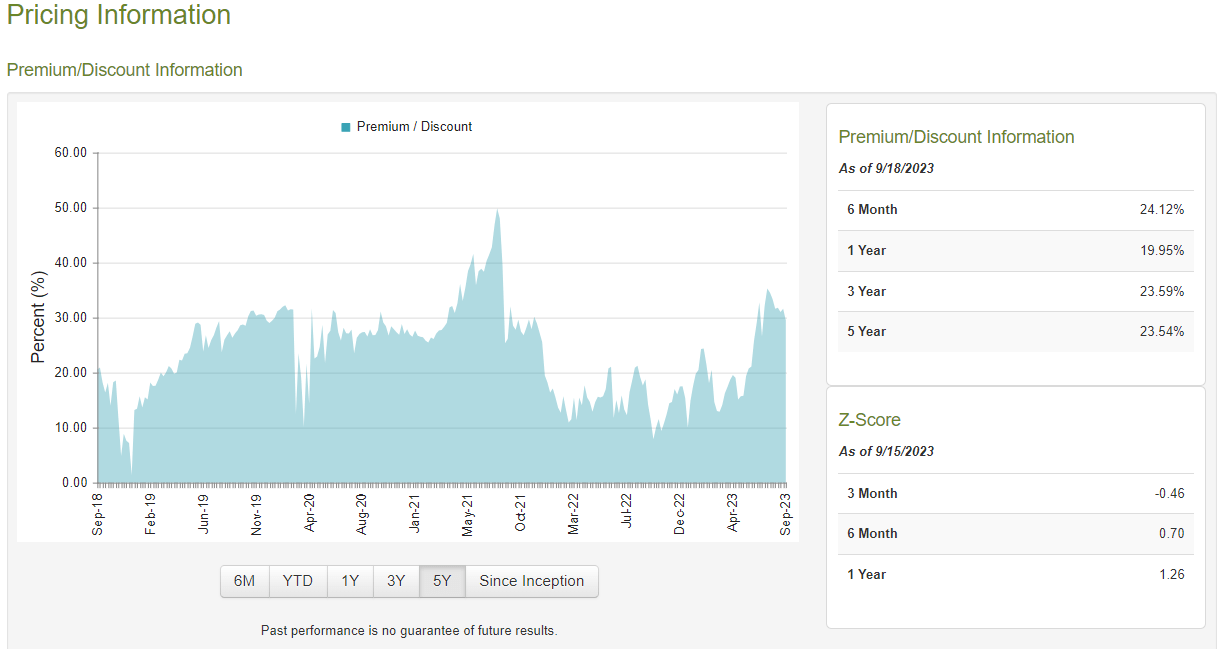
MCI on the other hand as "enjoyed" the opposite for most of the same timeframe.
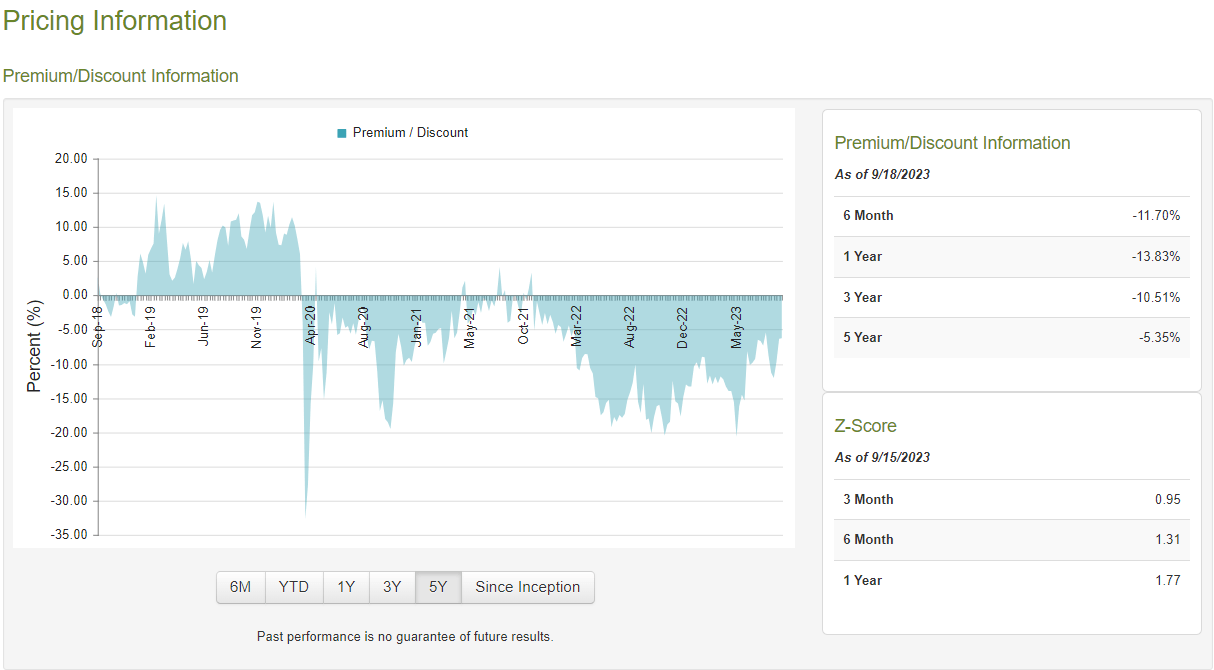
MCI does not release its NAV that frequently so the exact discount or premium to NAV is bit of a guess. The last NAV release date was June 30, 2023. Since MCI uses very little leverage, we can assume its NAV is in the same ballpark considering SPDR Bloomberg High Yield ETF ( JNK ) is basically unchanged since then.
So you are getting MCI at a discount, a real one at that.
Total Returns on NAV and Price
Investors have piled into PTY, buying it for an undeserving premium. Despite that, MCI has beaten its total return on price in the 1, 3 and 5 year time frames.
MCI - CEF Connect PTY - CEF Connect
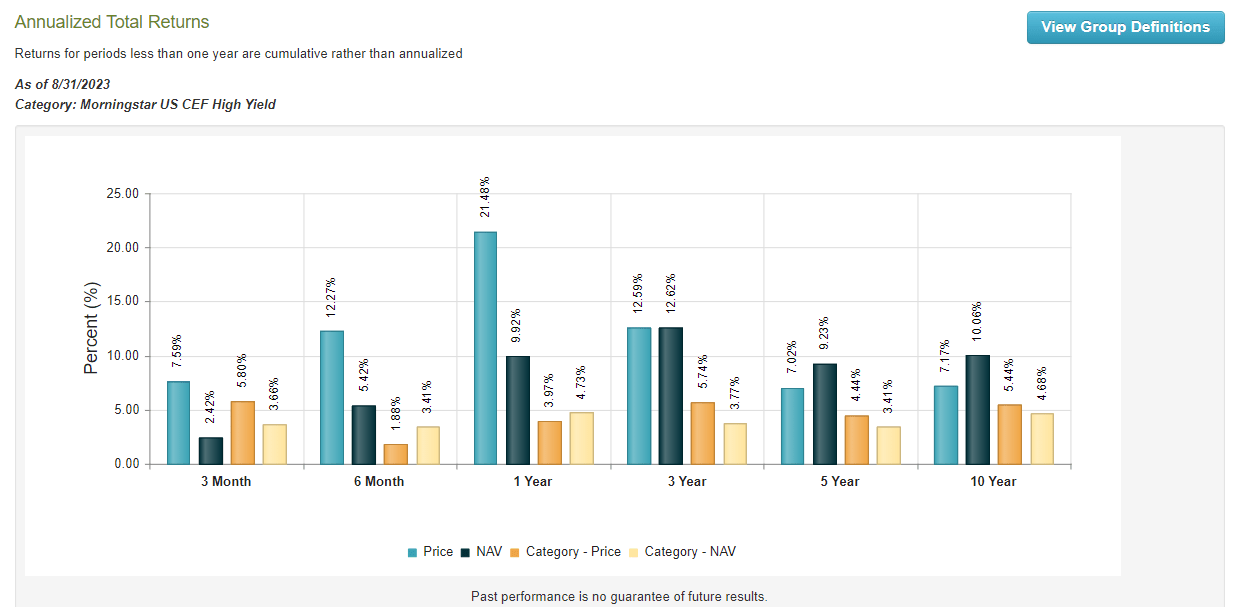
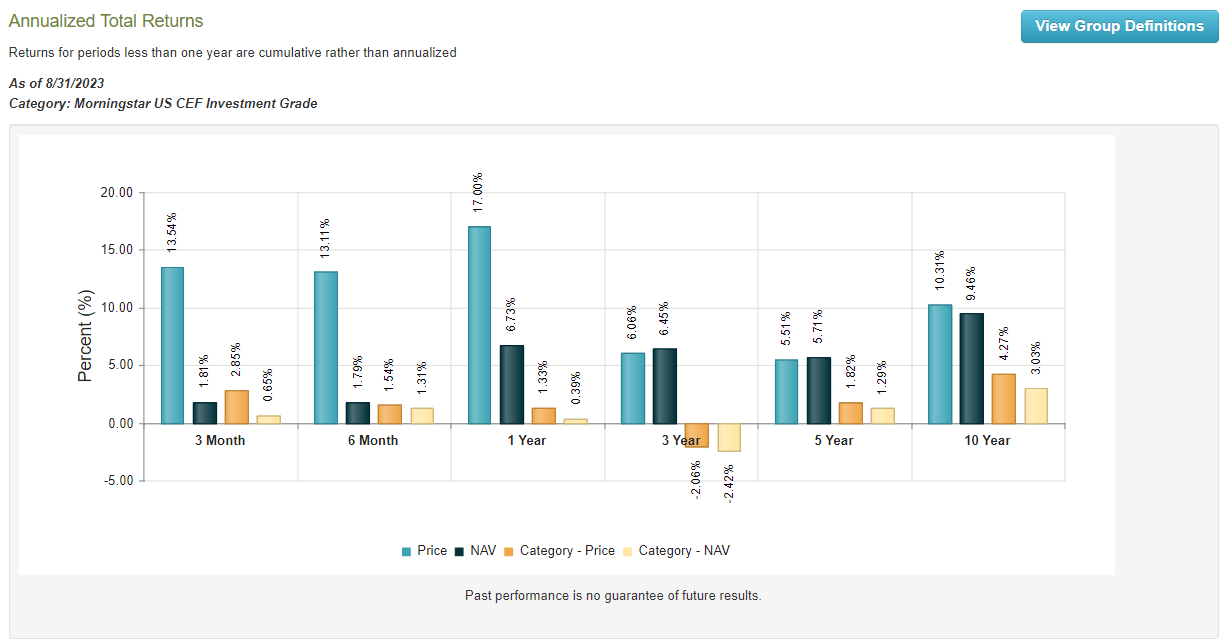
Now, total return on price is impacted, by changes in premium or discounts over the timeframe. The real test is total return on NAV, and there is no competition. MCI wins on 1, 3, 5 and 10 year timeframes.
Verdict
PTY employs a higher leverage than MCI, but has still not managed to outperform MCI in any significant time interval. The biggest gripe we have here though is the premium. PTY trades at a very underserved premium and MCI is being given away. In fact, a plot of the spread between their premium/discount paints an interesting tale.
What if this chart normalizes to "0" above? What if MCI trades at a big premium while PTY goes to a discount? Certainly the performance warrants it.
Any way you look at it, when the PTY premium unravels, it will be painful for the loyalists. But then again, we have encountered a lot of commentators on this platform over the years, that do not care if their capital is eroded. Monthly distributions is all that matters to them. Back in 2021, PTY cut its distributions from 13 cents to the 11.88 cents that it is now at. Investors piling in now, will definitely have the pleasure of the premium unwinding at some point and NAV losses and distribution cuts are high probability events in the next recession. MCI has a large margin of safety, outclasses PTY at this point by a mile and that should be the one to consider for investors.
Please note that this is not financial advice. It may seem like it, sound like it, but surprisingly, it is not. Investors are expected to do their own due diligence and consult with a professional who knows their objectives and constraints.
For further details see:
MCI Vs. PTY: Outclassed