V - MDA Breakout Stocks Week 4 - January 2023: High-Frequency Gainers To Give You An Edge
Summary
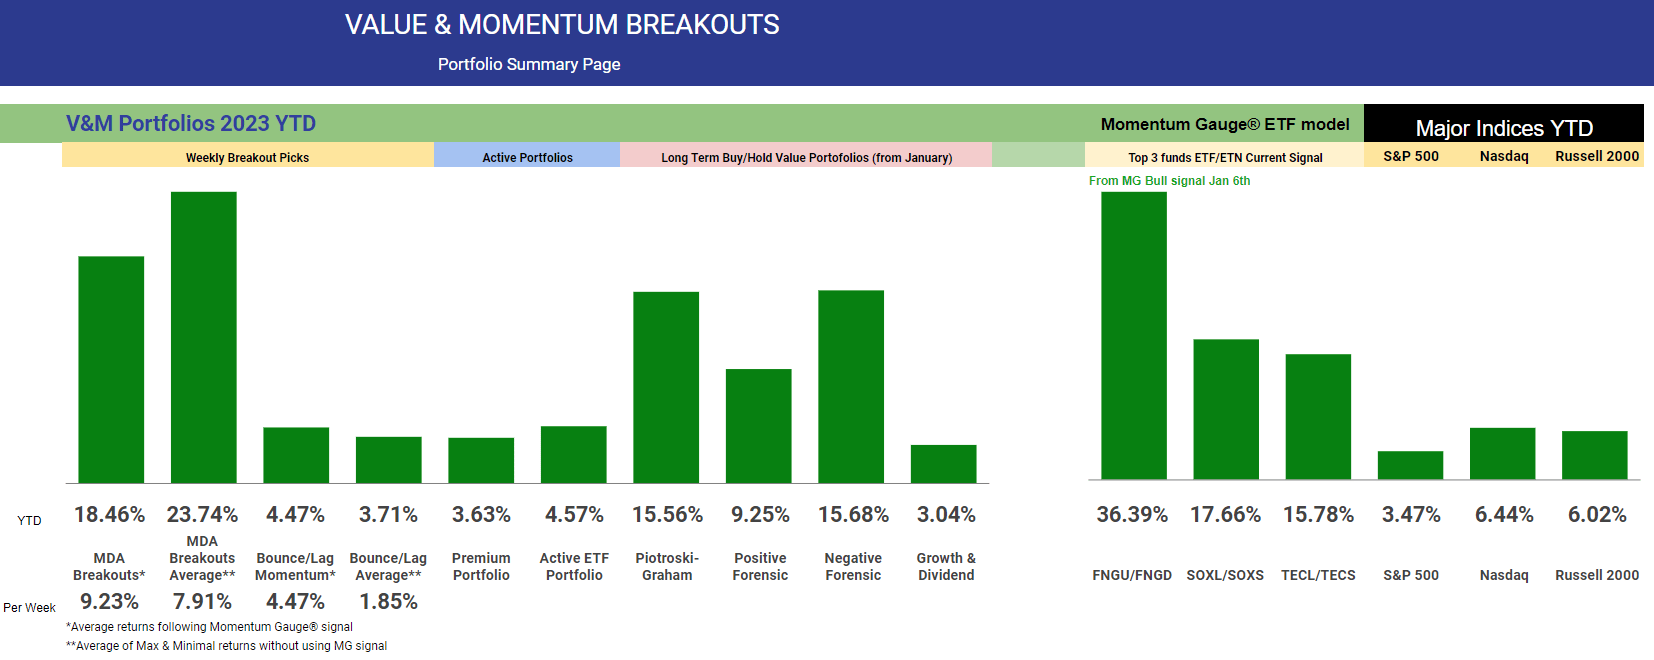
- Two new Breakout Stocks for Week 4 with better than 10% short-term upside and two Dow 30 Picks. Average cumulative returns for 2023 are +23.74% YTD.
- This week, 3 of 4 high-frequency breakout picks gained over 10% in less than a week with peak gains in FAZE +22.8%, ZYME +15.9%, GOTU +10.5% and extreme volatility.
- The streak of weekly picks gaining over 10% in less than a week has increased to 237 out of 296 trading weeks (80.0%) not including multiple gainers or warning signals.
- Annual returns are simulated by adding 52 weekly selections, though they could be compounded weekly. Top annual gainers have joined the growing multibagger list.
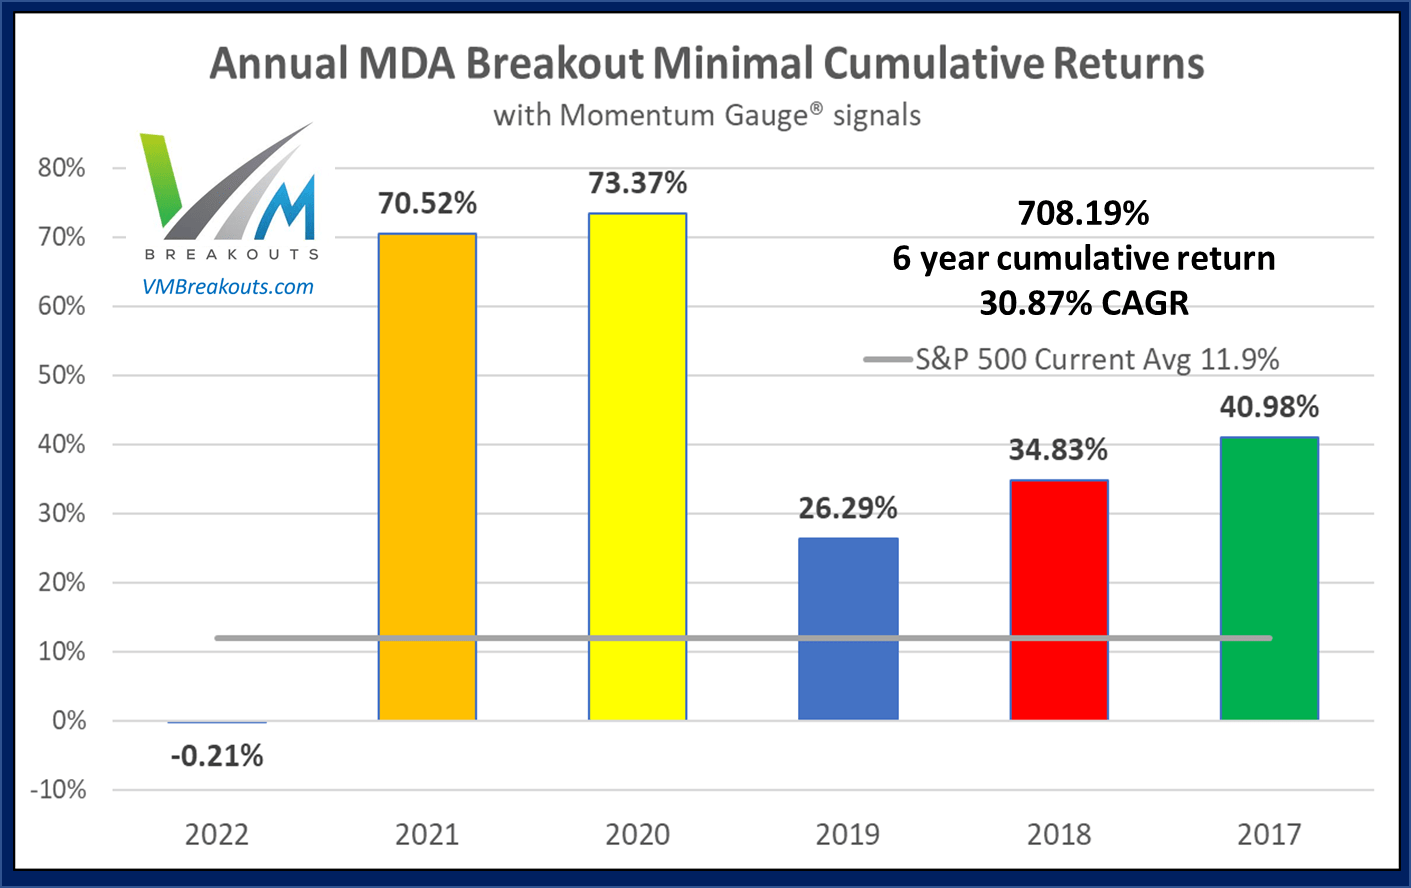
- The MDA breakout picks continue to beat the S&P 500 into 7 consecutive years delivering +708.2% compound returns through 2022 and a CAGR +30.87%.
Introduction
The Weekly Breakout Forecast continues my doctoral research analysis on MDA breakout selections over more than 8 years. This high frequency breakout subset of the different portfolios I regularly analyze has now reached 290 weeks of public selections as part of this ongoing live forward-testing research. The frequency of 10%+ returns in a week is averaging over 4x the broad market averages in the past 5+ years.
In 2017, the sample size began with 12 stocks, then 8 stocks in 2018, and at members' request since 2020, I now generate only 4 selections each week. In addition 2 Dow 30 picks are provided using the MDA methodology, but I highly recommend the monthly Growth & Dividend mega cap breakout portfolios if you are looking for larger cap selections beyond only 30 Dow stocks.
As long-term investors know , you can compound $10,000 into $1 million with 10% annual returns in less than 50 years. This model serves to increase the rate of 10% breakouts into 52 weekly intervals instead of years. In 2022, the worst market since 2008: 113 MDA picks gained over 5%, 52 picks over 10%, 22 picks over 15%, and 13 picks over 20% in less than week. Since weekly selections began in 2017 more than 450 picks have gained over 10% in less than a week from release to members every Friday.
2023 Market Outlook
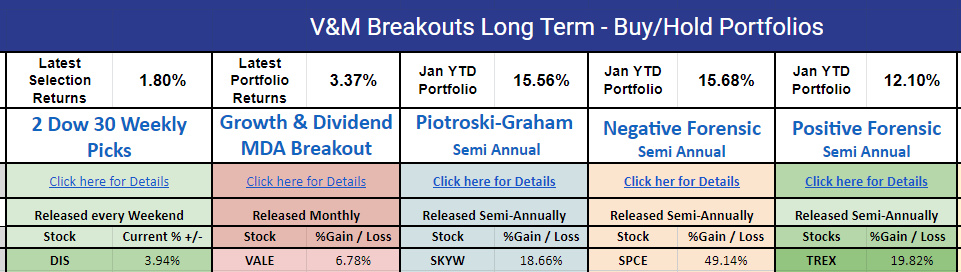
All new long-term portfolio selections for 2023 have started!! See the individual stock release articles for more details. So far the long-term portfolios are also beating major indices.
My strategy for 2023 is to stay bullish on China as the largest economy still in QE and stimulating their markets, while all other major economies are in QT fighting inflation. I plan to overweight US treasuries/bonds as explained in the 2023 technical forecast article while remaining cautious on US stocks following the gauge signals. As I wrote this week about a February market reckoning , I have become more bearish on US markets as we approach February cyclical pattern and Fed FOMC rate hike on Feb. 1st.
Mid-year 2023 is where things may get interesting with potential for a Fed pivot. Dip-buyers will continue to try to pull this anticipated pivot event forward in time extending high market volatility while the Fed hikes rates. Mid-year I also plan to leverage strong results from a new June Russell Reconstitution anomaly we found last year that is actively tracked on the dashboard: FTSE Russell Reconstitution Anomaly Study - Strong +22.7% Difference After 5 Months
The schedule of reports and forecast articles for 2023 are here for your benefit.
- Article Schedule for 2022/2023
- The Best Portfolio Models since 2007 compared to Value & Momentum Portfolio Models YTD
- Forecasting The S&P 500 For 2023: Year Of The Fed-Pivot And More Record Volatility ( SP500 ).
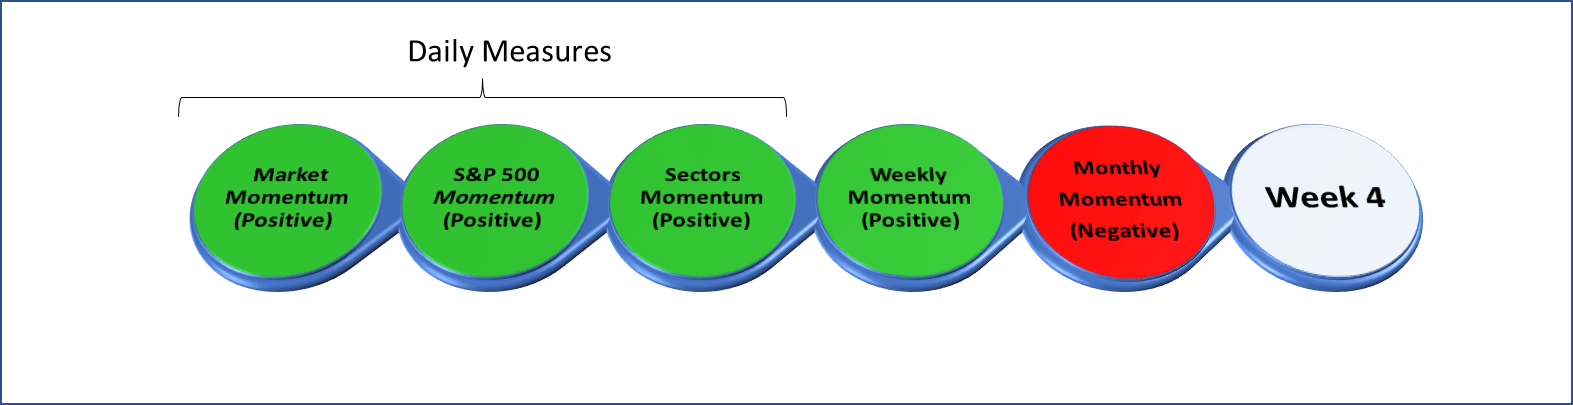
Momentum Gauges® Stoplight ahead of Week 4
All the Daily Momentum Gauges continue positive this week after peaking at the highest levels since August 2022 in what may have been a market top on Jan. 17th. The weekly gauge continues positive and monthly signals remain negative from early December but moving closer to a positive signal.
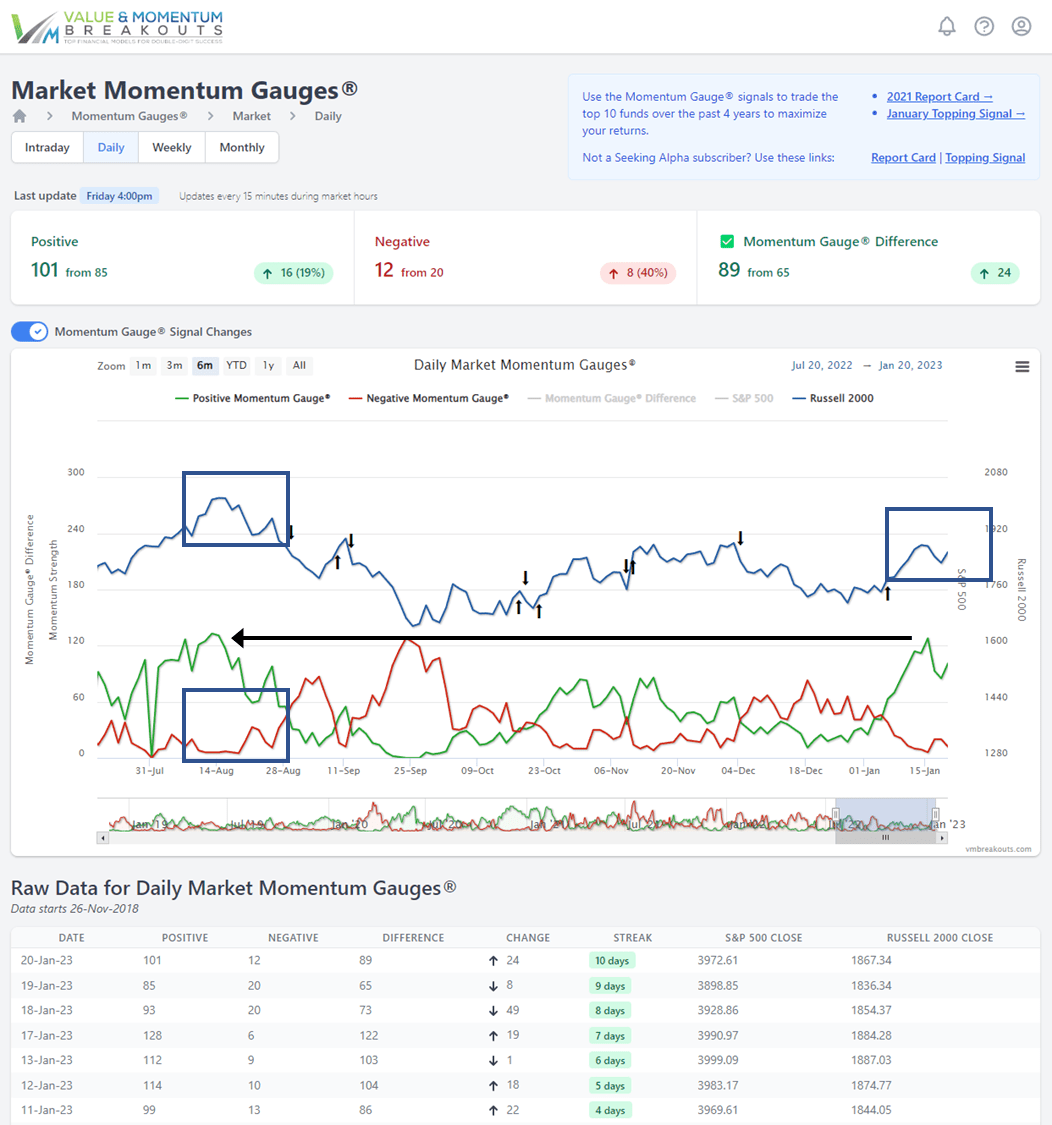
Daily Momentum Gauges continue positive to the highest levels since last August. We have not seen positive gauge levels sustain at these high levels for very long over the past two years. Last year we didn't get an official negative signal until after the market had a short bear rally then dropped very sharply. There may be strong similarities in the gauges with the August 2022 peak and high volatility.
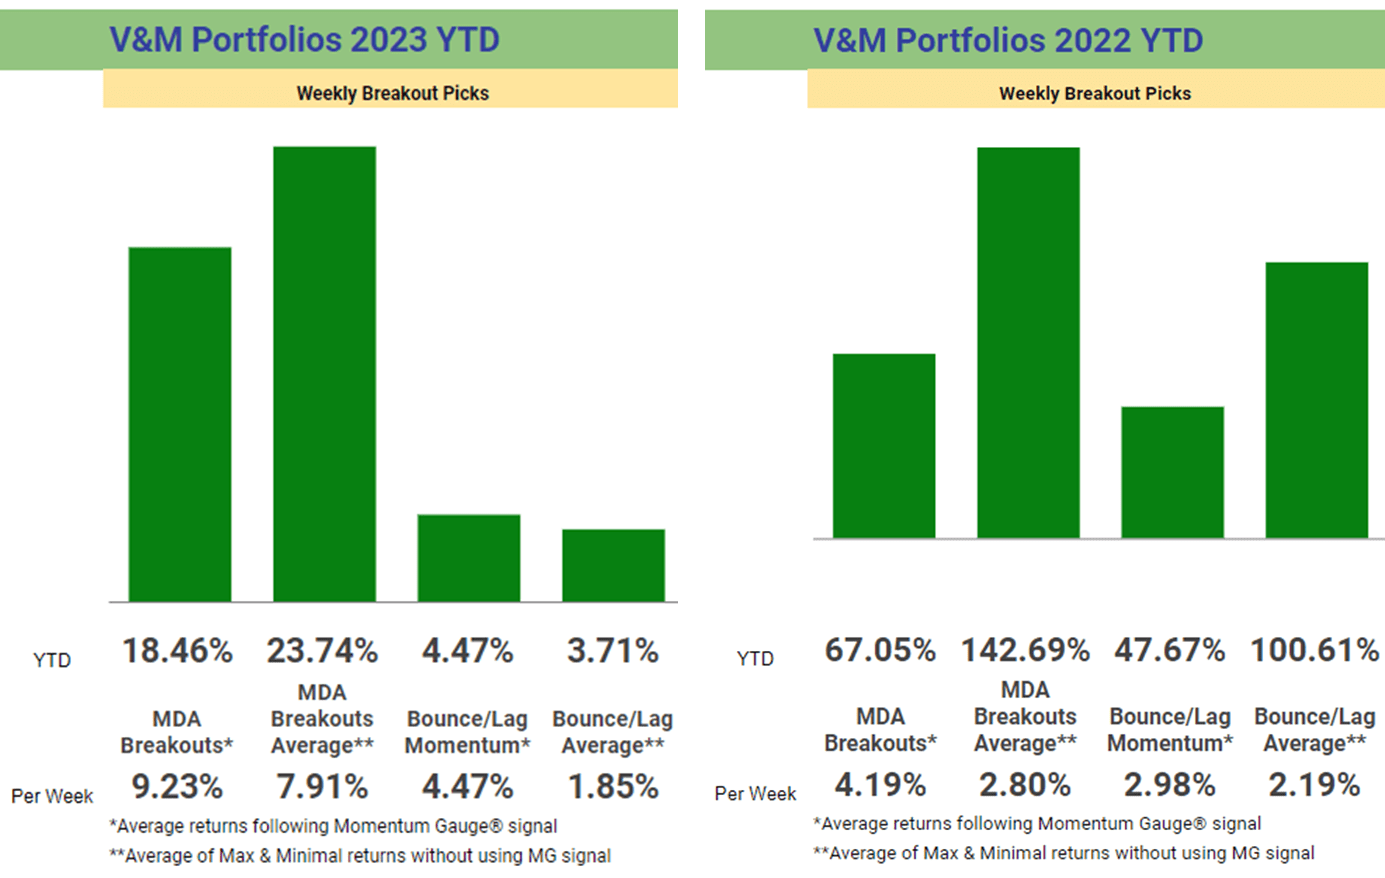
Weekly Breakout Returns
The two weekly breakout portfolios are shown below with current 2023 returns. The ongoing competition between the Bounce/Lag Momentum model (from Prof Grant Henning, PhD Statistics) and MDA Breakout picks (from JD Henning, PhD Finance) are shown below with / without using the Momentum Gauge trading signal. The per-week returns equalize the comparison where there were only 16 positive trading weeks last year using the MDA trading signal (negative values below 40).
For 2022, the worst market since 2008: 113 MDA picks gained over 5%, 52 picks over 10%, 22 picks over 15%, and 13 picks over 20% in less than week . These are statistically significant high frequency breakout results despite many shortened holiday weeks.
V&M Multibagger List
While not the purpose of my model, longer term (using the trading video in FAQ #20) many of these selections may join the V&M Multibagger list now at 126 weekly picks with over 100%+ gains, 54 picks over 200%+, 19 picks over 500%+ and 11 weekly picks with over 1000%+ gains since January 2019 such as:
- Celsius Holdings ( CELH ) +2,025.1%
- Enphase Energy ( ENPH ) +1,509.1%
- Northern Oil and Gas ( NOG ) +1,115.7%
- Trillium Therapeutics ( TRIL ) +1008.7%
More than 450 stocks have gained over 10% in less than a week since this MDA testing began in 2017. Frequency comparison charts are at the end of this article. Readers are cautioned that these are highly volatile stocks that may not be appropriate for achieving your long term investment goals: How to Achieve Optimal Asset Allocation
Historical Performance Measurements
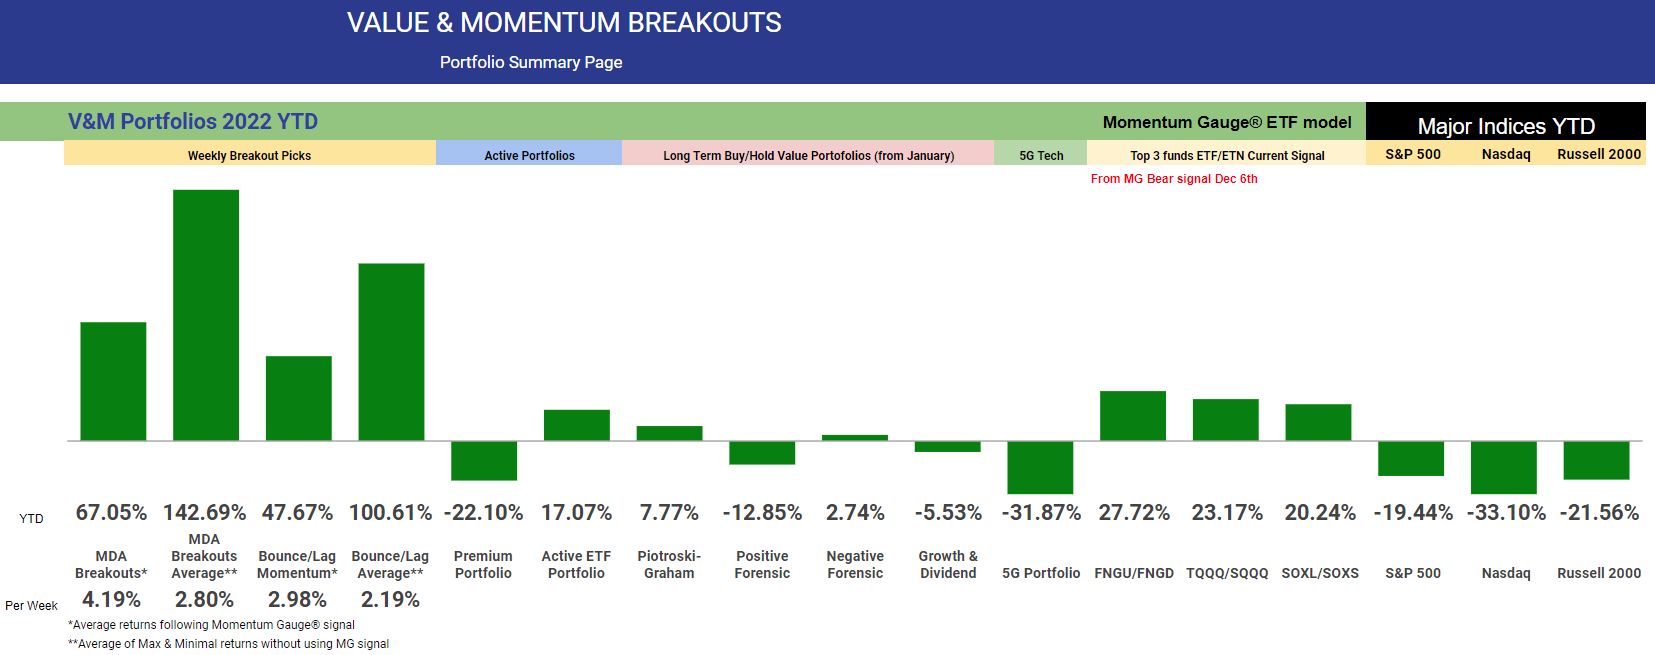
Historical MDA Breakout minimal buy/hold (worst case) returns have a compound average growth rate of 30.87% and cumulative minimum returns of +708.19% from 2017. The minimal cumulative returns for 2022 were -0.21%, average cumulative returns were +67.05%, and the best case cumulative returns were +360.25%. The chart reflects the most conservative measurements adding each 52 weekly return in an annual portfolio simulation, though each weekly selection could be compounded weekly as separate portfolios.
The Week 4 - 2023 Breakout Stocks for next week are:
The picks for next week consist of 3 Consumer Cyclical and 1 Industrial sector stocks. These stocks are measured from release to members in advance every Friday morning near the open for the best gains. Prior selections may be doing well, but for research purposes I deliberately do not duplicate selections from the prior week. These selections are based on MDA characteristics from my research, including strong money flows, positive sentiment, and strong fundamentals -- but readers are cautioned to follow the Momentum Gauges® for the best results.
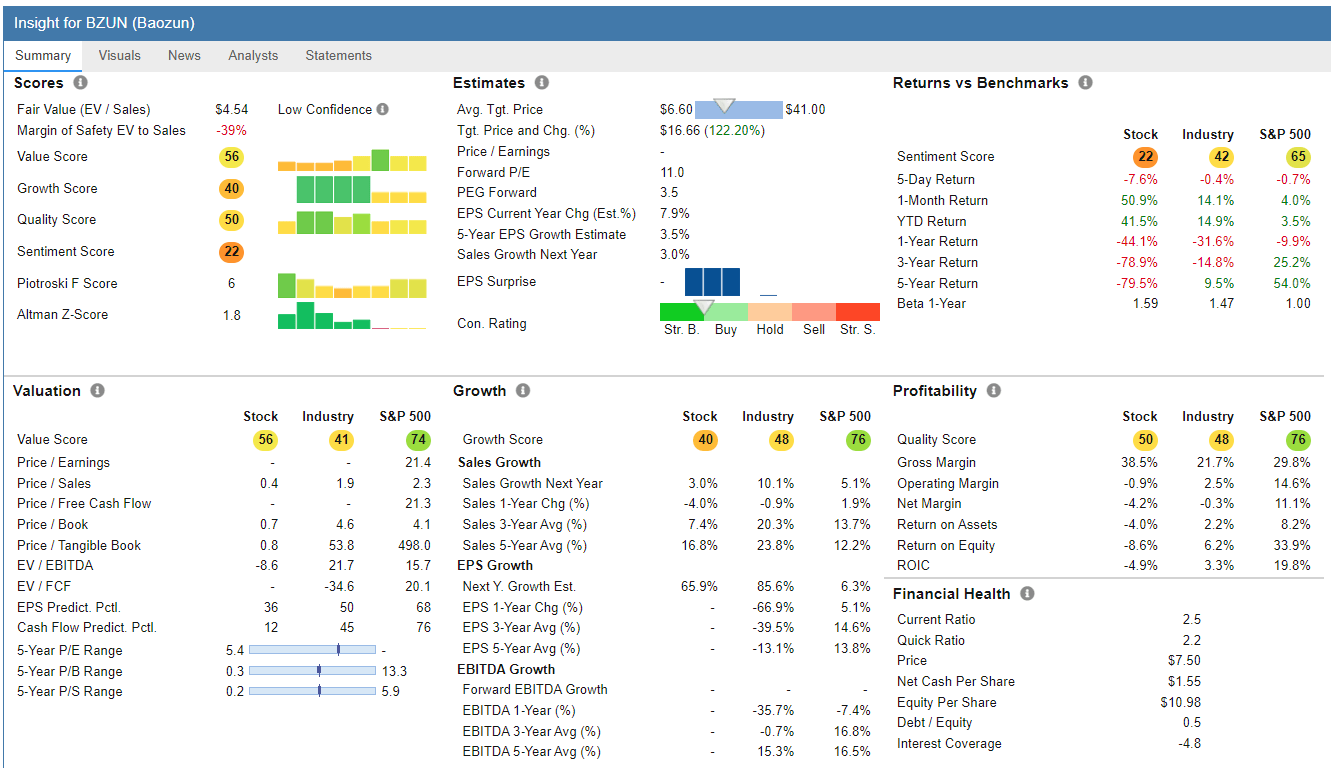
- Baozun Inc. ( BZUN ) - Consumer Cyclical / Internet Retail
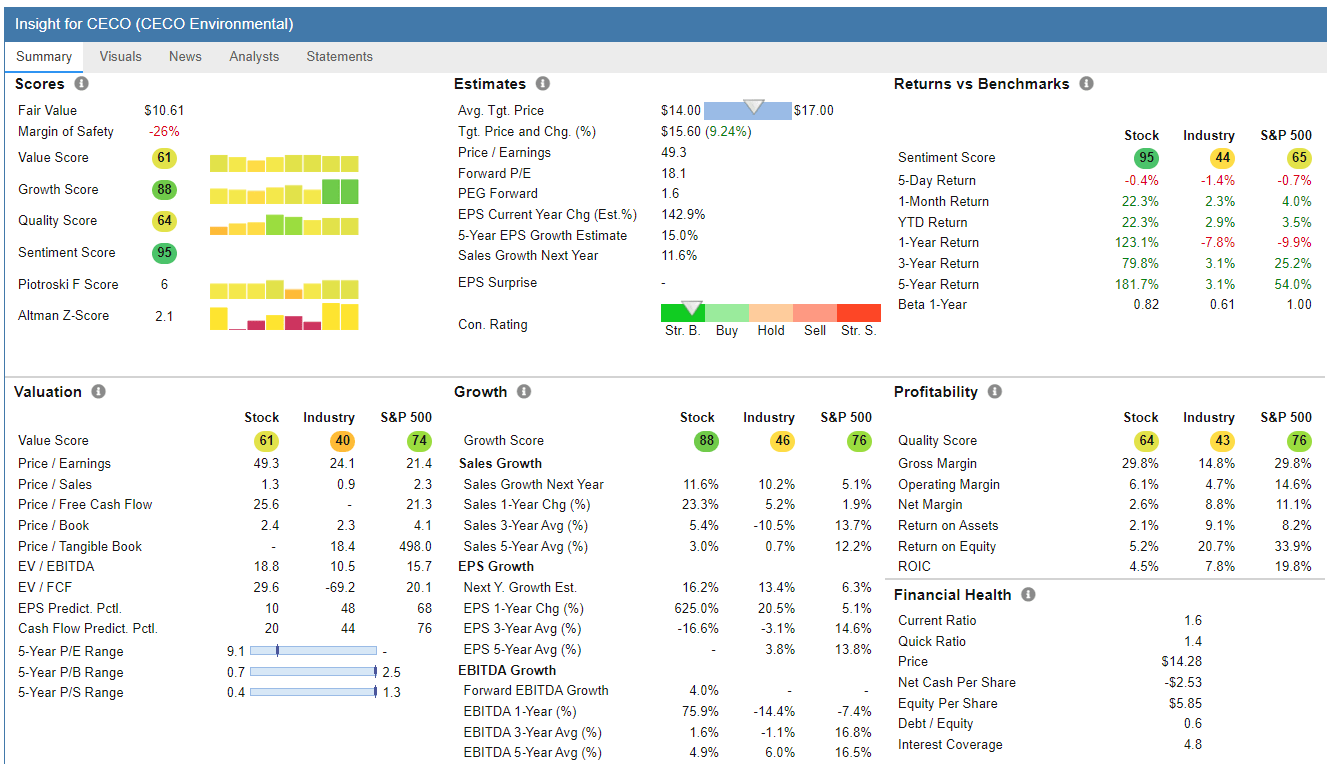
- CECO Environmental ( CECO ) - Industrials / Pollution Treatment
Baozun Inc. - Consumer Cyclical / Internet Retail
FinViz.com
Price Target: $11.50/share (Analyst Consensus + Technical See my FAQ #20)
| Jan-20-23 05:14AM |
| Baozun Inc.'s recent 13% pullback adds to one-year year losses, institutional owners may take drastic measures Simply Wall St. +6.08% |
| Dec-12-22 07:30AM |
| 3 Stocks to Avoid This Week Motley Fool -13.45% |
| Dec-10-22 07:36AM |
| Is Baozun Inc. Trading At A 50% Discount? Simply Wall St. |
| Dec-06-22 07:50AM |
| Baozun Inc. Q3 2022 Earnings Call Transcript Insider Monkey |
| Dec-05-22 07:30AM |
| 3 Stocks to Avoid This Week Motley Fool -5.91% |
| Nov-30-22 12:43PM |
| Why Baozun, Kanzhun, and GDS Holdings Rallied Today Motley Fool +7.96% |
(Source: Company Resources)
Baozun Inc., through its subsidiaries, provides e-commerce solutions to brand partners in the People's Republic of China. The company offers IT infrastructure setup and integration, online store design and setup, online store operations, visual merchandising and marketing campaigns, customer services, and warehousing and order fulfilment. It serves brand partners in various categories, including apparel and accessories; appliances; electronics; home and furnishings; food and health products; beauty and cosmetics; fast moving consumer goods, and mother and baby products; and automobiles.
CECO Environmental - Industrials / Pollution Treatment
FinViz.com
Price Target: $16.00/share (Analyst Consensus + Technical See my FAQ #20)
| Jan-20-23 07:22AM |
| With 57% institutional ownership, CECO Environmental Corp. is a favorite amongst the big guns Simply Wall St. |
| Jan-12-23 12:00PM |
| CECO Moves to Buy: Rationale Behind the Upgrade Zacks |
| 11:40AM |
| CECO vs. CWST: Which Stock Should Value Investors Buy Now? Zacks |
| 09:15AM |
| CECO Environmental Corp. Hits Fresh High: Is There Still Room to Run? Zacks |
| Jan-10-23 07:00AM |
| CECO Environmental Expands Industrial Offering with Acquisition of UK-Based Noise Control Technology Company PR Newswire +13.36% |
(Source: Company Resources)
CECO Environmental Corp. provides industrial air quality and fluid handling systems worldwide. It operates in two segments: Engineered Systems Segment and Industrial Process Solutions Segment. The company engineers, designs, builds, and installs systems that capture, clean, and destroy air- and water-borne emissions from industrial facilities as well as fluid handling, gas separation, and filtration systems.
Top Dow 30 Stocks to Watch for Week 4
First, be sure to follow the Momentum Gauges® when applying the same MDA breakout model parameters to only 30 stocks on the Dow Index. Second, these selections are made without regard to market cap or the below-average volatility typical of mega-cap stocks that may produce good results relative to other Dow 30 stocks. The most recent picks of weekly Dow selections in pairs for the last 5 weeks:
| Symbol |
| Company |
| Current % return from selection Week |
| CAT |
| Caterpillar, Inc. |
| -3.39% |
| ( HD ) |
| Home Depot |
| -4.89% |
| ( NKE ) |
| Nike Inc. |
| +2.88% |
| ( V ) |
| Visa Inc. |
| +4.42% |
| BA |
| Boeing Company |
| +8.54% |
| ( JPM ) |
| JPMorgan Chase & Co. |
| +0.73% |
| CAT |
| Caterpillar, Inc. |
| +5.31% |
| ( CVX ) |
| Chevron Corporation |
| +4.09% |
| ( BA ) |
| Boeing |
| +11.94% |
| ( CAT ) |
| Caterpillar Inc. |
| +7.30% |
If you are looking for a much broader selection of large cap breakout stocks, I recommend these long-term portfolios . The new 2023 selections have been released in the links below to members to start the New Year:
New 2023 Piotroski-Graham enhanced value -
- New January portfolio +15.56% YTD
- 2022 January portfolio beat the S&P 500 by +32.54%
- New January portfolio +9.25% YTD
- January 2022 Positive Forensic beat S&P 500 by +6.59%
- New January portfolio +15.68% YTD
- January 2022 Negative Forensic beat S&P 500 by +22.18%
New Growth & Dividend Mega cap breakouts -
- New January meg cap portfolio +3.04% YTD not including dividends
- January 2022 portfolio beat S&P 500 by +13.91%
These long-term selections are significantly outperforming many major Hedge Funds and the Barclay hedge fund averages since inception. Consider the actively managed ARK Innovation fund down -66.97% from last year, Tiger Global Management -58% YTD.
The Dow picks for next week are:
The Walt Disney Company ( DIS )
Disney is in strong breakout conditions ahead of Feb 8th earnings announcement. Institutions are net buyers in the current quarter and net MFI inflows are strongly positive again with analyst consensus price target around $125/share toward prior August highs.
FinViz.com
Background on Momentum Breakout Stocks
As I have documented before from my research over the years, these MDA breakout picks were designed as high frequency gainers.
These documented high frequency gains in less than a week continue into 2020 at rates more than four times higher than the average stock market returns against comparable stocks with a minimum $2/share and $100 million market cap. The enhanced gains from further MDA research in 2020 are both larger and more frequent than in previous years in every category. ~ The 2020 MDA Breakout Report Card
The frequency percentages remain very similar to returns documented here on Seeking Alpha since 2017 and at rates that greatly exceed the gains of market returns by 2x and as much as 5x in the case of 5% gains.
VMBreakouts.com
The 2021 and 2020 breakout percentages with 4 stocks selected each week.
MDA selections are restricted to stocks above $2/share, $100M market cap, and greater than 100k avg daily volume. Penny stocks well below these minimum levels have been shown to benefit greatly from the model but introduce much more risk and may be distorted by inflows from readers selecting the same micro-cap stocks.
Conclusion
These stocks continue the live forward-testing of the breakout selection algorithms from my doctoral research with continuous enhancements over prior years. These Weekly Breakout picks consist of the shortest duration picks of seven quantitative models I publish from top financial research that also include one-year buy/hold value stocks. Remember to follow the Momentum Gauges® in your investing decisions for the best results.
All the V&M portfolio models beat the market indices again last year with consistent outperformance of the major indices. All new portfolios have started for 2023!!
The final portfolio returns for 2022
All the very best to you, stay safe and healthy and have a great week of trading!
For further details see:
MDA Breakout Stocks Week 4 - January 2023: High-Frequency Gainers To Give You An Edge