IWM - MDA Breakout Strategies: How To Trade For Maximum Returns
2023-06-12 18:09:03 ET
Summary
- One of the most frequently discussed questions in all my years of trading is "when should I sell?"
- This article address many effective trading strategies for the MDA Breakout stocks as well as for any other stocks you own.
- The first priority in buying is to find the best type of short-term, long-term, value, dividend, growth, REIT, mega, micro, sector type, rapid breakout, or index stock you want.
- The first priority in selling is to make the best risk/reward decisions that you can in order to keep increasing your gains.
Introduction
How can people holding the same stock make completely different decisions to sell or not to sell, or even to buy more shares, and each person still make the right choice?
The exit strategy in trading stocks has so many variables for you to consider in order to achieve "maximum returns." I will highlight several strategies as well as share some excellent ideas from our member published studies that will help you evaluate some key sell strategies. However, the most important variable in this decision process is you.
As we go through the strategies of selling, it is very important that you start to develop your own best understanding of the meaning of the phrase "maximum returns." The longer you trade stocks the more you may want your maximum returns to be constrained or achieved within some limited time periods.
Methods
From my experience, I have found that there are three main types of exit strategies people choose in order to get "maximum returns" :
- A price target : Get an educated guess of how high a stock could go and hold on until the stock reaches a predetermined price target.
- A time target : Set a fixed time period to hold the stock and don't sell until your time target of some predetermined length has been reached.
- A conditional target : Monitor a stock's condition, news, earnings growth, price movement or other variables and wait to sell when the stock eventually breaks any of the parameters you set for holding the stock.
VMBreakouts.com
A price target is generally an educated guess using some form of technical analysis or fundamental value analysis to set a future price level. Price targets are a very popular approach because investors like the perception of price certainty and stock analysts like the additional weeks, months, years they obtain by not setting clear time periods to reach those price targets. This is an approach I have tried to avoid, both as an investor and a stock picker, but the popularity of price targets makes me a reluctant participant.
How many times have you been told, "just hold this stock to $85/share." This is a price target ride that could last a day, a month, a year or never be achieved if something bad happens to the company before that price is ever reached. You may start out thinking, "Wow a move to $85 is like a 300% gain! and even bank the returns in your head." But as weeks, months, and years drag on you might start to think, "It hasn't moved that much, I could be making more money faster in something else." If you decide to sell before the price target you have just moved into a conditional target method. I have seen where stock pickers like to only offer price targets and claim near 100% correct calls on their price targets. Often they make no mention of when those targets may be achieved. Stocks that are moving away from their targets are still 100% correct calls, but you are always told to be more patient. You may not have realized your great price gainer was going to be such a long-term hold.
A time target or fixed holding period is simply the process of setting a fixed period of time to hold a stock and then exiting the position when the time period has been reached. This is a useful approach if the reason for buying is time sensitive to a pending event or the criteria decay in effectiveness such that some optimal holding period may exist. It may not be as effective in maximizing returns as conditional holding periods, but it provides you a consistent fixed time target to make gains and leave.
This method is common ahead of product launches or earnings dates where some stock picker says, "just hold it until March 15th!" or "wait until next December for the best results." You are on a time target ride that gives you some sense of security, but may take you through some rough times with just the hope that the deadline isn't too much further to stomach the volatility.
Lastly, a conditional target relies on continuous data input and monitoring to observe when pre-established variable like price declines or market conditions have changed in such a way as to signal a sell event. In my opinion this is the best method, as long as your preset conditions are reliable sell signals. Most of this article will be focused on setting conditional sell targets for maximum returns.
Conditional Targets
Many experienced traders have come to rely on the importance of paying attention to new inputs, new events, new earnings, new signals, and new patterns as they decide the all-important question of, "When should I sell this stock?"
There are an infinite number of variables and combinations of variables people can use to decide when it is best for them to sell. The most important reason for selling based on conditional targets is the recognition that markets do change, that many price targets don't last, and that no one can anticipate all the factors that will occur while you are holding a stock. If you are not using some form conditional exit method you are probably putting way too much trust in a price target or an expected return at some future date.
I strongly suggest you first consider the changing markets, then changing sectors, and then key variables that signal change in your stocks.
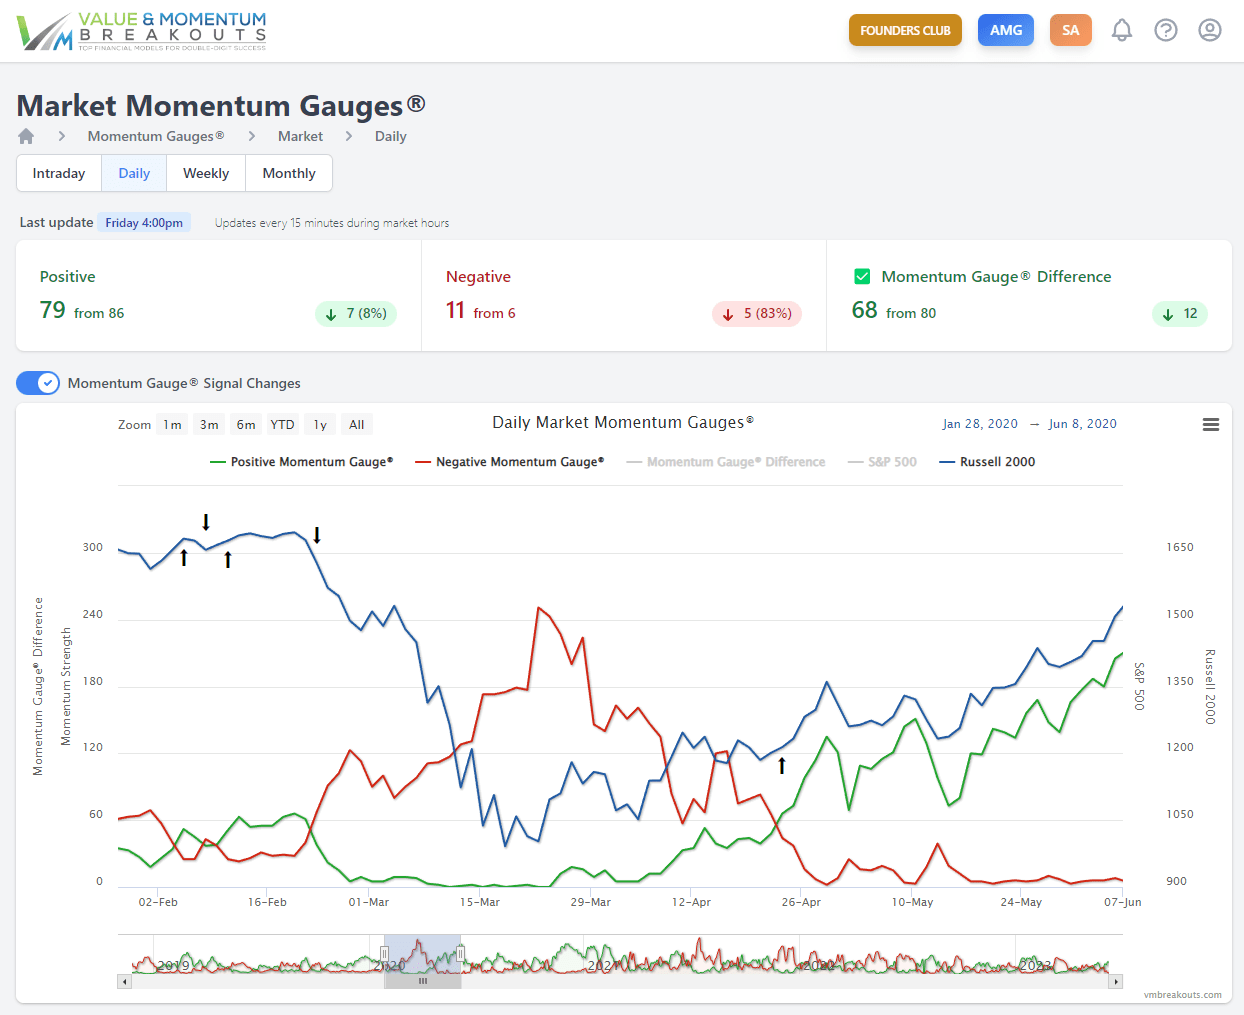
Daily Market Signals
The chart below shows the daily Momentum Gauge signals over a 5 month period in 2020 when the Covid pandemic impacted the markets. A down arrow sell signal on February 19th gave us a market exit signal that avoided the -34% decline in the S&P 500. This terrible market event did not care how good your stock's fundamentals, technicals, price target, or analyst rating appeared to be. Large market events can override all your preset targets, do not use a sell system that ignores important market signals.
First, always consider the big macroeconomic picture. If market conditions turn very negative, like the Covid pandemic, you are in for a rough ride if you refuse to let go of your preset price target. Oh sure, it is possible you can recover your losses and eventually reach some promised price target, but your time is valuable and large losses can keep you up at night.
In other discussions and articles you can learn more about when to recognize the approach of a negative signal across the broad market gauges, the S&P 500, or in each of the different sector gauges. For our purposes I want to continue to give you some important high level strategies to consider.
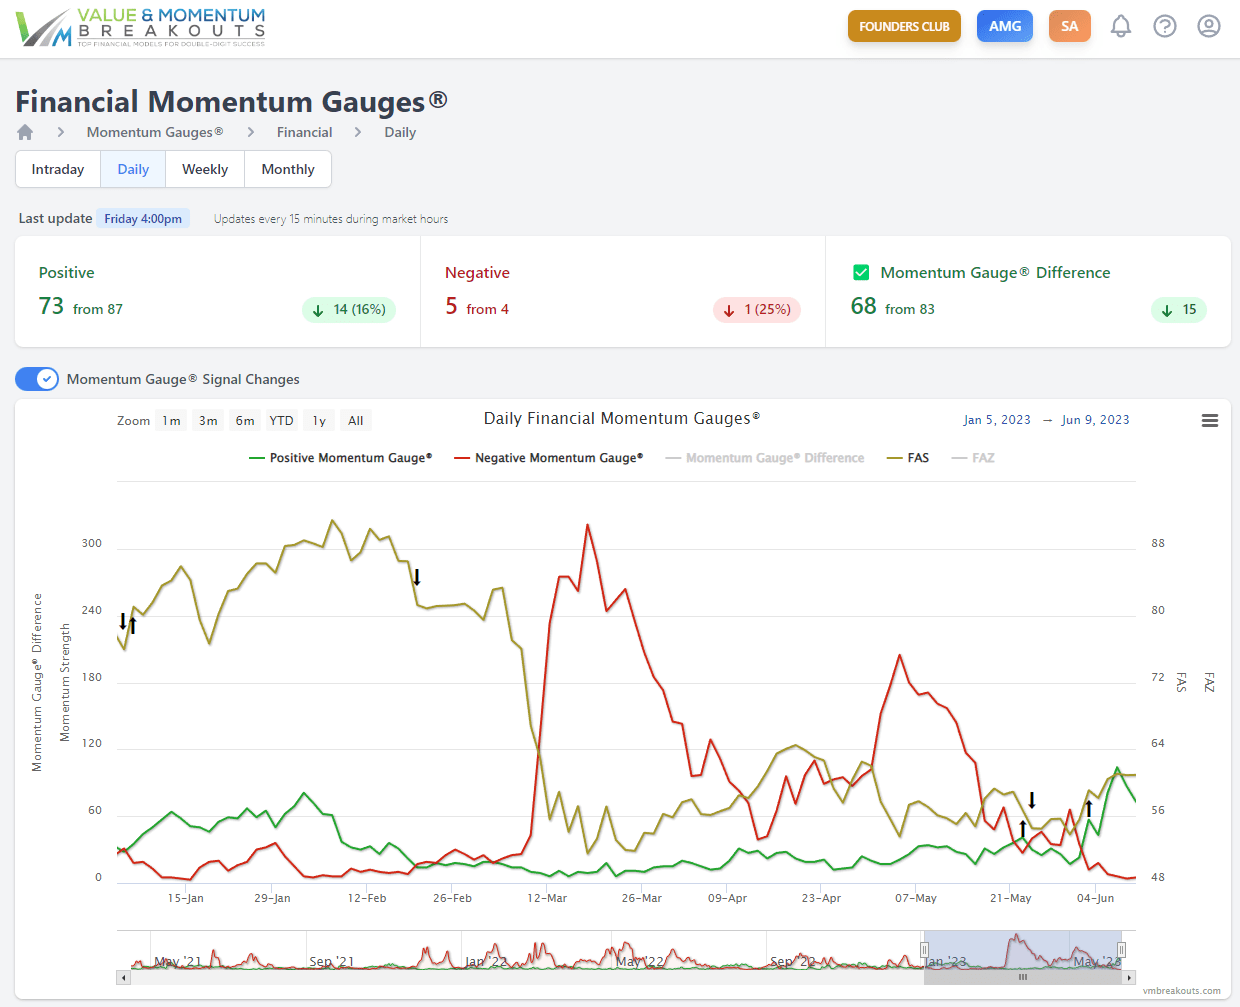
Second, always consider the sector your stock is in. Sectors are like specialized individual markets that have an enormous impact on the stocks within them. Individual sectors can behave very differently from the broader market or other sectors. The Basic Materials sector with segments like precious metals and mining can be very badly impacted by the movement of the dollar regardless of what the rest of the market is doing. Most recently we had a financial crisis in March that resulted in a series of the largest bank collapses since 2008. Other sectors like Technology were seemingly unphased, but the financial sector gauge chart shown below illustrates the large -44% correction on the Direxion Daily Financial 3x Bull fund ( FAS ) in March with a sell signal (down arrow) in mid-February.
So always consider if your stock is in a bad or deteriorating sector. You could still be holding an excellent financial stock, but as long as money is fleeing the financial sector it is more likely you will continue to lose money. The value of your stock price is heavily dependent on how much other investors want to pay to acquire your shares. Other investors could all be mistaken about the current value of your stock. But it is never to your advantage to hold something other investors don't want, at least not until they show signs of wanting it again.
Examining Individual Stocks
This brings us to the decision of when to sell an individual stock. If the market signal and/or sector signals have not created any reason for you to exit your stock then you should look at the individual characteristics of your stock. Remember back to why you bought it and your original preset expectations about the stock. Did you buy it because at the time it was the best type of short-term, long-term, value, dividend, growth, REIT, mega, micro, sector type, rapid breakout or index stock you wanted? Investors sometimes don't realize that these descriptors can represent extremely different types of stocks with very different characteristics. Consider stocks like car types for example. You would not buy a camper van to go race against a formula one race car. You would not use a two-seater coupe to haul boulders down a mountain. Stocks also can serve very different purposes and behave very differently with advantages and disadvantages for each.
The most common reason that investors want to sell is that a stock is not behaving (i.e., the price is not performing) within the parameters of their expectations. Did you buy an extremely high volatility stock with great short-term gain potential? Did you even succeed with a lot of gains and are now getting worried that the swings are too large to hold the stock for long-term? Did you buy a large dividend stock with extremely high yields, but the price has been flat or negative for months? It is very common for new investors to think every stock is basically the same as every other stock. Investors can get upset when their safe and solid armored personnel carrier they bought can't even get above 50 mph on the highway, while all the other cars are going much faster. Most stocks are like cars in some ways with a measurable tradeoff between risk / reward.
VMBreakouts.com
This is why I provide a range of portfolios for members to use to construct their own portfolio mix of stock types. I repeatedly encourage readers to each build your own optimal asset allocation portfolio. My models range from the very short-term weekly MDA Breakout picks with high volatility for extreme short-term gains to the long term Piotroski-Graham value picks or Growth & Dividend mega cap portfolios intended for at least a year of total return growth. How you trade each type of stock involves similar approaches, but with widely different emphasis on exit timing.
Weekly MDA breakout stocks
Let's begin with the decision about when to sell these generally small cap, high volatility weekly MDA breakout picks. My long-term testing of these stock selections shows that since inception over 450 of these picks have gained over 10% peak gains in less than a week. Breakout frequencies of over 5% in less than a week exceed broad market averages by as much as 5x all comparably priced stocks across the whole market. These frequency charts are published at the end of every weekly article with links to even more research articles.
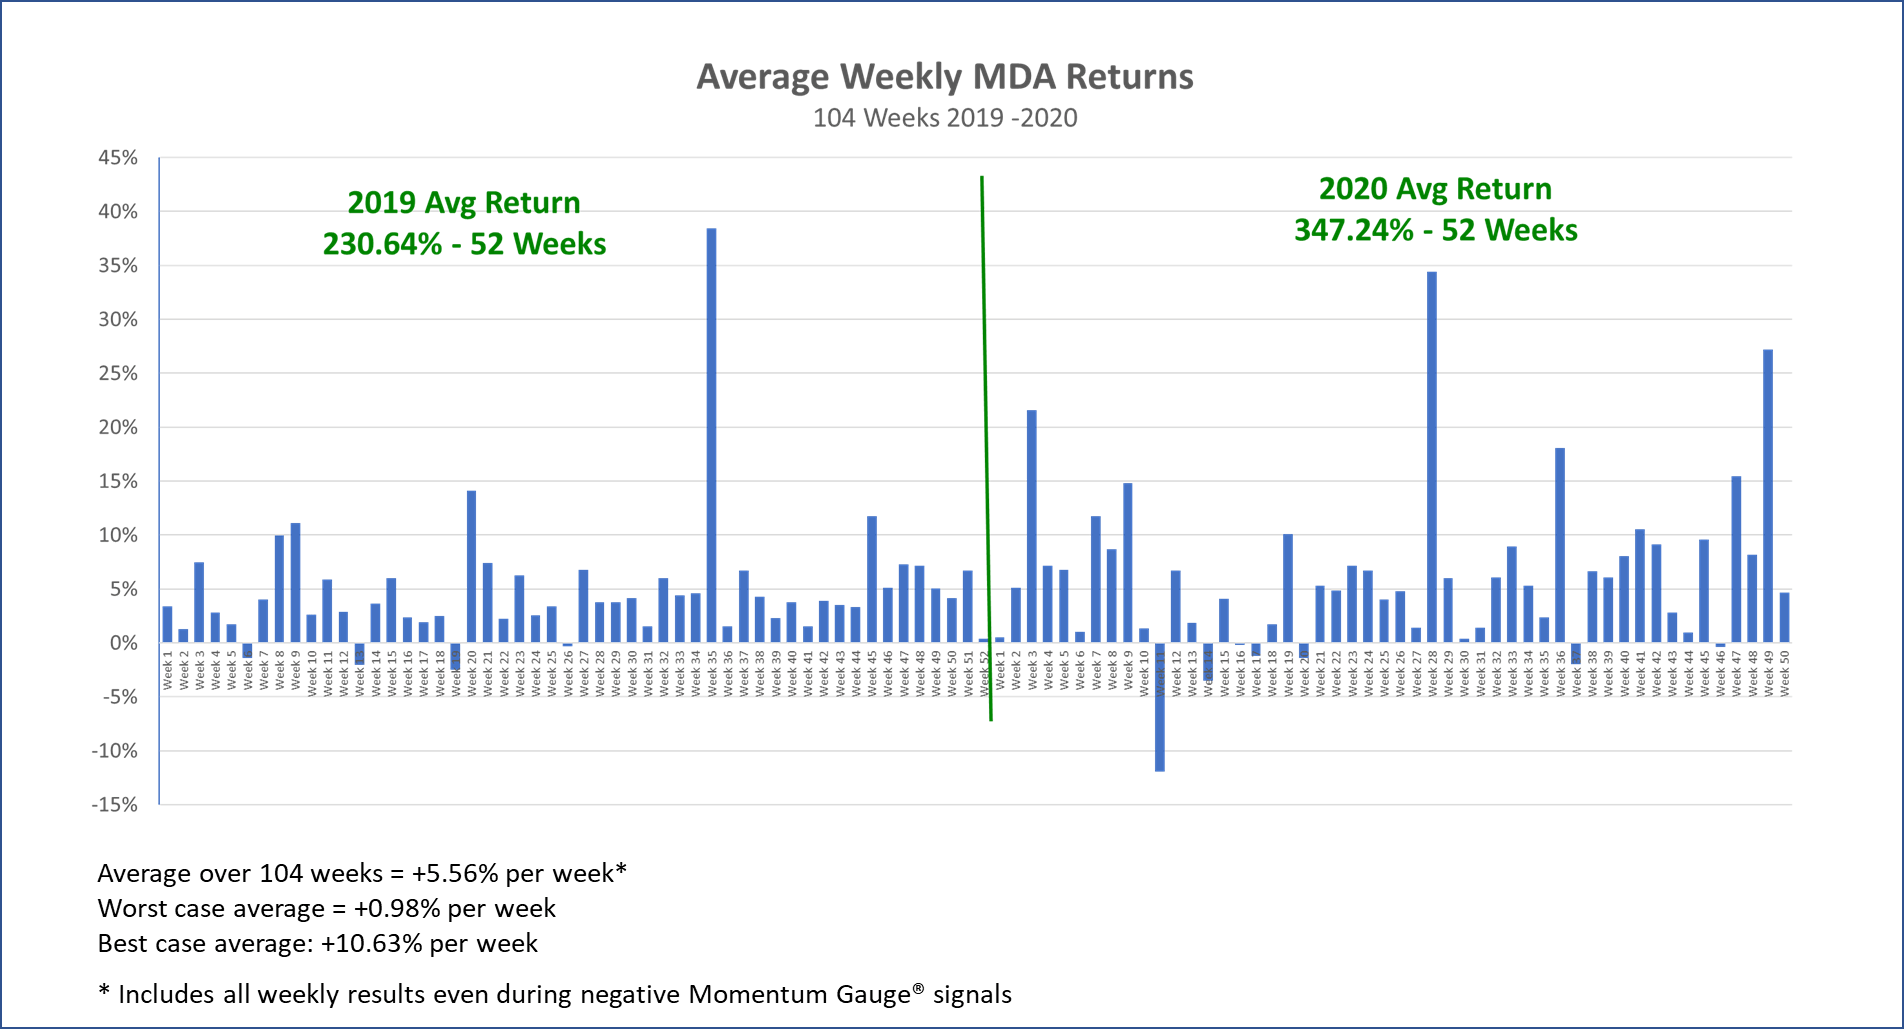
The consistency of these breakout moves is well documented and updated weekly. For years now it is consistently averaging close to 5% weekly returns with clear additional benefit from trading in positive Momentum Gauge weeks following the signals.
Are any of these returns guaranteed? No. Will the broad market and sector momentum conditions greatly impact these picks each week? Yes. Should you always keep the macro (big market picture) signals in mind as you decide when to sell? Yes.
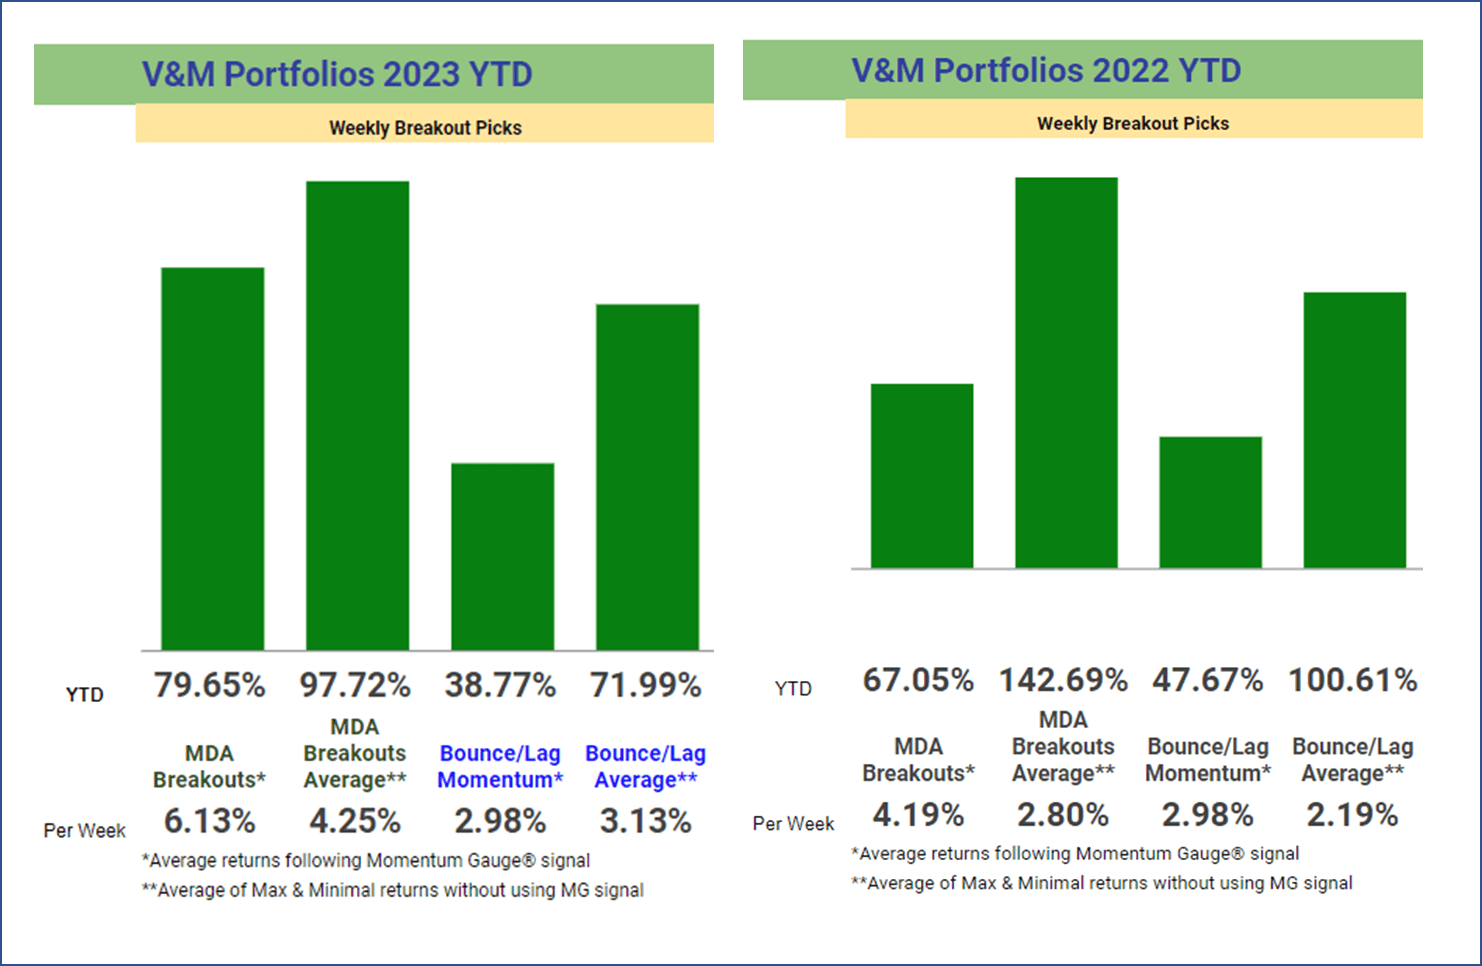
Under these measured conditions in a fixed 1 week trading period there are some obviously good strategies you can use. Suppose you preset sell orders for each of the Weekly breakout stocks at 8% or 5% or even 2% each week for 52 weeks. Would it be reasonable to assume you could achieve 1% weekly returns for 52 weeks? Following only positive Momentum Gauge signals in 2023, the MDA Breakout picks are up +79.6% average cumulative return with a worst case minimal return +22.20% in 13 weeks. So we just ended week 23 and if you followed the signals you would have to sit out of 10 weeks of trading to achieve +22.2% minimum returns in less than 6 months. But now, consider what could happen if you took steps to acquire more of the best case +196.6% returns for top gains.
Let's just look at the stock picks in less than half a year so far without filtering for only positive Momentum Gauge signals. All 96 picks have an average peak return of 8.74% in a week or less. 82 of these picks gained over 2%, 59 gained over 5%, and 27 have gained over 10% to as high as +66.1% in less than a week in the past 6 months. These numbers increase significantly when you consider only positive Momentum Gauge weeks.
Should all stocks be traded like short-term breakout picks? No. Can short-term breakout stocks get selected again and again and go on to gain over 2,000% in less than 5 years? Yes.
VMBreakouts.com
But keep in mind the uniquely different characteristics of these MDA Breakout picks from many other types of portfolios I offer. Remember that the Momentum Gauges can significantly improve your results and protect your downside. The safest way to protect your downside is to set trailing stops or stop loss orders.
Growth & Dividend Mega cap breakout portfolios
Now let's move to the other end of the spectrum away from high-flying small cap rockets tracked for a week. As detailed in each of the selection articles, the Growth & Dividend mega cap portfolios consists of 5 stocks above a minimum $10 billion market cap, $2/share price, 500k average daily volume and a minimum 2% dividend yield. The population of this unique mega cap segment is approximately 330 stocks out of over 7,800 stocks across the US stock exchanges. While these stocks represent less than 5% of available stocks, their market cap exceeds $19 trillion out of the approximately $33 trillion (57.6%) of the US stock exchanges. These are the Mack trucks of the markets. Any one of these stocks is generally larger than all the weekly MDA breakout picks combined. In addition, the Growth & Dividend model looks for good value on the Piotroski algorithm for long 2-year growth potential.
Through June of 2023, 17 Growth & Dividend portfolios have completed the 2-year measurement since inception in January 2020. Final 2-year buy and hold returns are shown below and the peak returns are in the yellow row. Average 2-year buy and hold returns are +29.85% with average peak returns +52.90%.
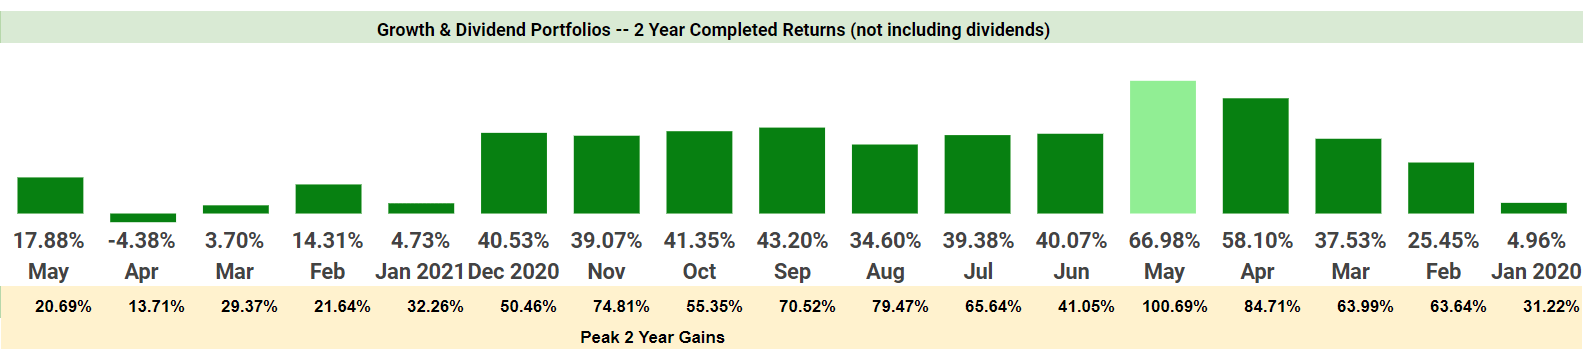
So with the long term view in mind how do you decide to sell Growth & Dividend mega cap stocks?
First, unlike most of the MDA Breakout picks these are enormous and well established companies with a large presence in countries all around the world. It is much less likely that these multinational mega-corporations are going to suddenly drop -30% in a month or gain 30% in a month over a surprising new revelation about the company or a new contract. In financial lingo we say they have less idiosyncratic risk, but higher systemic market risk. Because they are usually widely diversified or preeminent in their sector, what they are greatly exposed to are the systemic risks for their sector and to the broader markets. Second, whenever you are holding for the long term you need to be more aware of the conditions of markets and the sectors your stocks are in. The Momentum Gauge signals for the markets has quite a noticeable effect on these portfolio stocks.
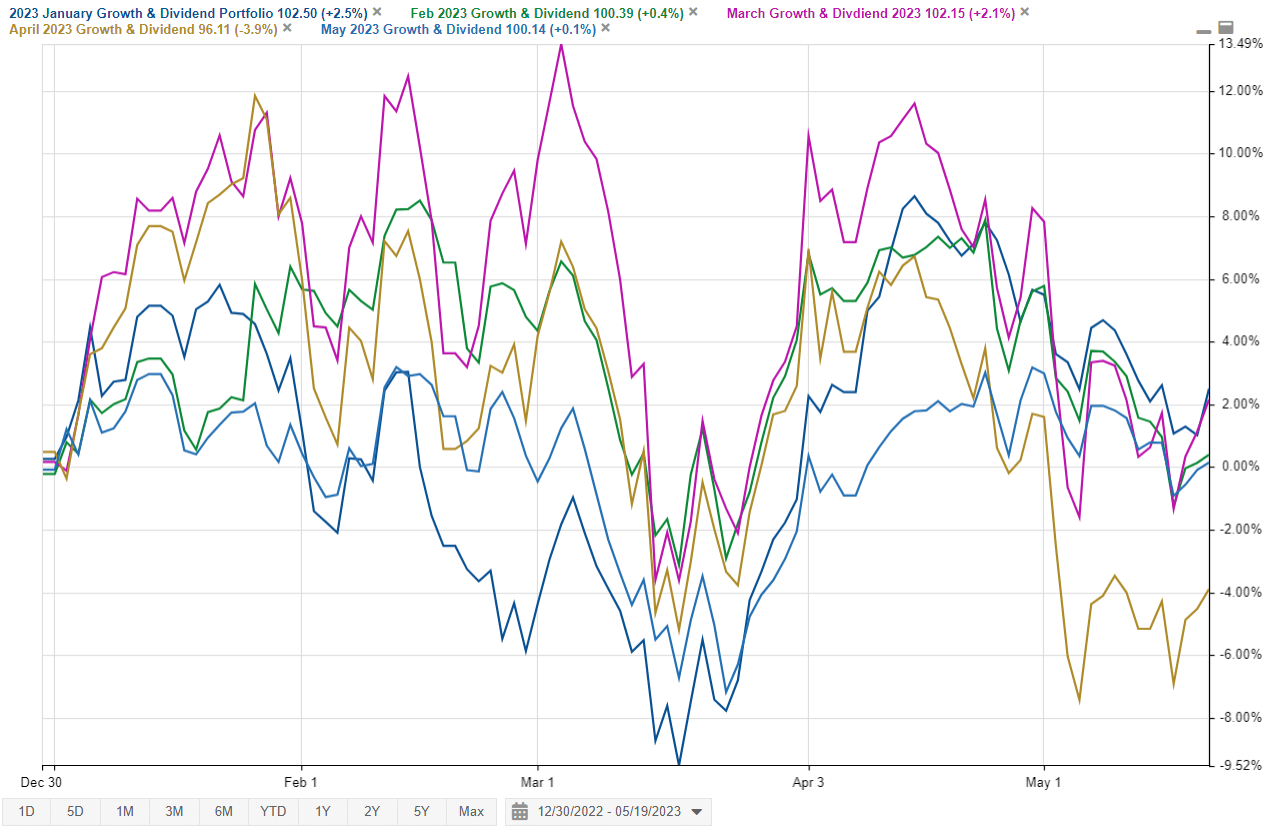
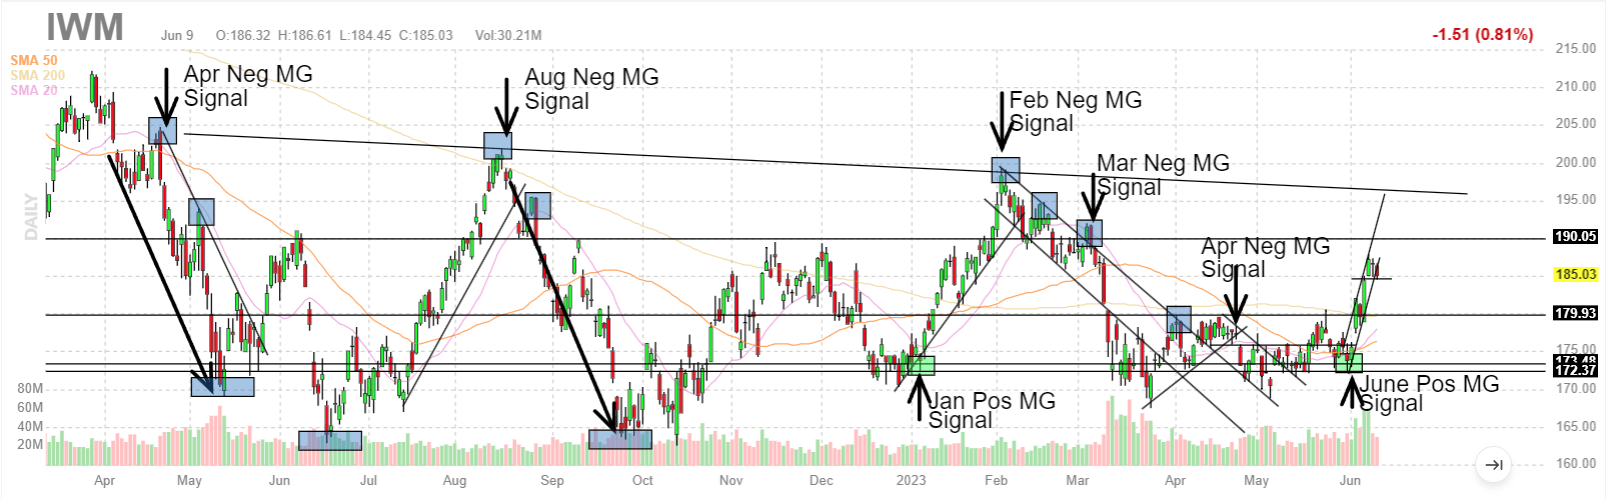
For example, a snapshot of the current 5 monthly portfolios for the Growth & Dividend mega cap selections are charted below through the end of May as if each of them began in January. What you can see most clearly is the sharp decline in March 2023 illustrated above on the Russell 2000 ( IWM ) chart impacted all the portfolios together. The fact that they all would have behaved very similarly through the negative February and March signals shows the systemic effects that are common across different stocks and portfolios. They also recovered together to the next peak in the Momentum Gauge signal in April and are doing much better as the market is making its strongest breakout move in June since early January.
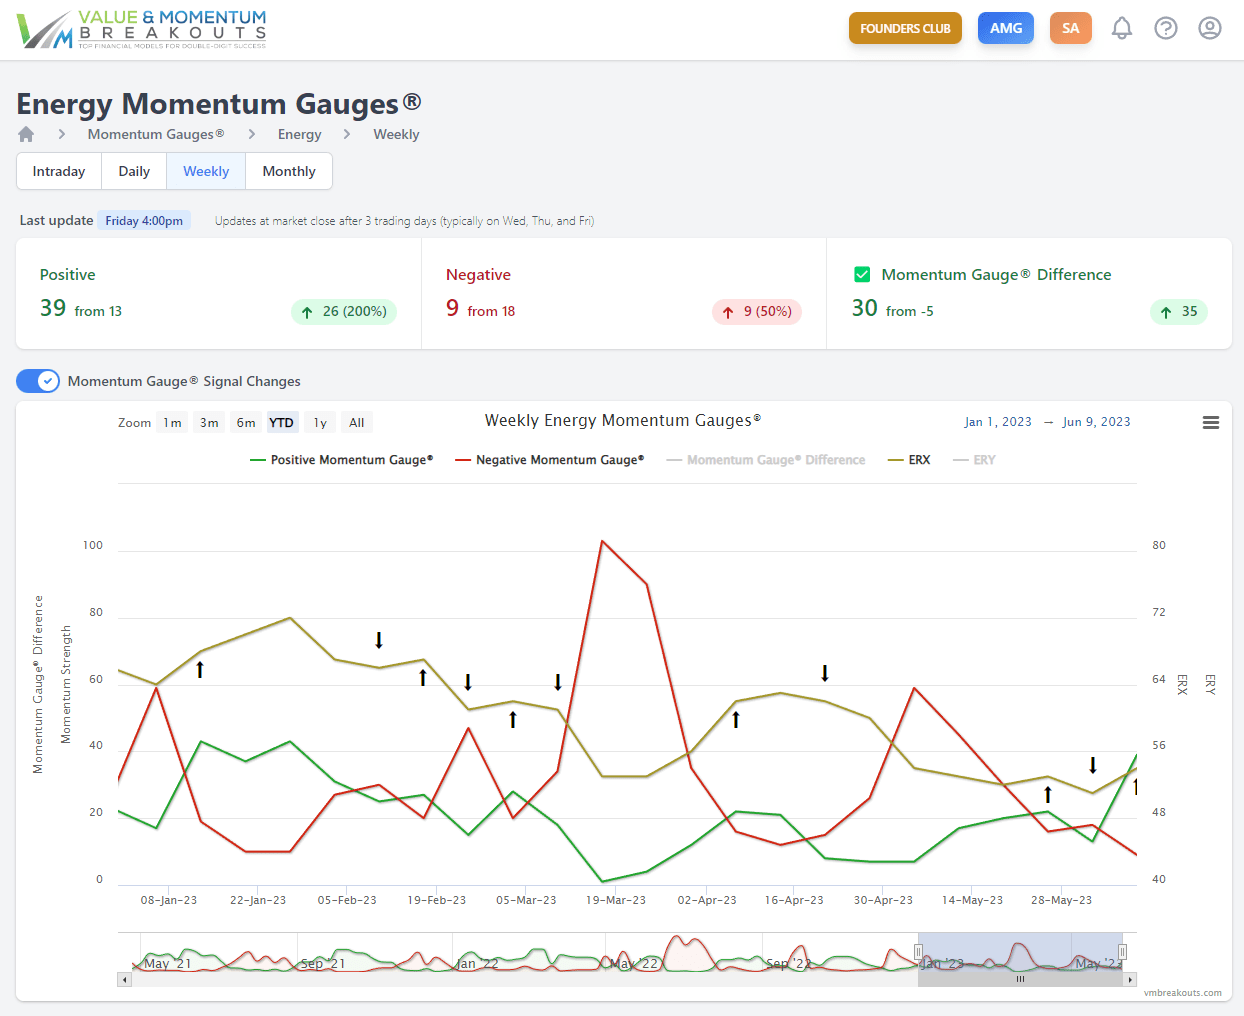
Should you sell all stocks at peak gains in March and repurchase at the lows? It depends. Many of these long-term picks going out monthly on the selection algorithms are highly undervalued Energy mega cap stocks using Piotroski value factors intended for very long investment periods. Joseph Piotroski valuations are not a timing indicator, but a measure of strong potential for growth over a 2-year period studied in the published scholarly research. So if you look closely at the Weekly Energy Sector gauges for timing indicators you can see how the Energy sector turned to the lowest positive momentum values in March in over a year and then rebounded. You can also see how high the negative values got for the Energy sector market and have been moving lower ever since. The current weekly signal for Energy has turned sharply positive to the highest levels since January and indicates strong net inflows to the oversold sector and many related stocks.
As long as these mega-corporate stocks are not at risk of major idiosyncratic declines from huge earnings misses or SEC violations, the larger risk comes from systemic conditions in their respective sector or the overall market. These systemic risks in the Energy sector include OPEC production decisions and recessions that lower demand. Certainly, by following the timing indicators on specific sector gauges either daily, weekly, or monthly you can see how timing can further increase your long-term returns over the measured period.
Technical Signals and Proxy Indicators
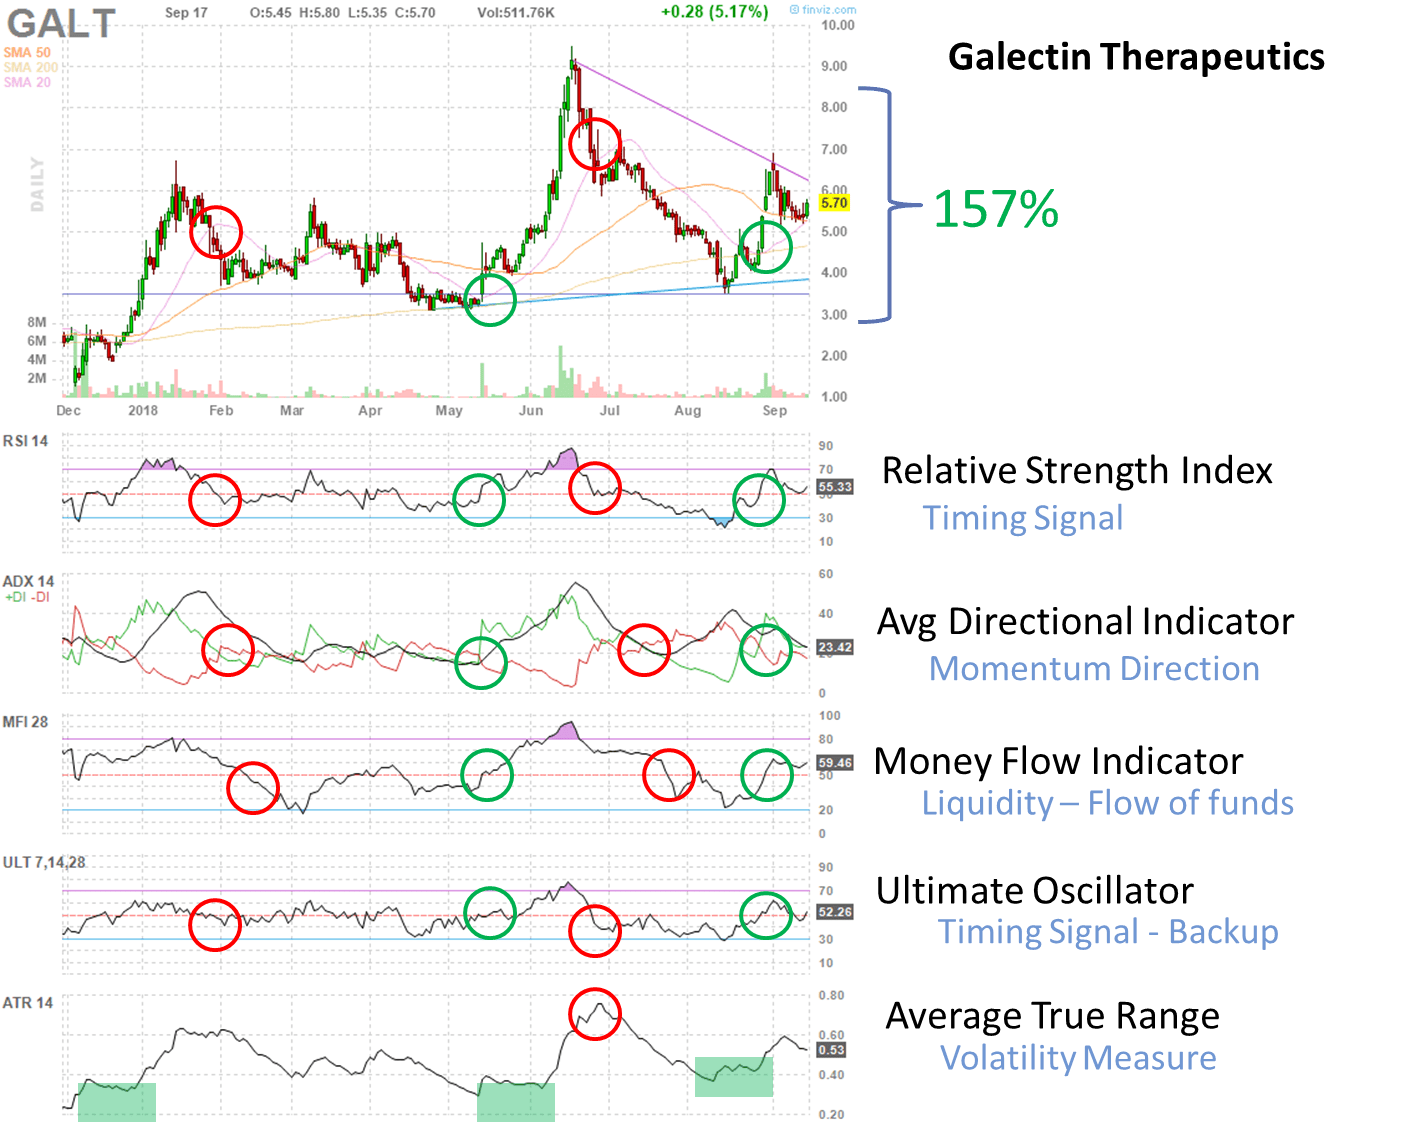
In the resource library for members there are detailed examples in the presentations I have regularly given to finance students at the university. These simple proxy indicators illustrate when a stock is overbought and likely to pull back in profit taking. It also shows you when a stock is oversold and is gathering investor interest for accumulation and a gain in price. Here is an example:
Advanced signals are explained in my MDA research studies and the Momentum Gauge articles applied to individual stocks. A new instruction and guide was recently released and I hope it benefits you greatly:
Guide: Maximizing Market Returns With The Automated Momentum Gauges .
Conclusion
If you would like notifications as to when my new articles are published, please hit the button at the bottom of the page to "Follow" me. Exit strategies from stocks vary greatly. Individual preferences will always make the answer to "when should I sell" a more complicated and personal decision. In the simplest terms you should always understand the nature of the stocks you have purchased and hold to the famous Marty Zweig investing rule:
If you can't sleep at night, reduce your positions or get out.
The best way to trade is to stay true to your risk tolerance and follow the rules you set when you bought the stock. What gets us into the most trouble over time is when we change the rules we set to protect our downside. I have technical trading videos, proxy indicators, and momentum cycle signals I will continue to detail at length to help you benefit greatly. However, the key to all these systems is keeping your emotions in check, trade when it is most beneficial, and keep watch with conditional targets to see if any of the factors impacting your stock have changed over time.
I wish you the very best in all your trading decisions!
JD
For further details see:
MDA Breakout Strategies: How To Trade For Maximum Returns