MDU - MDU Resources: Undervalued Yet Risky
2023-10-17 12:29:00 ET
Summary
- MDU Resources Group, Inc. has recently completed the spin-off of its construction materials subsidiary, Knife River Corporation.
- The company is working to optimize its operations and provide long-term value to its shareholders.
- MDU Resources Group, Inc. is undervalued compared to its peers and has a potential price appreciation for its shares.
Continuing searching for a value stock paying dividends, I accidentally found the one that could potentially add value to its stockholders. It is an MDU Resources Group, Inc. (MDU). The company recently completed the spin-off of its construction materials subsidiary, Knife River Corporation, and continues to optimize its operations to provide long-term value to its shares. Although I put a “Buy” rating, there are some risks that should be taken into consideration. I will show that the company is undervalued compared to its peers and prove it with an alternative valuation technique providing a price target for its shares and potential risk factors.
Company Overview
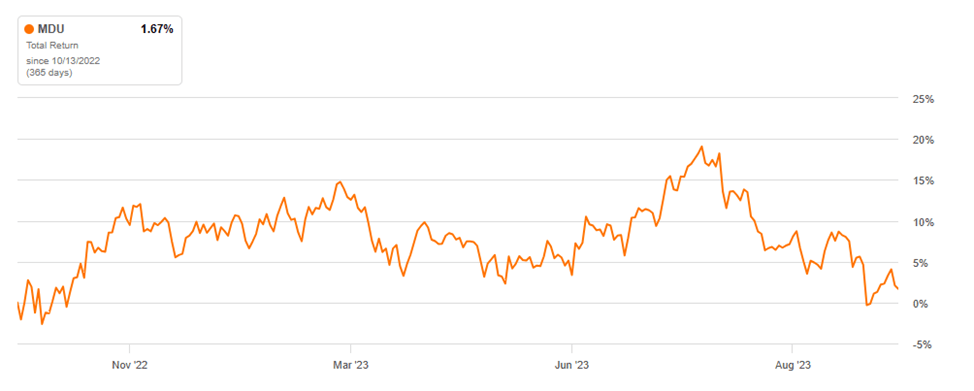
MDU Resources Group, Inc. is a US company providing energy delivery, construction materials, and services. Its operations are based within the US and represent several business segments: construction services, electric, and pipeline segments. It has a “Buy” rating from SA and Wall Street analysts, but a “Sell” Quant -rating . MDU provided a modest 1.67% Total Return to its shareholders for the past 1 year and gives a forward dividend rate of 2.63% , despite the recent dividend reduction .
1-Year Total Return MDU (SeekingAlpha)
Peer analysis
| Sector Median |
| Average |
| P/E ((FWD)) |
| 13.04 |
| 19.94 |
| 15.52 |
| 17.91 |
| 5.23 |
| 12.89 |
| EV/Sales |
| 1.29 |
| 1.65 |
| 2.97 |
| 6.28 |
| 0.57 |
| 3.27 |
| PEG ((FWD)) |
| 2.35 |
| 1.61 |
| 2.29 |
| 3.79 |
| 0.04 |
| 2.04 |
| P/S ((FWD)) |
| 0.8 |
| 1.32 |
| 1.54 |
| 3.87 |
| 0.71 |
| 2.04 |
| P/B ((FWD)) |
| 1.05 |
| 2.41 |
| 1.26 |
| 3.44 |
| 1.37 |
| 2.02 |
| Dividend Yield ((FWD)) |
| 2.62% |
| 4.58% |
| 5.14% |
| 1.17% |
| 3.63% |
| 1-Year Total Return |
| 1.67% |
| 0.64% |
| 0.82% |
| 22.28% |
| -2.88% |
| 6.74% |
Source: Author, with data from Seeking Alpha
Compared to the sector's median numbers, MDU seems to be undervalued as its multiples are lower. The same is true if we take the company's closest rivals and calculate their average numbers. Except for the P/E (affected by low BTU P/E), all others indicate the same. The dividend yield is lower than average because the competitors have a higher payout ratio, while stock performance underperformed the average. All that suggests is to dive deeper into MDU valuation.
Latest Quarterly Results and Goals
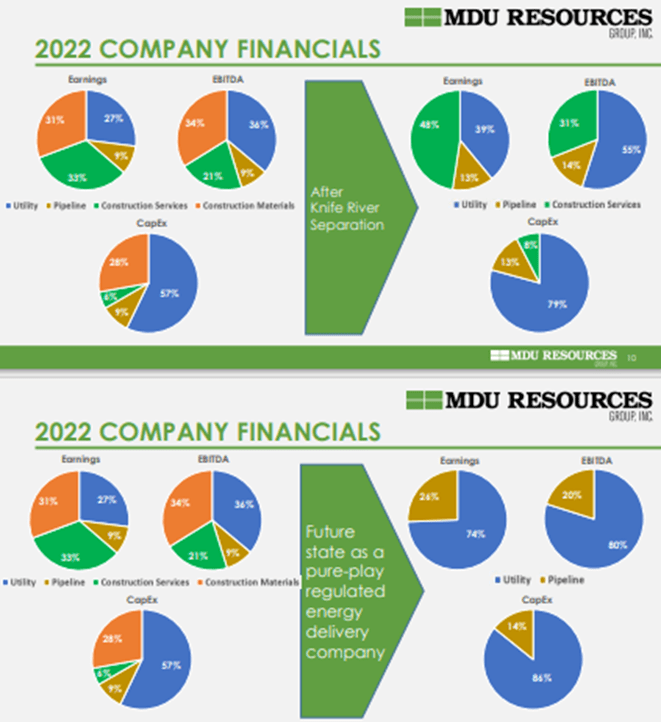
The company is on its way to “optimize shareholder value”, which means separating businesses. It started with Knife River's tax-free spin-off separation and will continue with the tax-advantaged separation of the construction services business. If the first play was to decrease risky assets, the elimination of the construction services would further continue the company's goal to become a pure-play regulated energy delivery company.
MDU`s goal as a pure-play regulated energy delivery company (The company`s presentation)
For the six months ended June 30, 2023, MDU Resources had earnings on a GAAP basis of $169.0 million, or 83 cents per share, compared to GAAP earnings of $102.4 million, or 50 cents per share, for the same period in 2022. Income from continuing operations for the same period was $231.5 million, or $1.14 per share. For the six months ended June 30, 2023, income from continuing operations adjusted for items as previously noted was $147.2 million, or 72 cents per share, compared to adjusted income from continuing operations of $104.8 million, or 51 cents per share, for the same period in 2022.
Source: MDU Resources earnings release
| Year |
| 1H 2023 |
| 1H 2022 |
| 2022 |
| 2021 |
| 2020 |
| 2019 |
| Operating revenue |
| 100% |
| 100% |
| 100% |
| 100% |
| 100% |
| 100% |
| Electric, natural gas distribution and regulated pipeline |
| 40.2% |
| 41.4% |
| 24.9% |
| 24.5% |
| 22.6% |
| 24.0% |
| Non-regulated pipeline, constructing , constructing materials |
| 59.8% |
| 58.6% |
| 75.1% |
| 75.5% |
| 77.4% |
| 76.0% |
| Cost of sales electric, natural gas and regulated pipeline |
| 19.5% |
| 21.9% |
| 21.6% |
| 26.4% |
| 28.3% |
| 27.8% |
| Cost of sales non-regulated pipeline and construction |
| 90.8% |
| 90.2% |
| 87.9% |
| 86.5% |
| 85.8% |
| 87.2% |
| Cost of sales |
| 62.1% |
| 61.9% |
| 71.4% |
| 71.8% |
| 72.8% |
| 73.0% |
| Gross margin |
| 37.9% |
| 38.1% |
| 28.6% |
| 28.2% |
| 27.2% |
| 27.0% |
| Gross margin electric, natural gas distribution, and regulated pipeline |
| 80.5% |
| 78.1% |
| 78.4% |
| 73.6% |
| 71.7% |
| 72.2% |
| Gross margin non-regulated pipeline, constructing |
| 9.2% |
| 9.8% |
| 12.1% |
| 13.5% |
| 14.2% |
| 12.8% |
Source: Author, with data from MDU financial statements
The gross margin for electric and natural gas distribution was higher due to a reduction in costs, but revenues from unregulated pipelines and constructing businesses continue to prevail, increasing compared to last year. Despite this fact it seems that the company's goal may work, concentrating on marginal operations.
| Year |
| 1H 2023 |
| 1H 2022 |
| 2022 |
| 2021 |
| 2020 |
| 2019 |
| Return On Common Equity ((ROCE)) |
| 6.27% |
| 5.14% |
| 10.84% |
| 11.92% |
| 12.97% |
| 11.65% |
| Return On Net Operating Assets ((RNOA)) |
| 4.08% |
| 2.15% |
| 7.23% |
| 7.83% |
| 8.62% |
| 7.86% |
Source: Author, with data from MDU financial statements
This may be indirectly confirmed by the table above, with the return on net operating assets significantly increasing and with a slight increase in return on common equity. As mentioned before, the goal of the new structure is to create value for the shareholders. Finally, the company increased the earning guidance for the regulated energy delivery business.
Risks
There are several risk factors regarding the performance. First of all, is the variable rate debt which is forecasted to increase further in coming years, this will result in higher costs for the company and negatively affect profitability.
The second is the unknown result of the construction services business separation as it contributes the vast majority of the company's revenues.
Last year's operating costs were higher due to maintenance outages and lower payroll-related costs, resulting in increasing earnings this year compared to the last.
A future dividend payout increase doesn’t mean that the actual yield will be higher, it may be a signal of lower profit prospects.
Weather risks persist as it is one of the drivers of the company's guidance upgrades.
Valuation methodology
I used the same methodology as in my previous article. The required return is WACC-calculated. Some of the numbers for required returns were outsourced but modified taking into consideration the company's current weighted-average debt costs and future interest perspectives. Balance inputs depend on the sales figures of the company.
Valuation inputs and results
With the revenues forecasted to drop , but with a higher return on net operating assets, I simulated both balance sheets and income statements and discounted residual operating income using a 6.5% required return, WACC -calculated. The growth rate is the historical average, while the long-term rate was suggested by the company itself in its statements, for the income tax federal statutory rate of 21% (provided from the annual statements) was used.
| Year |
| 2022 |
| 2023E |
| 2024E |
| 2025E |
| 2026E |
| 2027E |
| Return On Net Operating Assets |
| 7.2% |
| 7.8% |
| 7.8% |
| 7.8% |
| 7.8% |
| 7.8% |
| Residual Operating Income (ReOI) |
| 87698 |
| 57246 |
| 55361 |
| 57022 |
| 58733 |
| Cost of operations |
| 6.50% |
| Total Present Value ((PV)) of ReOI to 2023 |
| 265839 |
| Continuing value ((CV)) |
| 59907 |
| PV of CV |
| 971669 |
| Net Operating Assets as of 2023 |
| 6794823 |
| Value of operations |
| 8032331 |
| Net Financial Obligations |
| (3207572) |
| Value of common equity |
| 4824759 |
| Number of shares outstanding |
| 203640 |
| Value per share |
| $23.69 |
In Thousands of United States Dollar ((USD)) except per share items
Valuation risk
The growth rate is based on the company's overview and past performance, even a slight change will affect the price. If the growth rate continues to rise this year, it will result in a higher price target and vice versa. Due to accounting principles, some of the figures I used in my reformulation might be slightly off, but I tried to minimize their influence. The latest quarter statements and annual statements lack some disclosure, for example, product margins are not disclosed, making it difficult to forecast the performance -- although this had only a minor effect on my calculations. WACC calculations are outsourced and modified to match my own. Revenue forecasts are outsourced from SeekingAlpha.
The main risk is the business segment separation, due to lack of information it makes it difficult to forecast future balance sheet structure and thus calculate properly the return on net operating assets. Besides the information on how the separation will be completed, we have no information about the conditions which brings a big question mark on the value of shares. My valuation is based on the possible spin-off with market conditions and is equal to the original price minus the spun-off share price.
Conclusion
There may be various reasons why a company decides to separate a portion of its business. Management knows better and it may be a strategy to focus on their core operations and thus create value to shareholders. There are many unknowns regarding the case and if you can take a risk, with the current price of $19 you may be rewarded more than 20%. I assign a price target of $23.69 and a “Buy” rating.
For further details see:
MDU Resources: Undervalued, Yet Risky