VO - MDY: Well-Diversified Solid Mid-Cap ETF But Quality Is Suspect
2023-11-07 15:12:51 ET
Summary
- MDY is a well-established, well-diversified mid-cap blend ETF with $17.3 billion in assets under management and a 0.23% expense ratio. This article evaluates MDY against three S&P MidCap 400 alternatives.
- The goal is to identify whether MDY's plain-vanilla strategy is superior to ETFs using revenue, GARP, or multi-factor strategies and weighting schemes. I discovered some pros and cons to consider.
- MDY is reasonably low-risk, evidenced by its lower five-year beta and strong diversification. Shareholders would benefit from a secular change, as mid-caps have underperformed large-caps in the last 8-10 years.
- The main negative is quality. In a peer group of 19, MDY's profit score was only ninth-best. Not surprisingly, the best-performing mid-cap blend ETF in the last four years also has the highest profit score, so it is a factor to consider.
- Overall, I didn't find too many faults with MDY, but believe there are better choices. Therefore, I rate it as a solid "hold".
Investment Thesis
This article evaluates the SPDR S&P MidCap 400 ETF ( MDY ) as a suitable long-term investment by analyzing its performance and fundamentals against three alternatives, as follows:
- Invesco S&P MidCap 400 Revenue ETF ( RWK )
- Invesco S&P MidCap 400 GARP ETF ( GRPM )
- Invesco S&P MidCap 400 QVM Multi-Factor ETF ( QVMM )
The goal is to determine if alternative weighting schemes and strategies are beneficial when applied to the same mid-cap stock universe, which is roughly $7-$8 billion on a weighted average basis. While MDY is well-balanced and does a reasonably good job managing volatility, its quality is a bit low, and it's possibly overvalued. These are the trade-offs I want readers to consider, and I look forward to taking you through the numbers in detail below.
MDY Overview
Strategy Discussion and Key Exposures
MDY tracks the S&P MidCap 400 Index, selecting 400 securities with market capitalizations ranging from $5.2 billion to $14.5 billion, or approximately the 85-93 percentile of the S&P Composite 1500 Index. As members of this parent Index, companies must have positive trailing twelve-month GAAP earnings and positive GAAP earnings in the most recent quarter. However, this requirement only applies to new entrants, so the Index Committee could allow non-profitable companies to remain. My analysis reveals that 45/400, or 7.80% of the fund's constituents by weight, have negative net income margins.
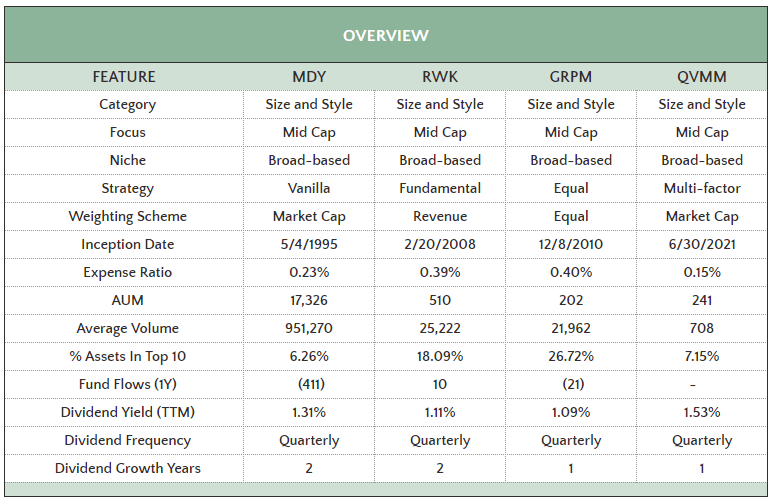
The table below highlights the strategy and weighting scheme differences between MDY and the three alternatives listed earlier. As shown, MDY is a plain vanilla market-cap-weighted ETF, while RWK and GRPM are revenue- and equal-weighted. QVMM, the newest of the four, follows a multi-factor strategy and is also market-cap-weighted.
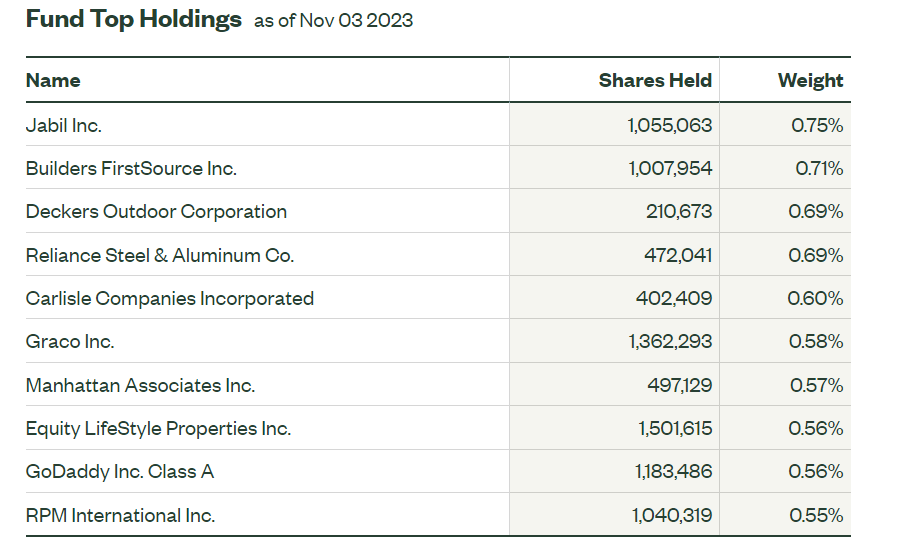
Nevertheless, MDY is by far the largest and the most established, with $17.3 billion in assets under management and a May 1995 inception date. Its 0.23% expense ratio is competitive, and with only 6.26% of assets in its top ten holdings, it's well-diversified. Below are those top ten, which include Jabil ( JBL ) and Builders FirstSource ( BLDR ), two stocks up 100%+ in 2023 and potentially in line to join the S&P 500 Index shortly.
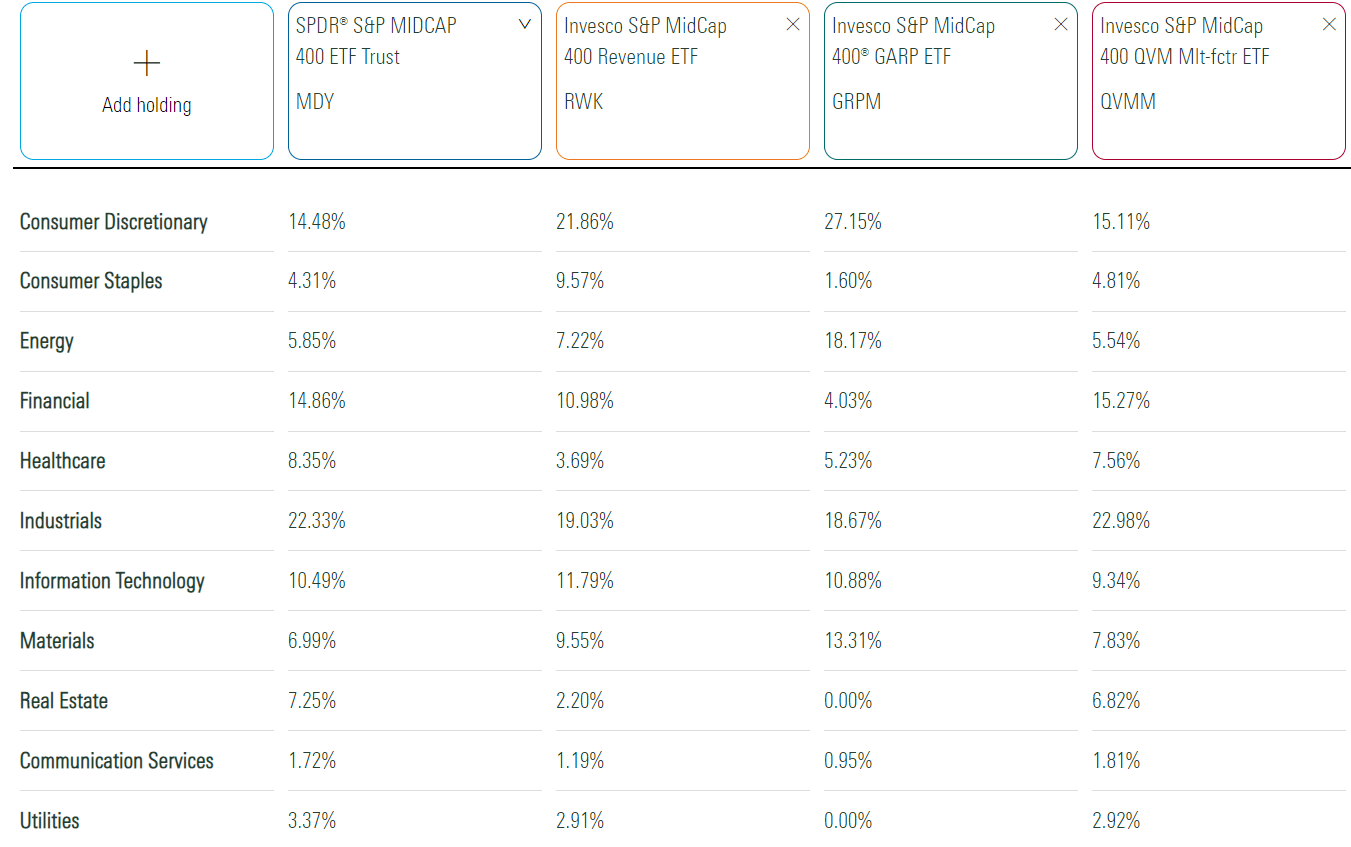
With such little concentration, what's more important is diversification at the sector and industry levels. The following table compares sector exposures for the four funds. Here, we see Industrials leading at 22.33%, followed by Financials and Consumer Discretionary at 14.66% and 14.48%, respectively.
Interestingly, GRPM's exposure to Financials is only 4.03%, suggesting that the sector either has low growth prospects, is overvalued, or both. RVK's high exposure to Consumer Discretionary indicates that the sector does the most sales but is not necessarily the most profitable. I'll discuss profitability shortly, but first, let's look at how these ETFs have performed over the last decade.
Performance
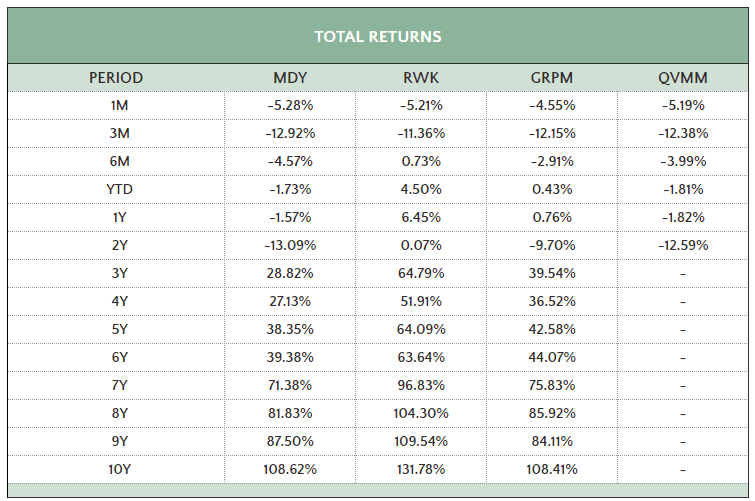
Through October 2023, MDY has gained 108.62%, in line with GRPM but about 23% behind RWK. QVMM has a short track record, but its returns align with MDY. The ETF, which tracks the S&P MidCap 400 Quality, Value & Momentum Top 90% Multi-factor Index, has yet to show any meaningful advantage over the last two years.
Analyzing these periodic returns is helpful because we can see how RWK's outperformance occurred entirely post-pandemic. Its 64.79% three-year return is 34% better than MDY, which means that from November 2013 to October 2020, MDY was the better choice. According to Portfolio Visualizer , my data source, MDY outperformed by an annualized 2.14% (7.13% vs. 4.99%) and had even better risk-adjusted returns due to its lower annualized standard deviation (16.54% vs. 19.73%).
I use this example to encourage you to avoid relying solely on past performance to make investment decisions. MDY looked better than RWK three years ago but then underperformed substantially. Today, you might be tempted to go for RWK because of its better ten-year track record, but that strategy also might not work out. GRPM's returns are also competitive, but the ETF's underlying Index, investment objective, and strategy changed effective August 25, 2023, rendering past performance metrics useless. Unfortunately, we're not left with much, so I want to focus the rest of this analysis on the fundamentals and see which factors are prominent in each ETF.
MDY Fundamentals
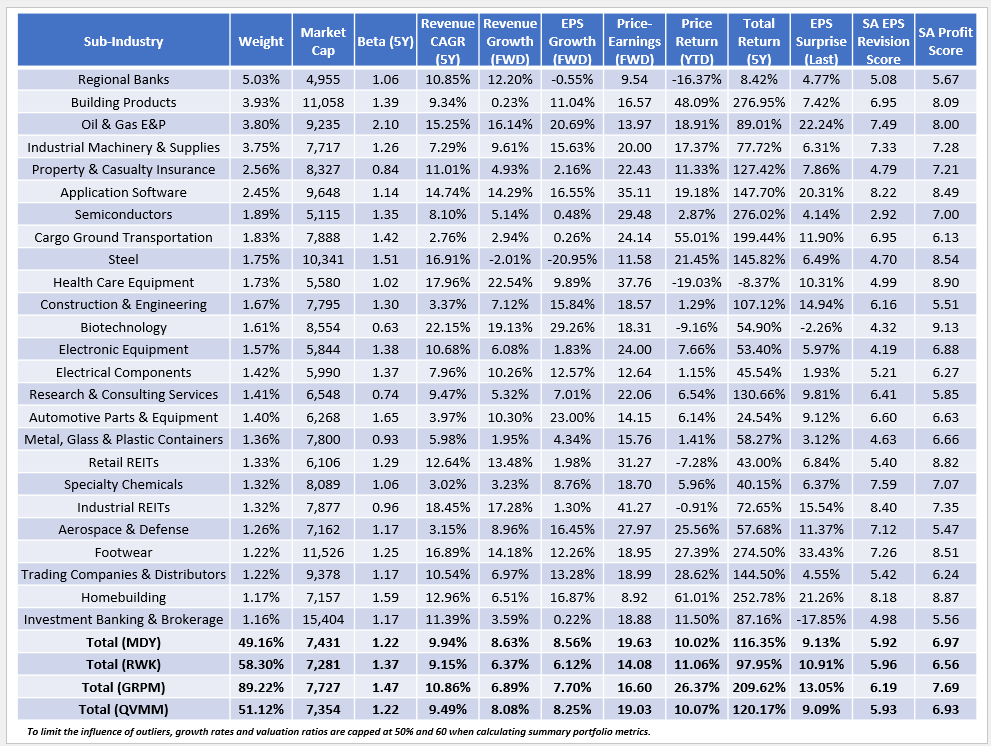
I've highlighted MDY's top ten holdings and sector exposures, but I want to bridge the two views by analyzing its sub-industries next. MDY's top 25 comprises 49.16% of the fund and is led by Regional Banks at 5.03%.
I have five observations:
1. All four ETFs have market caps between $7-$8 billion, which, besides being based on the S&P MidCap 400 Index, is why I selected them for comparison. You'll find that ETFs like the Vanguard Mid Cap ETF ( VO ) and the iShares Russell Mid-Cap ETF ( IWR ) are more popular and even have delivered better returns over the last decade, but their weighted average market caps are $25.8 and $21.4 billion. As such, each has about a 15% overlap by weight with the SPDR S&P 500 ETF ( SPY ) and has benefitted from how much better large-caps have performed over the last ten years.
2. MDY and QVMM have nearly identical fundamentals across the board, explaining the similarities in their track records over the last two years. While this is not a positive or negative feature, it does beg the question of what value, if any, QVMM offers. While it trades at a slightly better forward earnings valuation (19.03x vs. 19.63x), its estimated sales and earnings growth rates are also marginally lower. I don't see the point in owning the much smaller, less established fund.
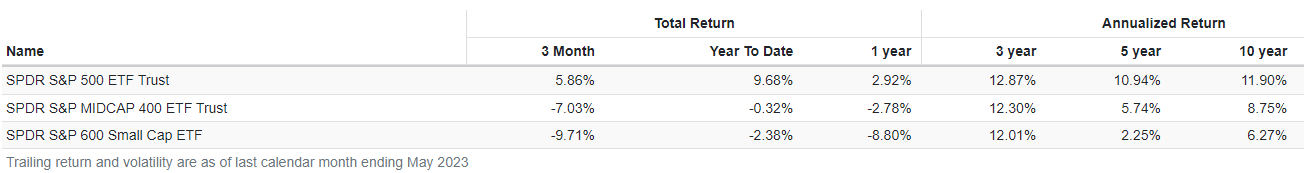
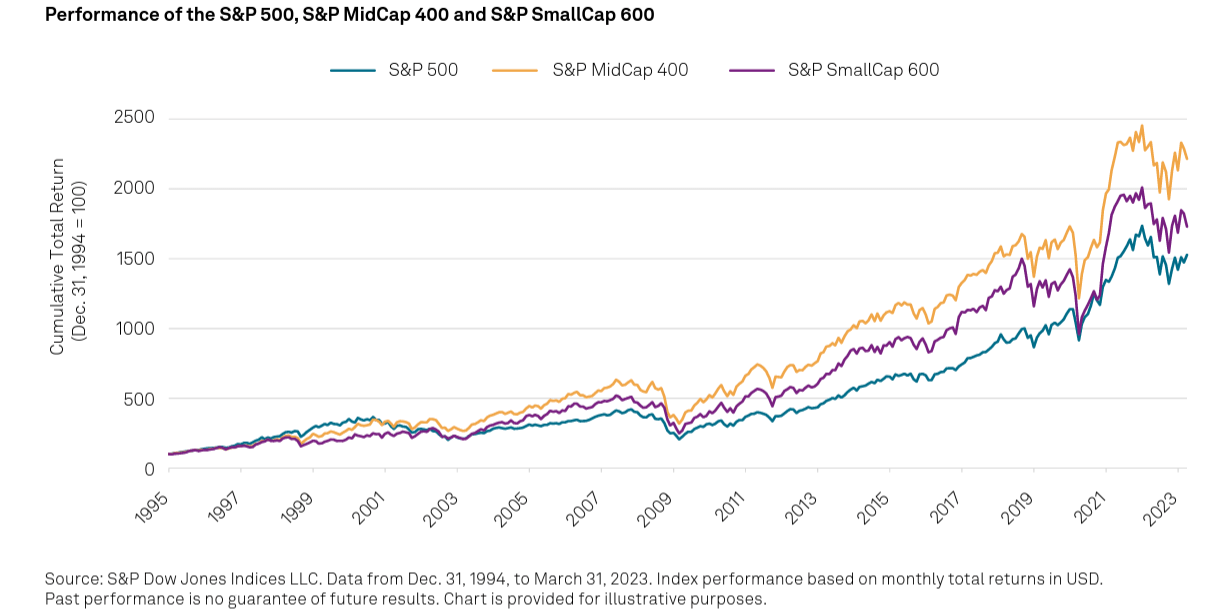
3. Volatility becomes a problem when deviating away from the plain vanilla MDY. RWK's five-year beta is 1.37, and GRPM's is even higher at 1.47. In the latter case, concentration is also a concern. GRPM has 89.22% of assets in its top 25 sub-industries, including 14.11% allocated to highly volatile Oil & Gas E&P stocks. For risk-takers, it makes sense, especially if mid-caps represent a small portion of the portfolio. Otherwise, MDY is the safer choice. Investors may also benefit from a secular trend change. Over the last ten years, from 2014-2023, MDY underperformed SPY eight times. However, from 2004-2013, MDY outperformed eight times. It also beat by 27.04%, 10.91%, and 7.06% from 2000-2003 as tech stocks crashed, resulting in this optimistic view of mid-cap stocks provided by S&P Dow Jones Indices .
I don't believe there's much value going back 20-30 years to make an investment case, but I am concerned that the Magnificent Seven ( AAPL , MSFT , AMZN , GOOGL , NVDA , META , TSLA ) are responsible for all of SPY's gains this year. Moving away from them seems prudent.
4. As mentioned, MDY trades at 19.63x forward earnings, the highest of the four. It also features the highest estimated sales and earnings per share growth rates (8.63% and 8.56%), so the trade-off makes sense. Not surprisingly, GRPM has the best combination of valuation and growth, but more importantly, its 7.69/10 profit score is the best. Again, designing a fundamentally strong portfolio isn't difficult when you only have 60 holdings. However, I've observed that highly profitable ETFs, no matter the style (value, blend, growth), tend to do well long-term, and MDY's 6.97/10 profit score might be too low. For reference, among U.S. Equity ETFs with market caps between $5-$10 billion, MDY ranks #9/19, right in the middle. RWK ranks last at #19, GRPM's score is #2, and the Invesco S&P MidCap Quality ETF ( XMHQ ) is #1. XMHQ changed indexes effective June 2019, and the results have been impressive since.
5. MDY's price statistics are about average. Over the last year, its constituents delivered a weighted average 10.02% price return, and 116.35% in total returns in the previous five years. However, what stands out are GRPM's 26.37% and 209.62% figures, indicating it's an extreme momentum play. Its Index rebalances semi-annually in June and December, so if you're considering buying but want to limit near-term risk, it makes sense to wait a few months and re-evaluate.
Investment Thesis
MDY is a well-established mid-cap blend ETF with a 0.23% expense ratio and $17.3 billion in assets under management. I determined that its long-term returns and fundamentals are about average. However, investors might benefit from a secular trend change favoring mid-cap stocks, and MDY's relatively low five-year beta and strong diversification features suggest it's a reasonably safe play. One concern I have is quality, as MDY's 6.97/10 profit score ranks only #9/19 among peers with market caps between $5-$10 billion. Another is MDY's slightly higher growth profile, which may be a negative in a market downturn. However, it's a nice ETF for those seeking true mid-cap exposure, and therefore, I give MDY a solid "hold" rating. Thank you for reading, and I look forward to continuing the discussion in the comments section below.
For further details see:
MDY: Well-Diversified, Solid Mid-Cap ETF, But Quality Is Suspect