MGLDF - Medgold Announces Highly Positive Preliminary Economic Assessment for the Tlamino Project Serbia: pre-tax NPV8% of US$ 101 million and pre-tax IRR of 49%
(TheNewswire)
Vancouver, Canada – TheNewswire- January 26,2021 – Medgold ResourcesCorp. (TSXV:MED ) | ( FRA:1XD) ispleased to announce the completion of a positive Preliminary EconomicAssessment (“ PEA ”) for theBarje gold deposit at its Tlamino Project, Serbia(“ Barje ”,“ Tlamino ”, the“ Project ”). Thehighlights of the PEA are as follows:
-
- Based on simple open-pit miningmethods and the production of a flotation concentrate via conventionalprocessing techniques, the pre-tax NPV of the Project, at a discountrate of 8%, is US$101M, its IRR 49%, and its operating margin 61%.
-
- The up-front capital cost of theProject is US$74M (inclusive of a 15% contingency margin and furtherstudy and engineering costs) with payback achieved in two years.
-
- Life of mine C1 cash costs areUS$464/oz Au, and life of mine all-in sustaining costs(“ AISC ”) areUS$522/ounce Au.
-
- A gold price of US$1500/oz and asilver price of US$16.50/oz was used in the study. At an approximatespot gold price of US$1,800/oz, the post-tax NPV of the Project, at adiscount rate of 8%, is US$139M, and its IRR 69%.
It is now the intention of Medgold topursue a program of infill drilling at Tlamino with the objective ofupgrading the current Inferred Resource to the Indicated category, andthe completion of a Pre-Feasibility Study thereafter. Drilling isexpected to commence upon snow melt in Q1, 2021, further details of which will beprovided in due course.
The key financial metrics of the Projectare summarized in Table 1.
Table 1: Barje PEA Key FinancialMetrics 1
| Metric |
| Value |
| Units |
| Revenue |
| 458 |
| US |
| Operating Cost |
| 181 |
| US |
| Peak Funding Requirement |
| 37 |
| US |
| Project Capital Cost |
| 74 |
| US |
| Free Cashflow |
| 153 |
| US |
| LOM C1 Cash Cost |
| 464 |
| US$/oz |
| LOM AISC |
| 522 |
| US$/oz |
| Pre-Tax Project NPV8 |
| 101 |
| US |
| Post-Tax Project NPV8 |
| 86 |
| US |
| Pre-Tax Project IRR |
| 49 |
| % |
| Post-Tax Project IRR |
| 46 |
| % |
| Operating Margin |
| 61 |
| % |
| Payback Period |
| 2 |
| years |
The PEA is preliminary in nature and isbased on Inferred Mineral Resources that are considered toospeculative geologically to have the economic considerations appliedto them that would enable them to be categorized as Mineral Reserves.As such there may be no certainty that the PEA will be realized. Thestudy was undertaken by Addison Mining Services Ltd., Bara ConsultingLtd. and Reach Partners Limited, all of the United Kingdom. ATechnical Report for the Project will be filed on http://www.sedar.com within 45 days.
Jeremy Crozier, President and CEO of Medgold, remarkedthat “the accomplishment of this highlypositive Preliminary Economic Assessment - based entirely onconventional opening pit mining and processing techniques - is acritical success for Medgold. Together with the recent OptionAgreement with Fortuna Silver Mines to acquire full ownership andmanagement control of the Project, Medgold is now placed to unlockfurther value in Tlamino via the completion of infill drilling and aPre-Feasibility Study - with the goals of further demonstrating therobust self-standing economics of the Project, and ultimately theachievement of mine permitting. Addison Mining Services Ltd., Bara Consulting Ltd. and ReachPartners Limited are thanked for their diligence in the preparation ofthe PEA”.
Basis of Preliminary EconomicAssessment
Scoping-level design and preliminaryeconomic analysis thereof was undertaken for the Barje deposit of theTlamino Project. The Mineral Resource Estimate for Barje as announcedon January 30, 2020 has been updated inaccordance with the metallurgical testwork and mining parametersidentified during the course of the current study . An updated Inferred Mineral Resource ofapproximately 7.1 Mt at 2.5 g/t Au and 38 g/t Ag, containingapproximately 570,000 oz of Au and 8.8 Moz of Ag is herein stated andhas been used as a basis for this PEA.
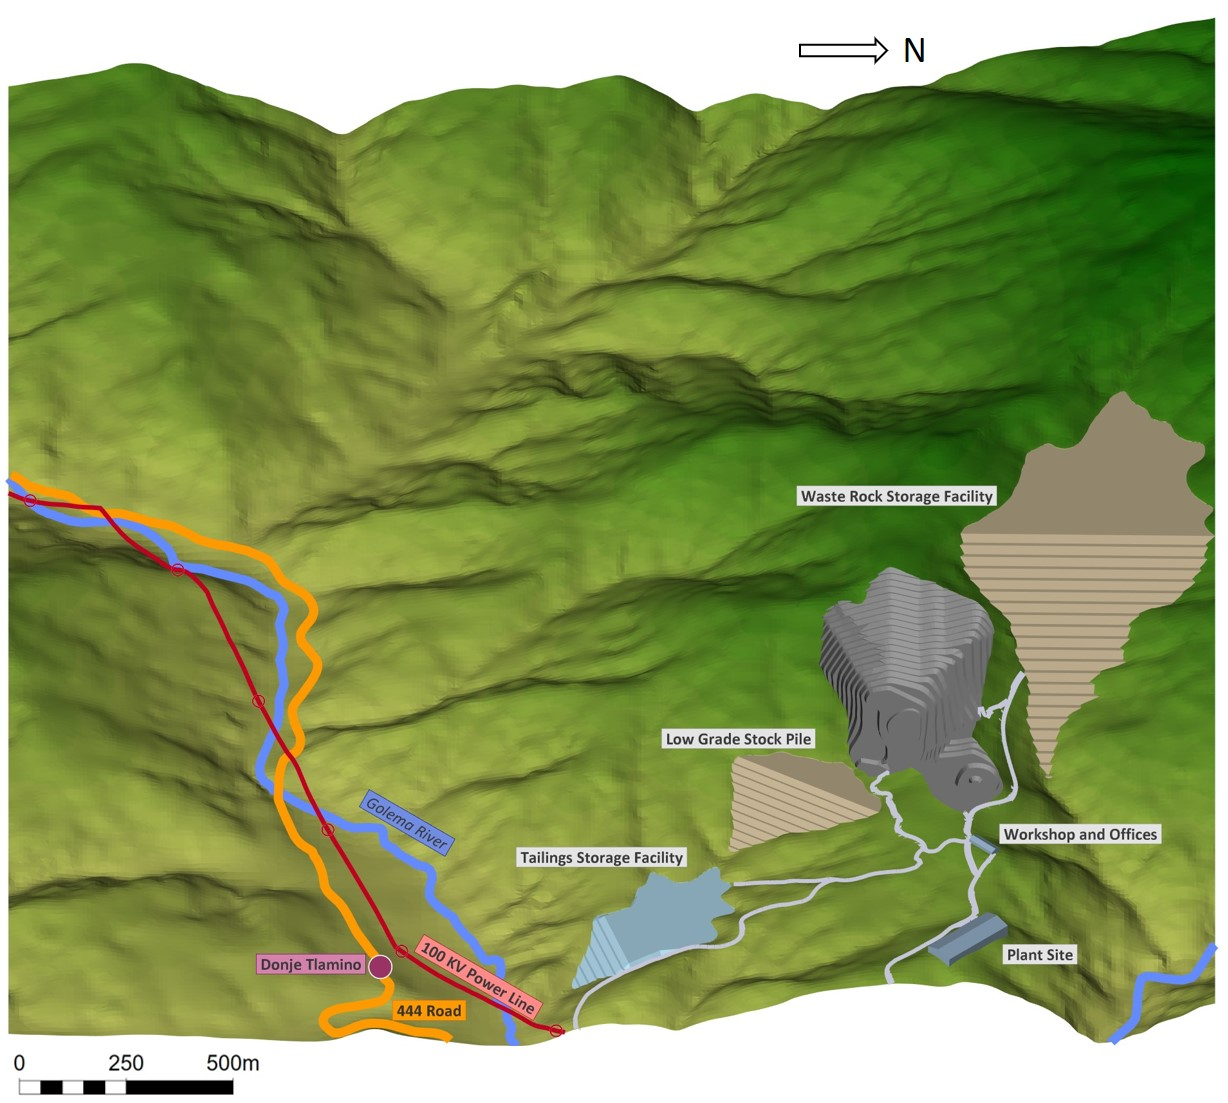
Mining via open pit methods using aconventional truck and shovel fleet is contemplated, deliveringapproximately 600,000 tpa of two Run of Mine (“ ROM ”) material types - High-Grade Breccia(“ HG_BX ”) andLow-Grade Schist (“ LG_Sch ”) - tostockpile for processing, with a life-of-mine stripping ratio ofapproximately 4:1. On site mineral processing is via grinding andflotation to a bulk Au-Ag bearing sulphide concentrate for sale topotential offtake customers in Asia. Preliminary economic analysis hasbeen performed in accordance with the preliminary mine design andschedule, metallurgical testing, and concentrate payability analysisdeveloped in the study, and the estimates and analyses therein havebeen prepared to scoping level (+-30%). Oxidized material from theMineral Resource was not considered by the PEA, and the nearbyprospects at Liska and Karamanica weresimilarly omitted. A preliminary site layout, subject to further study,permitting and land access is shown in Figure 1. Key project parameters are presented in Table2.
6
Click Image To View Full Size
Figure 1: Preliminary Site Layout, Barje (lookingwest)
Table 2: Summary of Project Parameters
| Parameter |
| Value |
| Units |
| LOM Production Rate |
| 710 |
| ktpa |
| Waste Mining Rate |
| 3,310 |
| ktpa |
| LOM Average Strip Ratio |
| 4:1 |
| Waste t:ROM t |
| Average Mined Gold Grade |
| 2.6 |
| g/t |
| Total Mined Gold |
| 390 |
| koz |
| Total Mined Silver |
| 4,022 |
| koz |
| Cut-off Grade - HG_BX |
| 0.6 |
| g/t AuEq |
| Cut-off Grade - LG_Sch |
| 1.14 |
| g/t AuEq |
| LOM |
| 8 |
| years |
| Mining Cost - OPEX |
| 2.30 |
| US$/t mined |
| Process Cost - OPEX |
| 11.50 |
| US$/t processed |
| Base Case Au Price |
| 1,500 |
| US$/oz |
| Base Case Ag Price |
| 16.50 |
| US$/oz |
Mining
The Barje deposit is relatively flat-lying and situatedbeneath shallow to medium-depth overburden. While mining via both openpit and underground techniques were initially considered, an open pitmethod was ultimately selected for the PEA on account of the overalllow volume of waste and the generally low RQD of both waste and orematerial. The PEA contemplates application of open pit mining methodsusing hydraulic excavators and wheel loaders charging articulated dumptrucks for haulage of both waste and ROM material. Mining activitieswill be performed on a contractor basis, and include free-digging ofweathered material, and drilling and blasting of fresh rock.Pre-production mining includes removal and stockpiling of topsoil isalso assumed.
Mining is expected to be completed over four pit stageswith an active life of mine (“ LOM ”) of approximately eight years, followed by a further twoyears of production from stockpile reclamation. Pit and scheduleoptimizations prioritize mining and processing of HG_BX material wherepossible, with LG_Sch material stockpiled and processed periodicallythroughout the LOM. Mining parameters are summarized in Table3.
Table 3: Summary of Mining Parameters
| LOM Summary |
| Total |
| Units |
| Total Rock |
| 31.7 |
| Mt |
| Total Waste |
| 26.0 |
| Mt |
| Total ROM |
| 5.69 |
| Mt |
| LOM Average Strip Ratio |
| 4:1 |
| Waste t:ROM t |
| Plant Feed (All) |
| 5.69 |
| Mt |
| 2.62 |
| g/t Au |
| 38.9 |
| g/t Ag |
| Plant Feed (HG_BX) |
| 3.57 |
| Mt |
| 3.43 |
| Au g/t |
| 56.1 |
| Ag g/t |
| Plant Feed (LG_Sch) |
| 2.11 |
| Mt |
| 1.25 |
| Au g/t |
| 9.9 |
| Ag g/t |
| LOM |
| 8 |
| years |
| Stockpile Reclaim |
| 2 |
| years |
| Total |
| 10 |
| years |
| Peak Production Total Rock |
| 10.6 |
| Mt/year |
| Peak Production Waste |
| 10.0 |
| Mt/year |
| Peak Production ROM |
| 1.4 |
| Mt/year |
| Average Production Total Rock |
| 4.0 |
| Mt/year |
| Average Production Waste |
| 3.3 |
| Mt/year |
| Average Production ROM |
| 0.7 |
| Mt/year |
Processing
Test work on Barje samples reported by Medgold onOctober 28, 2020 demonstrated the production of a flotationconcentrate at a primary grind of 75 µ m grading 48.9 g/t Au and 824 g/t Agwith recoveries to concentrate of 83.4% for gold and 82.4% for silverfrom a composite sample representing the HG_BX material. A secondcomposite sample representing the LG_Sch material produced a flotationconcentrate at a similar grind grading 24.4 g/t Au and 238 g/t Ag withrecoveries to concentrate of 71.2% for gold and 79.2% for silver. Laboratory test work shows that the same grindsize and flotation parameters are applicable to both rock types andcan result in commercially viable concentrates. These results were incorporated into the PEA and were used inre-assessment of the Mineral Resource Estimate.
A flowsheet contemplating crushing, grinding, androugher plus cleaner flotation to a bulk Au-Ag concentrate has beendeveloped based on the metallurgical test program. It is envisagedthat the two ROM material types be processed in the same concentrator,but at different times, i.e. on a campaign basis, in order to maximizerevenue from the HG material.
The PEA provides that ROM material is hauled by trucksand tipped on a storage and blending stockpile. Ball milling with feedprepared by three-stage crushing and screening is further assumed asit is deemed to represent a robust option for this material type. Arougher flotation stage followed by two stages of cleaner flotationare sufficient to produce acceptable concentrate of the previouslyreported specification. Concentrates are dewatered by means of apressure filter, with concentrate filter cake stored and blendedbefore transport by road and sea for processing at toll facilities inAsia.
Tailings are densified in a high-rate thickener beforefinal dewatering by means of a pressure filter before storage in adry-stack type Tailings Storage Facility (“ TSF ”), thus improving thegeotechnical properties of the TSF and maximizing recycling of processwater. Key processing parameters are presented in Table 4.
Table 4: Summary of Mineral ProcessingParameters
| Parameter |
| Value |
| Units |
| Flotation Throughput |
| 600 |
| ktpa |
| Au Recovery HG_BX |
| 85.8 |
| % |
| Ag Recovery HG_BX |
| 84.3 |
| % |
| Au Recovery LG_Sch |
| 76.5 |
| % |
| Ag Recovery LG_Sch |
| 84.3 |
| % |
| Mass Pull |
| 5 |
| % |
| Au grade HG conc |
| 49 |
| g/t |
| Ag grade HG conc |
| 824 |
| g/t |
| Au grade LG conc |
| 24 |
| g/t |
| Ag grade LG conc |
| 238 |
| g/t |
| Recovered Au |
| 390 |
| koz |
| Recovered Ag |
| 4,022 |
| koz |
| Payability – HG conc |
| 75 |
| % |
| Payability – LG conc |
| 40 |
| % |
| Flotation Process Costs - OPEX |
| 11.50 |
| US$/processed t |
| G&A |
| 5.80 |
| US$/processed t |
| Concentrate Transport Cost |
| 3.24 |
| US$/processed t |
Capital Costs
The Project is well-served by existing infrastructureincluding sealed roads and a high voltage power line adjacent to theproperty. Capital costs for mine development, mine infrastructure,processing plant, and surface infrastructure including mine offices,control, plant building, common workshop and stores, changehouse,water, powerline and substation, and earthworks including tailings,roads and platforms were estimated based on current designs and quotesfrom recent comparable projects by Bara Consulting.
Plant capital provides for the design and constructionof a 600,000 tpa flotation plant including crushing, grinding, frothflotation, concentrate and tailings handling facilities includingfiltration of tailings for dry stacking. Infrastructure includes formine support infrastructure, plant infrastructure, dry stack tailingsstorage facility, power (including backup 35 kV line), water andinternal roads. A summary is presented in Table 5. Estimates for closure were also assessedduring the ESIA review process.
Table 5: Capital CostEstimates
| Description |
| Value |
| Units |
| Cost |
| Mine Development |
| 3.25 |
| Mt |
| US$7.5M |
| Process Plant |
| 600,000 |
| tpa |
| US$34.6M |
| Surface Infrastructure |
| US$14.0M |
| Indirect Costs |
| 15 |
| % |
| US$8.4M |
| Contingency |
| 15 |
| % |
| US$9.7M |
| Total |
| US$74.2M |
Operating Costs
A high-level breakdown of operating costs was developedbased on current designs and quotes from recent similar projects byBara Consulting. Mine operating costs include ore mining and wastemining at US$2.30/t, plus a stockpile reclaim cost for LG material ofUS$1/t equating to US$0.50/ROM tonne. Process costs include crushing,grinding, flotation, concentrate handling and tailings handling(including filtration) for 600,000 tpa flotation feed. G&Aincludes on-mine administration and general costs. Concentratetransport is costed for delivery of concentrate CIF to customers inChina. Details are presented in Table 6 below.
Table 6: Operating CostEstimates
| Description |
| Units |
| Cost/Unit |
| Mining |
| Mining Cost - ROM |
| t |
| US$2.80 |
| Mining Cost - Waste |
| t |
| US$2.30 |
| Processing |
| Processing |
| t |
| US$11.50 |
| t |
| US$3.24 |
| G&A |
| t |
| US$ 5.80 |
Economics and Sensitivities
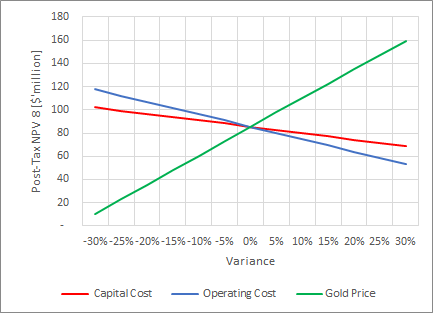
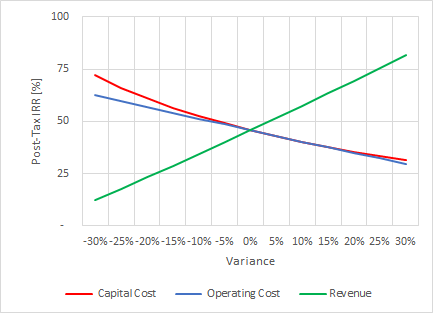
The post-tax NPV of the Project, at adiscount rate of 8%, is US$86M, with an IRR of 46%, and an operatingmargin of 61%. Up-front capital is US$74M with payback achieved in twoyears. Life of mine C1 cash costs are US$464/oz Au, and life of mineAISC are US$522/oz Au. Sensitivity analysis of key capital andoperating cost parameters, and gold price indicates significant upsidepotential to the project are shown in Figure 2. The Project was demonstrated to be most sensitive to variancein gold price, and least sensitive to variances in capital cost.Specific post-tax NPV and IRR sensitivity ranges are presentedin Table 7.
Table 7 NPV and IRR sensitivities, BarjeProspect
| Variance |
| Gold Price US$/oz |
| NPV (8%) |
| IRR |
| Capital Cost (US) |
| NPV (8%) |
| IRR |
| Operating Cost US$/t |
| NPV (8%) |
| IRR |
| -30% |
| 1050 |
| 10 |
| 12 |
| 52 |
| 102 |
| 72 |
| 24 |
| 118 |
| 63 |
| -25% |
| 1125 |
| 23 |
| 18 |
| 56 |
| 99 |
| 66 |
| 26 |
| 112 |
| 60 |
| -20% |
| 1200 |
| 36 |
| 23 |
| 59 |
| 97 |
| 61 |
| 27 |
| 107 |
| 57 |
| -15% |
| 1275 |
| 48 |
| 29 |
| 63 |
| 94 |
| 57 |
| 29 |
| 102 |
| 54 |
| -10% |
| 1350 |
| 61 |
| 34 |
| 67 |
| 91 |
| 53 |
| 31 |
| 96 |
| 51 |
| -5% |
| 1425 |
| 73 |
| 40 |
| 70 |
| 88 |
| 49 |
| 32 |
| 91 |
| 49 |
| 0% |
| 1500 |
| 86 |
| 46 |
| 74 |
| 86 |
| 46 |
| 34 |
| 86 |
| 46 |
| 5% |
| 1575 |
| 98 |
| 52 |
| 78 |
| 83 |
| 43 |
| 36 |
| 80 |
| 43 |
| 10% |
| 1650 |
| 110 |
| 57 |
| 81 |
| 80 |
| 40 |
| 37 |
| 75 |
| 40 |
| 15% |
| 1725 |
| 123 |
| 63 |
| 85 |
| 77 |
| 38 |
| 39 |
| 69 |
| 38 |
| 20% |
| 1800 |
| 135 |
| 69 |
| 89 |
| 74 |
| 36 |
| 41 |
| 64 |
| 35 |
| 25% |
| 1875 |
| 147 |
| 76 |
| 93 |
| 71 |
| 34 |
| 43 |
| 59 |
| 32 |
| 30% |
| 1950 |
| 160 |
| 82 |
| 96 |
| 69 |
| 32 |
| 44 |
| 53 |
| 30 |
Figure 1- 2 - Post-Tax NPV and IRRSensitivity, Barje Deposit
Mineral Resources
Mineral Resources, reported in accordance with NationalInstrument 43-101, Standards of Disclosure forMineral Projects , (“ NI43-101 ”) and the Canadian Institute of Mining, Metallurgy and Petroleum( CIM) Definition Standards, have beenre-estimated for the Barje prospect of the Tlamino Projectincorporating updated metallurgical testwork and mining parametersidentified during the PEA. No Mineral Resources for other prospectswithin the Tlamino Project (Liska, Karamanica) have as yet beendeclared.
The estimated Mineral Resource for Barje, using variouscut-off grades for their respective material types, is approximately7.1 Mt at 2.5 g/t Au and 38 g/t Ag in the Inferred category, andcontaining 570,000 oz of Au and 8.8 Moz of Ag. This equates toapproximately 2.9 g/t AuEq or 670,000 oz AuEq. It is the opinion ofthe Qualified Person for the Mineral Resource Estimate that allelements included in the Au Equivalent calculation (gold and silver)have a reasonable prospect of being recovered and sold.
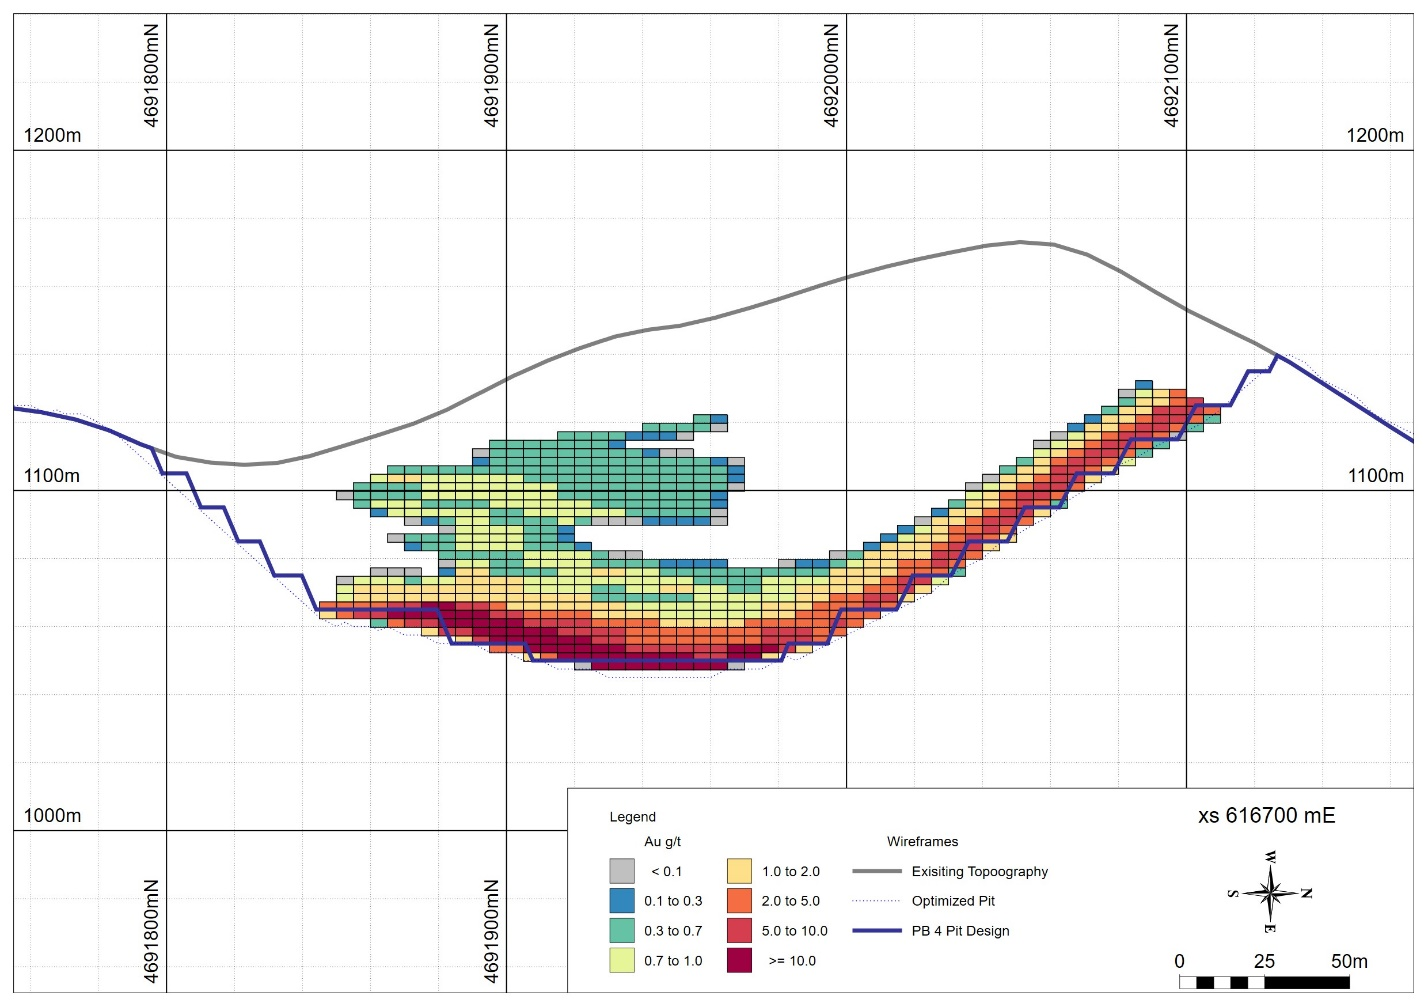
The updated Mineral Resource Estimate has an effectivedate of January 7, 2021 and supersedes the previous initial MineralResource Estimate announced on January 30, 2020; there has, however,been no material change to the estimate in terms of tonnage, grade andcontained metal. See Table 8 for further information relating to the updated MineralResource Estimate. A north-south cross-section illustrating theoptimized Barje pit and block model is shown in Figure 3.
Figure 3: north-south cross-section illustrating theoptimized Barje pit and block model.
No estimates of Mineral Reserves have been completed.Mineral Resources that are not Mineral Reserves do not havedemonstrated economic viability. The estimate of Mineral Resources maybe materially affected by environmental, permitting, legal, title,taxation, socio-political, marketing, or other relevant issues.
The Mineral Resources extend from surface to a depth ofapproximately 110 m, are laterally extensive over an area ofapproximately 600 m from east to west and approximately 350 m north tosouth. The thickness of resource mineralization ranges fromapproximately 10 to 40 m with some isolated thinner areas. It isclosed by bounding faults to the north and south and by drilling tothe east and west. There remains some possibility of identifyingadditional mineralization via infill drilling in areas where the modelis currently interpreted to pinch and in which data are sparse, and inthe northwest corner of the area of mineralization.
Table 8: Mineral Resource Estimate, BarjeProspect
| AuEq |
| Au |
| Ag |
| Tonnes |
| Density |
| g/t |
| Contained oz |
| g/t |
| Contained oz |
| g/t |
| Contained oz |
| Total Inferred Resources |
| 7,100,000 |
| 2.7 |
| 2.9 |
| 670,000 |
| 2.5 |
| 570,000 |
| 38 |
| 8,800,000 |
| Including |
| High Grade Breccia |
| 3,200,000 |
| 2.8 |
| 4.7 |
| 470,000 |
| 3.9 |
| 400,000 |
| 65 |
| 6,700,000 |
| Low Grade Schist |
| 2,400,000 |
| 2.7 |
| 1.2 |
| 96,000 |
| 1.1 |
| 88,000 |
| 8.4 |
| 650,000 |
| Partially Oxidized Material |
| 1,500,000 |
| 2.5 |
| 2.1 |
| 100,000 |
| 1.7 |
| 87,000 |
| 29 |
| 1,400,000 |
Notes to the Mineral Resource Estimate:
-
1. The independent Qualified Person for theMineral Resource Estimate, as defined by NI 43-101, is Mr. RichardSiddle, MSc, MAIG, of Addison Mining Services Ltd since November 2014.The effective date of the Mineral Resource Estimate is January 072021.
-
2. These Mineral Resources are not MineralReserves as they do not have demonstrated economic viability. Thequantity and grade of reported Inferred Resources in this MineralResource Estimate are uncertain in nature and there has beeninsufficient exploration to define these Inferred Resources asIndicated or Measured, however it is reasonably expected that themajority of Inferred Mineral Resources could be upgraded to IndicatedMineral Resources with continued exploration. Additional drilling ishowever required to increase the confidence in the Mineral Resource;increased levels of information brought about by further drilling mayserve to either increase or decrease the Mineral Resources.
-
3. Mineral Resources reported in the above tableare presented as undiluted and in-situ for an open-pit scenario andare considered to have reasonable prospects for economic extraction.The Mineral Resources constrained by open pit optimization.
-
4. Break even cut-off grades were estimated foreach material type of 0.6 g/t, 0.8g/t and 0.5 g/t AuEg for the HighGrade Breccia, Low Grade Schist and Partially Oxidized materialsrespectively, these cut-off grades were used in Resource Reporting.The cut-off grades were calculated on the basis of the followingassumptions: a gold price of US$1500/oz, a silver price of US$16.5/oz,mining costs of US$2.3/t, processing costs including tailings disposalof US$10/t for sulphide rock and US$12/t for oxide, G&A costs ofUS$4/ROMt and transport costs of US$2/ROMt.
-
5. Per metallurgical test workcompleted to date, recovery to concentrate after flotation of 85.8%for gold and 84.3% for silver were used for the High Grade Brecciamaterial with 75% payability. For the Low Grade Schist recoveries usedwere 76.5% for gold and 82.7% for silver with 60% payability. For thePartially Oxidized material 80% recovery via leaching for gold andsilver was assumed with 98% payability. 5% gross royalty was appliedto both metals.
-
6. Geological and block models for the MineralResource Estimate used data from 33 surface drillholes performed byMedgold in 2018 and 2019 ; data from four drillholescompleted by Avala Resources Ltd., a prior operator, were used toconstrain the model though they did not intercept significantmineralization. The drill database was validated prior to resourceestimation and QA/QC checks were made using industry-standard controlcharts for blanks, core duplicates and commercial certified referencematerial inserted into assay batches by Medgold and by comparison ofumpire assays performed at a second laboratory. No QA/QC was possibleon the data relating to the drilling by Avala.
-
7. The geological model as applied to the MineralResource Estimate comprises two mineralized domains, ashallowly inclined high-grade hydrothermal breccia unit and alower-grade schist unit immediately overlying the hydrothermalbreccia. Individual wireframes were created for each domain.Weathering domains of fresh and partially oxidized material weredefined within the two mineralized domains.
-
8. The block model was prepared using Micromineversion 2020, Services Pack 1, A 10 m x 10 m x 4 mblock model was created with sub-blocks of minimum 2 m x 2 m x 2 m ondomain boundaries. Grade estimation from drillhole data was carriedout for Au, Ag, As, Cu, Pb, Zn, Fe, S using Ordinary Kriging and wasvalidated by comparison of input and output statistics, krigingneighbourhood analysis and by inspection of the assay data and blockmodel in cross section. A gold equivalent (AuEq) grade was calculatedfor each block using the formula AuEq = ((Ag g/t) x 0.011)) + (Au g/t)for the High Grade Breccia and Partially Oxidized materials and AuEq =((Ag g/t) x 0.012)) + (Au g/t) for the Low Grade Schist.
-
9. Bulk density values were calculated for eachblock of the model based on a broad linear relationship observedbetween 152 measured bulk density values within the mineralizeddomains and the assayed values of As, Cu, Fe, S, Pb and Zn. Blockswithin the partially oxidized material were assigned a single bulkdensity value of 2.54 g/cm 3 .
-
10. Estimates in the above table have beenrounded to two significant figures.
-
11. CIM Definition Standards for MineralResources have been followed.
-
12. The independent Qualified Person forResources is not aware of any additional known environmental,permitting, legal, title, taxation, socio-political, marketing, orother relevant issues that could materially affect the MineralResource Estimate.
Future Work
Recommendations includeinfill drilling to support the conversion of Inferred to IndicatedResources, and field programs in support of a Pre-Feasibility Study onthe Barje Deposit. This work would include additional geotechnical andhydrogeological investigation, additional metallurgical testing andcommencement of environmental baseline data collection including air,water, soil, fauna and flora studies.
The Tlamino Projectcovers an area of approximately 200km 2 in southern Serbia and is held byMedgold under two exploration licenses. Outcropping mineralizationwas first observed at the Barje Prospect by Yugoslav State agencies inthe 1950s and 1960s when a short adit was opened but no drilling wascarried out. The prospect was then held by private and publiccompanies between approximately 2005 and 2012 during which timelimited drilling failed to intersect significantmineralization.
Medgold conductedmapping, surface sampling and geophysics (IP) followed by diamonddrilling at the Barje Prospect in 2018 and 2019, all fully funded byFortuna Silver Mines Inc. (“ Fortuna ”) under the terms of an Option Agreement announced on May 1, 2017. Thedrilling intersected gold mineralization in a shallowly inclined bodyof hydrothermal breccia below altered schist (as announced on March21, 2019). The Inferred Mineral Resource at the Barje Prospect extendsfrom surface to a depth of approximately 110m as a shallowly inclinedzone over an area of approximately 600 m x 350 m. The true thicknessof mineralization generally ranges between 10 m to 40 m.
On January 7, 2021Medgold announced that, subject to stock exchange approval, it hasentered into a definitive Option Agreement (the “ Agreement ”) with Fortuna to acquireFortuna’s 51% interest in the Project. Theterms of the Agreement provide Medgold with an exclusive option (the“ Option ”) to purchaseFortuna’s interest in the Project for a cash consideration of US$3.468 million. The Option is valid for three years and isexercisable (i) at any time at the election of Medgold prior to theexpiry of the term of the Option; or (ii) at the date of completion ofa sale by Medgold of a 100% interest in the Project to a third party;or (iii) at the date of completion of a merger between Medgold and athird party, whichever arises soonest.
In the event thatMedgold completes a sale of the Project or corporate merger during theterm of the Option and receives consideration in excess of US$ 8.84million (the “ Sale Consideration ”), Medgold will pay to Fortuna an asset sale bonus equalto 10.2% of any amount in excess of the Sale Consideration, less allof Medgold’s costs related to the sale or corporate merger.
Qualified Persons and DataVerification
Mr. Thomas Sant, FGS, CGeol, EurGeol,Consultant Exploration Manager for Medgold and Qualified Person asdefined by NI 43-101, has reviewed and approved the scientific andtechnical content of this news release. Mr. Sant is not independent ofthe Company.
The independent Qualified Persons asdefined by NI 43-101, are Mr. Richard Siddle, MAIG, of Addison MiningServices Ltd for Mineral Resources; Dr. Matthew Randall, FIMMM, of AxeValley Mining Consultants Ltd for Mining; Mr. Ian Jackson, FIMMM, ofBara Consulting for Mineral Processing, and Dr. Andrew Bamber, MCIM,of Bara Consulting Ltd for Economic Analysis.
Medgold is a TSX-V listed, goldexploration companytargeting early-stage properties in the Balkan region. Run by anexperienced management team with a successful track-record of buildingvalue in resource companies , Medgold isfocused on growth through fast-paced exploration and resourcedefinition in the prospective and under-explored Balkanregion .
Additional information on Medgold can befound on the Company’s website at www.medgoldresources.com and by reviewing the Company’s page onSEDAR at www.sedar.com .
JeremyCrozier, President and CEO
ForFurther Information, Contact:
Jeremy Crozier(Vancouver ) , +1 604 801 5432,info@medgoldresources.com
Neither the TSX Venture Exchange nor theInvestment Industry Regulatory Organization of Canada acceptsresponsibility for the adequacy or accuracy of thisrelease.
Certain statements contained in thisnews release constitute forward-looking statements within the meaningof Canadian securities legislation. All statements included herein,other than statements of historical fact, are forward-lookingstatements and include, without limitation, statements about thepotential acquisition by the Company of Fortuna’s interest in theTlamino Project, and the mineral resource estimate and PEA for theTlamino Project. Often, but not always, these forward lookingstatements can be identified by the use of words such as“estimate”, “estimates”, “estimated”, “potential”,“open”, “future”, “assumed”, “projected”, “used”,“detailed”, “hasbeen”, “gain”, “upgraded”, “offset”, “limited”,“contained”, “reflecting”, “containing”, “remaining”,“to be”, “periodically”, or statements that events,“could” or “should” occur or be achieved and similarexpressions, including negative variations.
Forward-looking statements involve knownand unknown risks, uncertainties and other factors which may cause theactual results, performance or achievements of the Company to bematerially different from any results, performance or achievementsexpressed or implied by forward-looking statements. Suchuncertainties and factors include, among others, whether the Company will obtain stock exchange approval tothe Option, and ultimately acquire Fortuna’s interest in the TlaminoProject; the uncertaintiesinherent in the PEA and the estimation of mineral resources; changesin general economic conditions and financial markets; the Company orany joint venture partner not having the financial ability to meet itsexploration and development goals; risks associated with the resultsof exploration and development activities, estimation of mineralresources and the geology, grade and continuity of mineral deposits;unanticipated costs and expenses; and such other risks detailed fromtime to time in the Company’s quarterly and annual filings withsecurities regulators and available under the Company’s profile onSEDAR at www.sedar.com. Although the Company has attempted toidentify important factors that could cause actual actions, events orresults to differ materially from those described in forward-lookingstatements, there may be other factors that cause actions, events orresults to differ from those anticipated, estimated orintended.
Forward-looking statements containedherein are based on the assumptions, beliefs, expectations andopinions of management, including but not limited to: the Company will obtain stock exchangeapproval to the Option; theaccuracy of the PEA and the mineral resource estimate for the TlaminoProject; that the Company’s stated goals and planned exploration anddevelopment activities will be achieved; that there will be nomaterial adverse change affecting the Company or its properties; andsuch other assumptions as set out herein. Forward-looking statementsare made as of the date hereof and the Company disclaims anyobligation to update any forward-looking statements, whether as aresult of new information, future events or results or otherwise,except as required by law. There can be no assurance thatforward-looking statements will prove to be accurate, as actualresults and future events could differ materially from thoseanticipated in such statements. Accordingly, investors should notplace undue reliance on forward-looking statements.
Unless otherwise stated, all tonnesreferenced in this News Release are metric, and ounces are troyounces.
Copyright (c) 2021 TheNewswire - All rights reserved.