QTEC - Median Household Income In September 2022
Summary
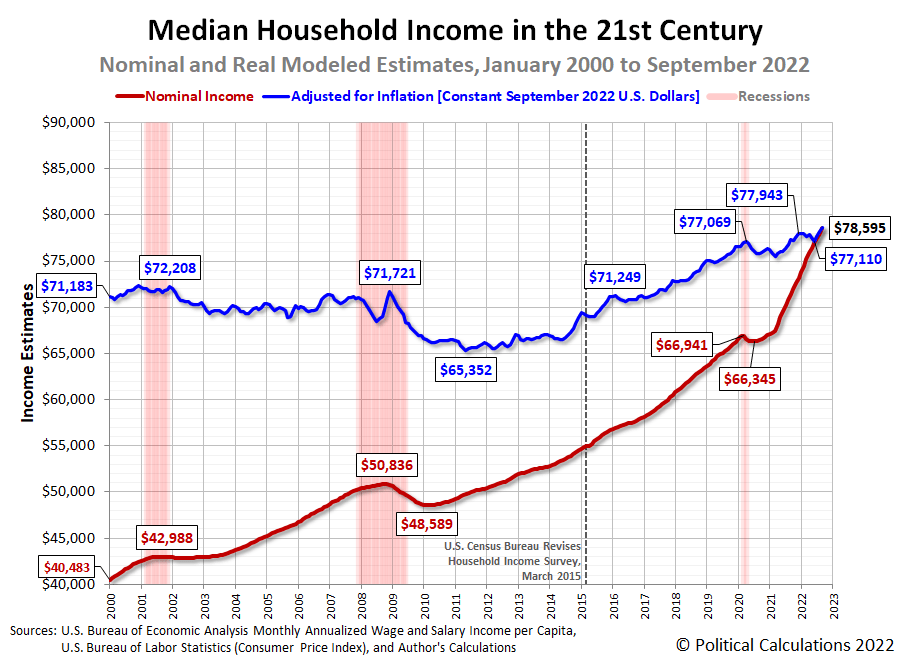
- Adjusted for inflation, September 2022's estimated median household income of $78,595 represents a new record peak for this demographic characteristic, exceeding the previous peak of December 2021 by $641.
- We see that real earned income increased during the third quarter of 2022, after having fallen during the first six months of 2022 while the U.S. economy experienced a "technical" recession.
- BEA made very minor downward adjustments to its aggregate wage and salary data for the months of July and August 2022, which were marked down by less than 0.02% and 0.04% respectively.
Political Calculations' initial estimate of median household income in September 2022 is $78,595 , an increase of $457 (or 0.67%) from the initial estimate of $78,075 in August 2022.
The latest update to Political Calculations' chart tracking Median Household Income in the 21st Century reflects the results of that revision, showing the nominal (red) and inflation-adjusted (Blue) trends for median household income in the United States from January 2000 through September 2022. The inflation-adjusted figures are presented in terms of constant September 2022 U.S. dollars.
Adjusted for inflation, September 2022's estimated median household income of $78,595 represents a new record peak for this demographic characteristic, exceeding the previous peak of December 2021 by $641.
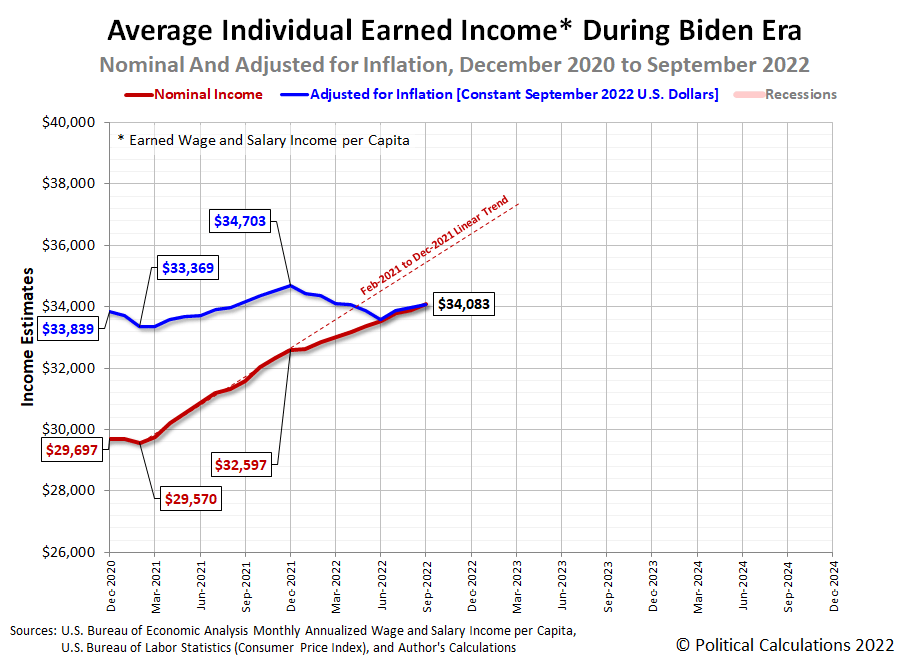
Since there's growing attention on the rising risk of recession in the United States, we were curious to see how the country's average personal earned income is changing because that measure is more sensitive to changing economic conditions. The next chart tracks the average income earned by individual Americans during President Biden's tenure in office and tells a different story about how working Americans are faring.
This chart reveals the average American's earned income, after adjusting for inflation, has fallen well below its December 2021 peak in termms of constant September 2022 U.S. dollars. We see that real earned income increased during the third quarter of 2022, after having fallen during the first six months of 2022 while the U.S. economy experienced a "technical" recession .
The chart also reveals that nominal income growth since December 2021 has slowed substantially compared with how fast it grew during 2021 as the nation's economy recovered from the lifting of state and local government lockdown measures imposed during 2020's coronavirus pandemic. The gap between actual average income growth and a simple linear projection of 2021's income growth if it had continued has steadily widened throughout 2022.
In other words, nominal income growth has slowed and inflation has very noticeably eroded the buying power of individual working Americans during 2022.
Analyst's Notes
After last month's multi-year revision, the BEA only made very minor downward adjustments to its aggregate wage and salary data for the months of July and August 2022, which were marked down by less than 0.02% and 0.04% respectively.
References
U.S. Bureau of Economic Analysis. Table 2.6. Personal Income and Its Disposition, Monthly, Personal Income and Outlays, Not Seasonally Adjusted, Monthly, Middle of Month. Population. [ Online Database (via Federal Reserve Economic Data) ]. Last Updated: 28 October 2022. Accessed: 28 October 2022.
U.S. Bureau of Economic Analysis. Table 2.6. Personal Income and Its Disposition, Monthly, Personal Income and Outlays, Not Seasonally Adjusted, Monthly, Middle of Month. Compensation of Employees, Received: Wage and Salary Disbursements. [ Online Database (via Federal Reserve Economic Data) ]. Last Updated: 28 October 2022. Accessed: 28 October 2022.
U.S. Department of Labor Bureau of Labor Statistics. Consumer Price Index, All Urban Consumers - (CPI-U), U.S. City Average, All Items, 1982-84=100. [ Online Database (via Federal Reserve Economic Data) ]. Last Updated: 13 October 2022. Accessed: 13 October 2022.
Editor's Note: The summary bullets for this article were chosen by Seeking Alpha editors.
For further details see:
Median Household Income In September 2022