OBTC - Mega-Cap Stocks And Cryptos At Potential Breakdown Levels (Technical Analysis)
Summary
- Apple, Tesla, Ethereum and Bitcoin are all resting at pivotal technical levels.
- A breakdown in tandem will likely introduce a fresh wave of selling in the markets.
- US CPI is due on Thursday and poses event risk.
Going into the big US CPI data release on Thursday, the near term and long term trends in risk assets remain lower.
Things may change very quickly, but caution and aggressive risk management are much-needed at present.
Below, I will look at the technical charts for key mega-cap stocks Apple ( AAPL ) and Tesla ( TSLA ), as well as for Bitcoin (BTC-USD) (GBTC) and Ethereum (ETH-USD)( ETHE ).
Tops are typically marked by wide and sloppy price ranges. Moving averages that once supported price tend to meander and converge, signaling a loss in uptrend momentum.
AAPL has built what looks like a double top pattern, and the stock price is now resting right at the pivotal neckline. Moving averages have flatlined and have converged. Price range has widened and volatility increased. Last week, AAPL put in a long tailed bearish candle, wiping out early-week gains. Break below the pivotal neckline and it is highly likely the trend will turn sharply down.
Weekly Chart: AAPL
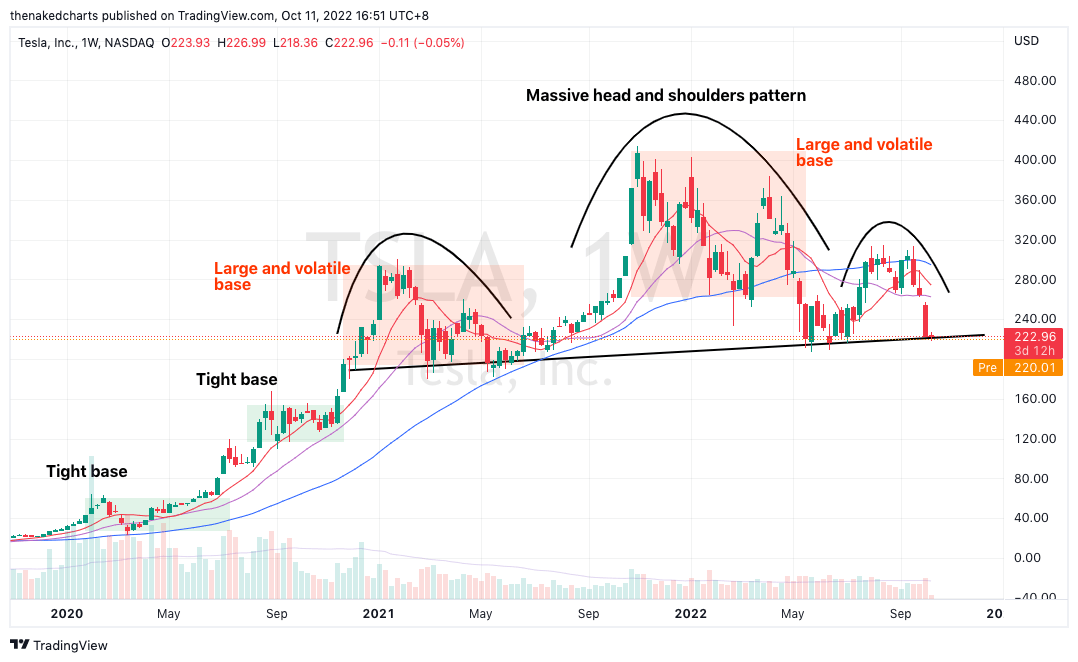
TSLA appears to be tracing out a massive multi month head and shoulders pattern, with price lurching quickly to the neckline to form the right shoulder. Similar to AAPL, price range and volatility have increased, as seen from the sloppy bases being formed. Contrast this with the tight and clean bases formed back in 2020-2021 when the stock was on an uptrend. TSLA now rests right at the pivotal neckline, and looks likely to crack below it.
Weekly Chart: TSLA
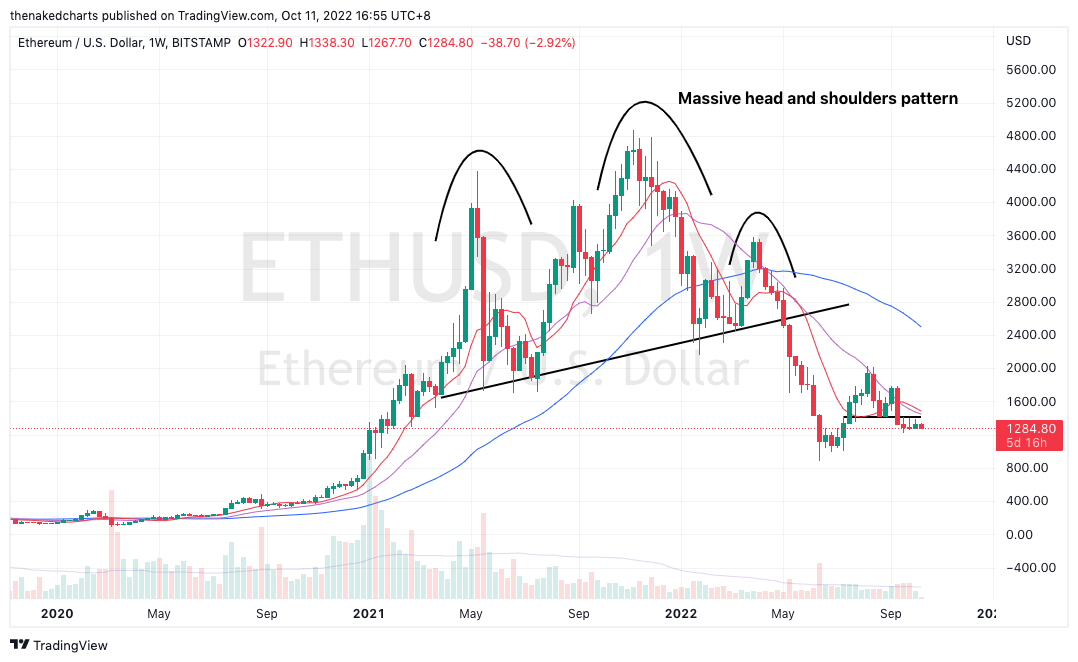
Ethereum had previously traced out a massive head and shoulders pattern. Note the wild price swings and elevated volatility during the topping process. Once the neckline was broken, price just went straight down without much of a respite. In the past month, prices have been tightening, and it feels like Ethereum is gathering energy for another leg down.
Weekly Chart: Ethereum
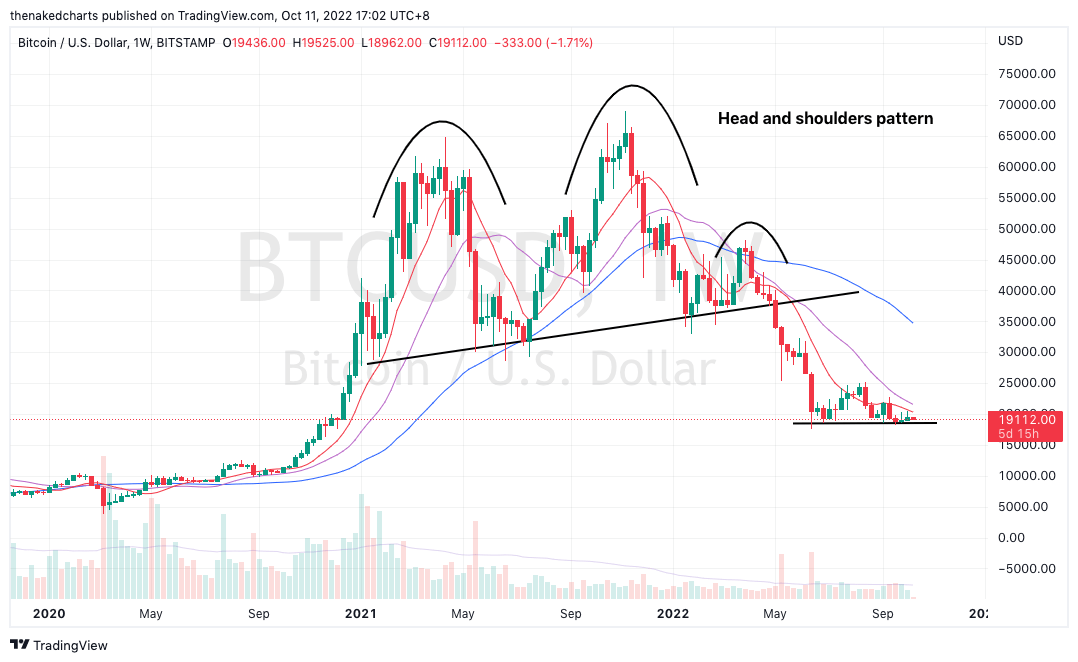
Bitcoin also broke down via a volatile head and shoulders topping pattern. Although it found some respite in the past few months, creating a floor, it looks increasingly likely that this floor will be a temporary one.
Weekly Chart: Bitcoin
Overall, taking into account the selling pressure mega-cap stocks and cryptos are under, we may expect another leg down. So far, although selling in risk assets have been sustained in the past few months, I feel we are still lacking capitulative selling. This is characterized by broad-based emotional selling across all sectors, where participants want to get out at any price. Capitulation selling is a key characteristic of a bottoming process.
For further details see:
Mega-Cap Stocks And Cryptos At Potential Breakdown Levels (Technical Analysis)