MTH - Meritage - Not An Investment Opportunity
2023-07-23 01:18:56 ET
Summary
- Meritage Homes' revenue from 2005 to 2022 was strongly correlated with Housing Starts, making it a cyclical company.
- A valuation of MTH shows that there isn't enough margin of safety unless there's a 1/3 increase in long-term annual average Housing Starts, which I deem unrealistic.
- I would rate MTH's performance and financial position as average. It had not been able to improve its gross profitability over the cycle.
Investment thesis
From 2005 to 2022, there was a strong correlation between Meritage Homes Corporation ( MTH ) revenue and Housing Starts. MTH revenue grew at 4% CAGR during this period.
Housing Starts are cyclical. But over the past 70 years, there was no growth in the long-term annual average Housing Starts. As such, you should view MTH as a cyclical company, but with a small growth path.
A valuation of MTH on such a basis with different gross profit margin assumptions showed that there is not enough margin of safety.
But if you assumed that there would be a 1/3 increase in the long-term annual average Housing Starts, there would be a margin of safety. I do not think that this is realistic. As such I would not invest in MTH at the current price.
Thrust of my analysis
In my article “ Home Builders' Base Rates: A Reference For Better Fundamental Analysis ”, I identified 9 listed home builders. These are companies with readily available financial data from 2005 to 2022 – the latest peak-to-peak Housing Starts cycle. MTH is one of the companies on that list.
I had previously determined the intrinsic values of D.R. Horton, Lennar, M.D.C, NVR, PulteGroup, and Toll Brothers based on their performance over the 2005 to 2022 cycle. Refer to the respective articles for the details.
I will analyze and value MTH using the same approach as those for the others. You can then compare them on an “apple-to-apple” basis. This is the seventh article in my series to determine the cyclical values of the top 9 homebuilders.
My approach for all the companies can be summarized as follows:
- Verify that the company is a cyclical one by determining the correlation between its revenue and Housing Starts.
- Determine the normalized or through-the-cycle performance of the company based on the Housing Starts.
- I considered 2 views of the long-term annual average Housing Starts - 1.5 million units and 2.0 million units. For both cases, I assumed that there is no growth in the long-term annual average Housing Starts.
You can read the rationale/basis for the above approach from the previous articles.
In 2022, MTH reported its performance based on 2 segments – homebuilding and financial services.
My focus was on the performance over the 2005 to 2022 cycle. The crux is then determining the normalized earnings for this period. In this context, I used the following equation for the homebuilding operations.
The Gross Profits for the homebuilding operations were computed based on Gross Profits = Closed units X Average Selling Price X Cyclical Gross Profit Margins. The Cyclical Gross Profit Margins were assumed to be the average 2005 to 2022 Gross Profit Margins (normalized margins).
The above formula was along the lines of Damodaran suggestion to reflect the current size of the business.
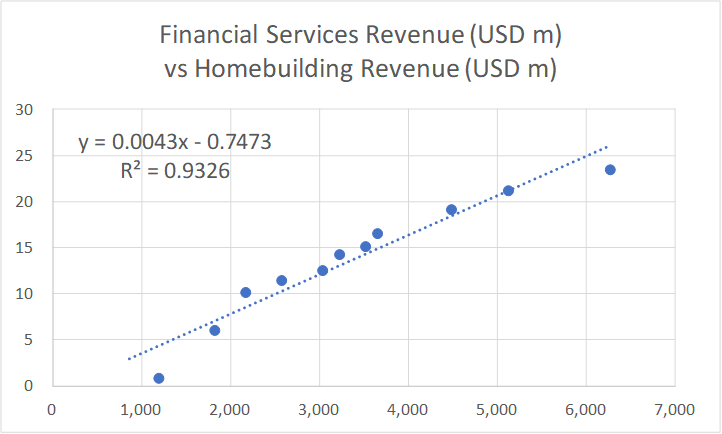
The financial services operations only contributed less than 1 % of the total revenue in 2022. I thus modeled the revenue for this operation based on a linear regression equation. The equation linked the revenue of the financial services operations with that of the homebuilding. This was derived using the EXCEL plotting function as illustrated in Chart 1.
Chart 1: Link between Finance Services Revenue and Homebuilding Revenue (Author)
Note to Chart 1: The Financial Services segment only started in 2013. Thus, the regression equation was based on 11 years of data.
Cyclical sector
From 2005 to 2022, there is a 0.75 correlation between MTH revenue and Housing Starts thus making MTH a cyclical company.
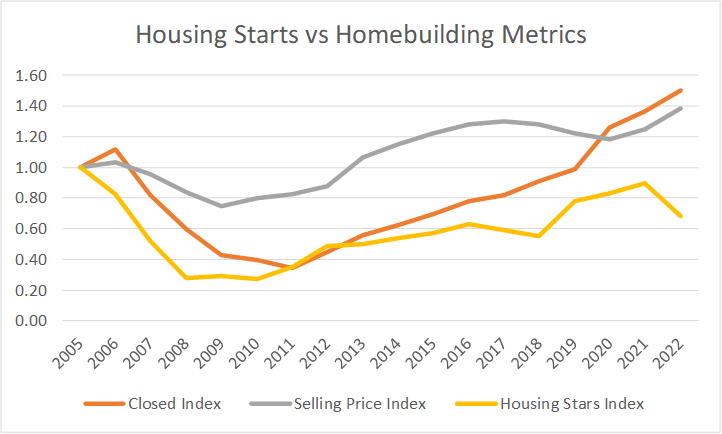
The revenue correlation was driven by a combination of volume growth (Closed units) and increases in the average selling price. Refer to Chart 2.
Chart 2: Correlation between Homebuilding metrics and Housing Starts (Author)
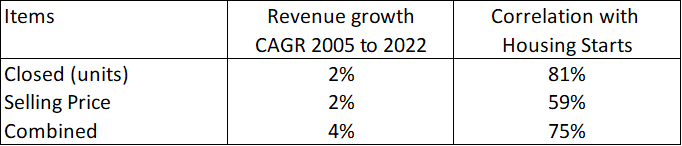
If you break down the correlation, you can see from Table 1 that there is a higher correlation between volume and Housing Starts. You should not be surprised by this finding as Housing Starts are measured in physical units.
Table 1: Trends and correlation of the homebuilding operating metrics (Author)
You can see that both parameters had an equal contribution to the revenue growth.
While there has been very significant growth in house prices as denoted by the House Price Index as per Chart 3, MTH did not fully tap into this. While the Housing Price Index increased by about 80% between 2016 and 2022, MTH only managed to achieve an increase in its average selling price of 8%.
Chart 3: House Price Index (Trading Economics.com)
In my previous articles of this series, I drew the following conclusions based on my analysis of the Housing Starts and House Price Index. Refer to them for the details.
- Over the past 70 years, there is no growth in the long-term annual average Housing Starts. I took this long-term average as 1.5 million units per year.
- In the past 2 years, Housing Starts seemed to be at the long-term annual average level.
- Over the past 70 years, there have been 4 occasions when the annual Housing Starts had exceeded 2 million units.
- You can see from Chart 2 that Housing Starts started to decline in 2022. Is the current drop a temporary pullback from an uptrend? Or is it the start of its downtrend leg?
- While there is no growth in the annual average Housing Starts, there was long-term price growth.
I used these conclusions to determine the various parameters and assumptions for my valuation of MTH.
While nobody disputed the cyclical nature of the sector, we have different views on the long-term annual Housing Starts:
- I have assumed that there is no change to the long-term annual average Housing Starts. My basic argument is that 70 years of data cannot be wrong.
- There are many Seeking Alpha readers who believe that there is some fundamental change to this long-term annual average Housing Starts.
I do not have a crystal ball on how the future will unfold. As such I will value MTH under both views and let you decide what to do. I have already covered the pros and cons of these 2 views in the previous articles. Refer to them.
Performance
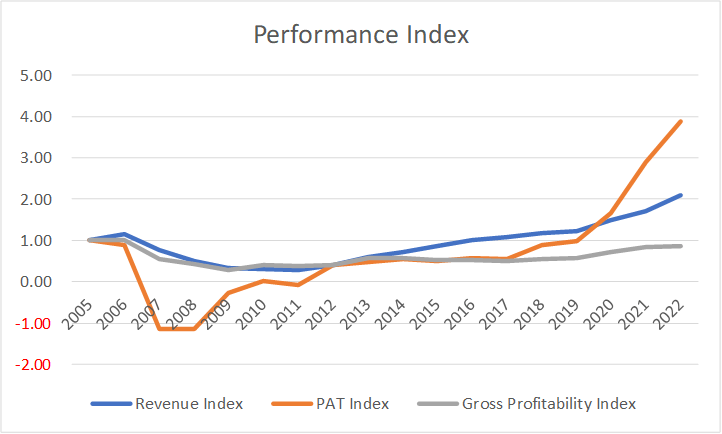
I look at 3 metrics to get an overview of the performance over the cycle – revenue, profit after tax (PAT), and gross profitability (gross profits/total assets).
Chart 4: MTH Performance Index (Author)
Chart 4 shows the performance of MTH over the 2005 to 2022 cycle. During this period, its revenue grew by a CAGR of 4%, mostly via organic growth.
Over the 18 years cycle, DHI incurred losses for 4 years. These were due to large asset write-offs during the trough part of the Housing Starts cycle. To give you a sense of the scale, the total write-off from 2007 to 2009 was 48 % of the 2007 total assets. MTH had the biggest % write-off compared to the other 6 homebuilders covered.
Table 2: Peer Asset Write-offs (Author)
Note to Table 2: These were the total 2007 to 2009 write-offs as a % of the respective 2007 total assets.
In 2022, DHI was a much bigger company compared to that in 2005. Its 2022 revenue is 2 times bigger while its Net Income is about 4 times larger. Unfortunately, its capital efficiency as measured by the gross profitability did not improve.
You can see from Chart 4 that for the past 18 years, the gross profitability was below the 2005 level. The growth in PAT was due to a larger revenue rather than improvements in operating efficiency.
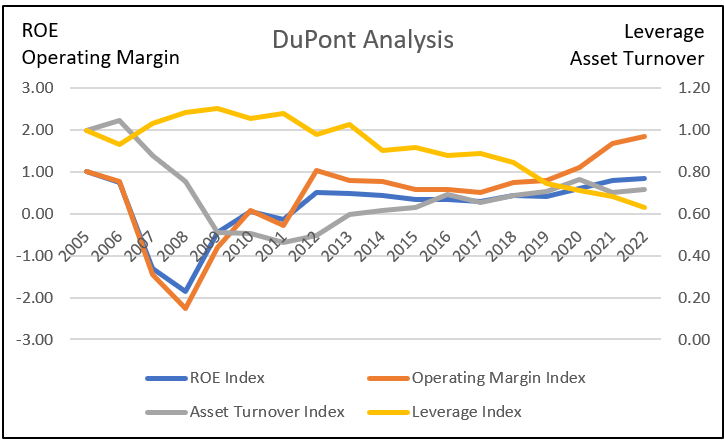
This is illustrated by the DuPont analysis in Chart 5. You can see that the Operating Margin trends mirror that of the ROE. While MTH had improved its Leverage, the Asset Turnover had declined.
Chart 5: DuPont Analysis (Author)
What does all this mean? When valuing MTH over the cycle, we have to:
- Account for some asset write-offs.
- We can ignore improvements in the margins.
Financial position
I would like cyclical companies to be financially sound going into the downtrend leg of a cycle as I do not know how severe the downtrend will be.
I used 4 criteria to assess MTH. I would rate MTH as average as it did ok for the first 2 criteria but not so well on the latter two as follows.
As of the end of Dec 2022, MTH had USD 0.86 billion in cash. This is about 15 % of its total assets. This is in line with the ratios for D.R. Horton, Lennar, TOL Brothers, and PulteGroup which ranged from 7 % to 12 %. However, this is much lower than the 44 % for NVR and the 21 % for MDC.
It has a Debt Equity ratio of 0.30 at the end of Dec 2022. My base rate for the sector was a mean Debt Equity ratio of 0.41 for 2022.
Over the past 18 years, it generated an average of USD 59 million per year in Cash Flow from Operations compared to the average PAT of USD 180 million per year. This seemed a low cash generation ratio. The mean Cash Flow from Operations over the same period for my base rate was USD 328 million compared to the mean PAT of USD 405 million.
Over the cycle, it managed to generate positive Cash Flow from Operations annually for only 8 out of the 18 years. Among the 9-panel companies (including MTH), there was only 1 company that did worse than MTH.
Valuation
I valued MTH based on the single-stage Free Cash Flow to the Firm (FCFF) model.
I focused on 3 Scenarios:
- Scenario 1. I assumed that 2021/22 represented the long-term annual average Housing Starts of 1.5 million units.
- Scenario 2. This assumed that the long-term annual average Housing Starts was increased to 2.0 million units.
- Scenario 3 – This assumed a non-cyclical scenario. I assumed that the 2021 and 2022 performances represented the long-term performance. As such I used the actual average 2021 and 2022 Gross Profit Margins.
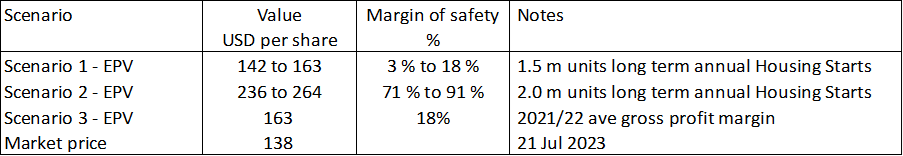
Table 3 summarized the results. There is a range for the values and margins of safety under Scenario 1 and 2 because I used 2 bases to estimate the annualized gross profit margins:
- The average of the annual gross profit margins from 2005 to 2022.
- The normalized gross profit margins = (sum of 2005 to 2022 gross profits) divided by the (sum of the 2005 to 2022 revenue).
Table 3: Summary of MTH Valuation and Margins of Safety (Author)
My target is for a 30% margin of safety. You can see that there is not enough margin of safety under Scenarios 1 and 3. Note that I do not consider Scenario 3 as realistic since it assumed that MTH is not a cyclical company.
But the margins of safety under Scenario 2 are greater than my 30 % target. But the value under Scenario 2 is over-estimated as it is assumed that we are now at the 2.0 million units of Housing Starts. It would take a few more years to reach this level.
Assuming that it would take another 5 years to reach the 2.0 million units of Housing Start, I found that there would be a 38% to 55 % margin of safety. I used a 2-stage FCFF growth model for this. The challenge then is whether this 1/3 increase in the long-term annual average Housing Starts is realistic.
Valuation model
I valued MTH on the same basis as I did for the other homebuilders using the single-stage Free Cash Flow to the Firm (FCFF) model.
Value of the operating assets of the firm = FCFF X (1 + g) / (WACC – g)
Where:
FCFF = EBIT X (1 – t) X (1 – Reinvestment rate)
g = growth rate = the 2005 to 2022 CAGR of 5.1%.
t = tax rate based on the past 3 years’ average rate.
WACC = weighted average cost of capital derived from the first page of a Google search for the term “Meritage WACC” as summarized in Table 4.
Table 4: Estimating the WACC (Various)
The Reinvestment rate was derived from the fundamental growth equation:
Growth = Reinvestment rate X Return.
Return = EBIT(1-t) / Total Capital Employed.
Total Capital Employed = Total Equity + Debt – Cash – Other Investments.
EBIT = Gross profits – Selling, Admin, and Selling or SGA expenses – Other expenses and asset write-downs
Gross Profits
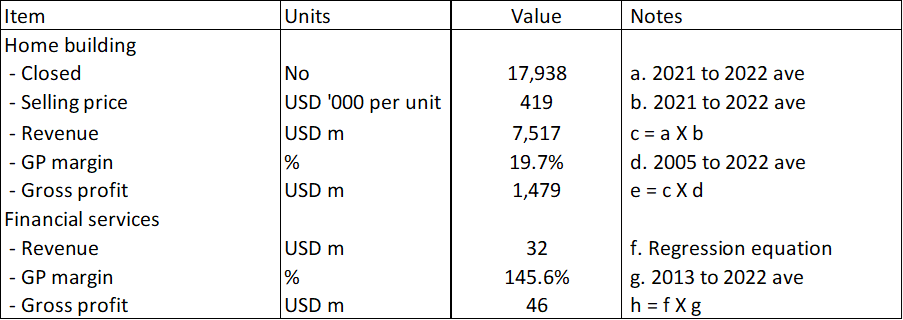
The Gross Profits for MTH were derived as shown in Table 5. The key assumption here is that the sector was operating at the long-term annual average Housing Starts in 2021/22. As such the average 2021/22 Closed units and Average Selling Price represented the values at the normalized size.
Table 5: Deriving the Gross Profits (Author)
Notes to Table 5:
a) The Table illustrates the computation for the 2.0 million Housing Starts Scenario where item a = (2022 to 2022 average) X (2 / 1.5).
g) Starting one year after the start of the financial services as the 2012 value looked like an outlier.
The Gross Profits for the homebuilding operations = Closed units X Average Selling Price X Gross Profit Margins.
The Gross Profits for the financial services operations = Revenue X Gross Profit Margins.
The revenue for the financial services we derived based on the linear regression equation using EXCEL as shown earlier in Chart 1 where:
- Revenue for the homebuilding operations was the independent variable.
- Revenue for the financial services operations was the dependent variable.
Sample calculation
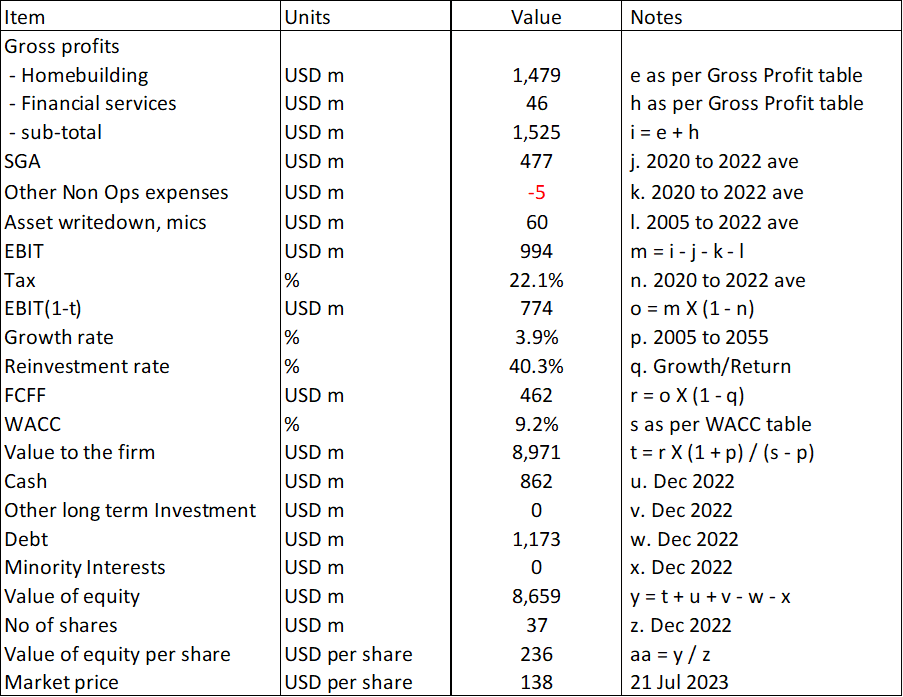
Table 6 shows a sample calculation for the intrinsic value.
Table 6: Calculating the intrinsic value (Author)
Notes to Table 6: Over the past 18 years, MTH incurred some asset write-downs and other one-off charges. I included the average in my valuation.
2-stage FCFF model
I used this model to determine the value assuming that it would take another 5 years to reach the 2.0 million long-term average annual Housing Starts. The key assumptions were:
- The annual growth rates for the next 5 years we set such that the 2022 revenue grew to that based on the 2.0 million Housing Starts.
- The terminal value was assumed to be the value to the firm based on 2 million Housing Starts.
- The discount rate was the same as the average shown in Table 4.
Table 7. Two-stage valuation model (Author)
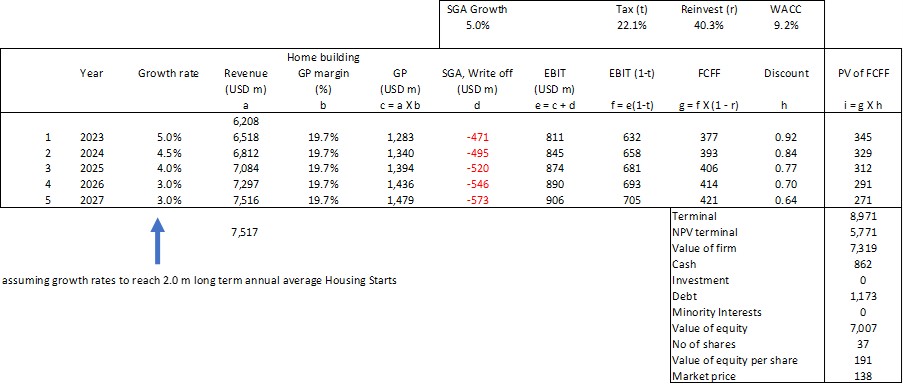
Notes to Table 7:
a) Starting with 2022.
b) Based on 2005 to 2022 average
c) a X b
d) Assumed 5% growth rate based on 2020 to 2022 average.
Risks and limitations
I would summarize the risks and limitations of my valuation into 3:
- High WACC.
- High growth
- Reinvestment rates
The discussions on the WACC are similar to those for the other companies that I have covered. As such I would not repeat them. Refer to my other articles if you want to read them.
As for growth, I have assumed 3.9%. This is based on historical growth and comprised volume growth and price growth. If you accept that there is no growth in the long-term average Housing Starts, you should only consider the price growth component. As such my valuation is on the high side.
Growth needs to be funded and the metric for this is the Reinvestment rate = Reinvestment / EBIT(1-t).
Reinvestment = Net CAPEX – Depreciation & Amortization + Net Acquisitions + Changes in Working Capital.
From 2005 to 2022, MTH incurred about USD 4.1 billion for Reinvestments.
During the same period, it generated 5.5 billion in EBIT. Assuming a 22 % tax rate as per item “n” in Table 6, we have a Reinvestment rate of 4.1 / (5.5 X 0.78) = 95 %.
This is a very high and not sustainable rate. This occurred because, in certain years, MTH incurred high Reinvestments. At the same time, there were losses in certain years.
If I used this 95 % Reinvestment rate for item “q”, Table 6, there would not be any margin of safety under any Scenarios.
Instead I used the growth equation to estimate the Reinvestment rate.
Growth = Reinvestment rate X Return
Reinvestment rate = Growth / Return
Return = EBIT(1-t) / TCE
I computed the EBIT/TCE for each year from 2005 to 2022. I then multiplied the average EBIT/TCE by the 21.1 % tax rate as per item “n” in Table 6. This was my Return.
I then divided the 3.9 % growth rate by this Return to get a Reinvestment rate of 40%.
What does this mean in practice give the growth and Reinvestment rate issues? You may have to seek more than 30% margin of safety.
Conclusion
MTH is a cyclical company. Any analysis, and valuation of MTH should be based on its performance over the cycle.
I assumed that the cycle is represented by the 2005 to 2022 performance. This is pegging it to the latest peak-to-peak Housing Starts cycle.
My valuation of MTH on such a basis showed that I could not get a 30 % margin of safety even with various ways to calculate the gross profit margins. This is based on the view that there is no growth in the long-term annual average Housing Starts under Scenario 1.
But if you assumed that there is a 1/3 increase in the long-term annual average Housing Starts as per Scenario 2, there would be more than a 30% margin of safety.
Is it realistic to assume that there would be an increase in the long-term annual average Housing Starts?
MTH had the following to say about the housing market in its 2022 Form 10k:
“…constraints combined with the uncertainty of future interest rates, inflation levels and deterioration in the general economy…are applying current downward pressure on the housing market, …we believe favorable homebuyer demographics support long-term demand, although at a more normalized pace than what was experienced in the past two years...”
Vitaliy Katsenelson in his Nov 2022 article “ Are housing prices about to drop? A value investor’s take ” had a negative outlook.
“Currently, the 30-year mortgage rate is pushing 7.6%, up from less than 3% a year ago, while the median house price in the US is up 37% from $320k in 2019 to $440k today. You cannot have both interest rates and housing prices making new highs. Something’s got to give.”
To be fair, they did not opine whether there will be an increase in the long-term annual average Housing Starts. But they do not present an upbeat picture in the short to medium term.
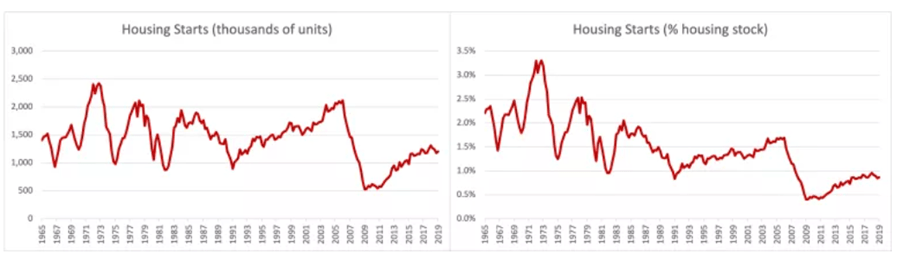
For those who are upbeat about the increase in the long-term annual average Housing Starts, Chart 6 should give you a different perspective. It is from the article “ U.S. Data on Housing Starts Can Be Misleading ” from the Mercatus Center, George Mason University.
The basic argument is that when looking at Housing Starts, we should not look at absolute numbers. Rather we should look at this as a % housing stocks.
You can see from Chart 6 that as a % of housing stocks, the Housing Starts have been declining since peaking in 1970.
Moral of the story? It makes the 1/3 increase in the long-term annual average Housing Starts a more difficult one to justify.
Chart 6: Housing Starts Expressed as Absolute Numbers (Left) and As a Percentage of Total Housing Stock (Right) (Mercatus)
I would not invest in MTH at the current price since the margin of safety comes from a Scenario where there is a 1/3 increase in the long-term average annual Housing Starts.
I am a long-term value investor and my analysis and valuation are based on the long-term prospect of a company. This is not an analysis for those seeking to make money over the next few weeks or months.
For further details see:
Meritage - Not An Investment Opportunity