MIELY - Mitsubishi Electric Corporation: Time To Buy
2023-09-20 03:33:00 ET
Summary
- A comparables analysis gives ambiguous results, forcing me to stick with an alternative valuation technique.
- The company has set optimistic medium-term targets, including increasing operating profit margin and doubling ROE.
- Despite risks such as global economic recovery and supply chain problems, the company is on track to meet its goals and offers potential for price appreciation.
Investors tend to find shelter in dividend stocks in periods of high interest rates. I am not a fan of those shares as they usually don't create value for stakeholders, thus there is a limited chance of speculation in a short-term price increase. But it seems I accidentally found one, which will prize you with price appreciation and also pay dividends. It is Mitsubishi Electric Corporation ( MIELY ) (MIELF). I establish a “Buy” rating and through peers and detailed statements analysis, I will end up with my price target.
Company Overview
Mitsubishi Electric is the Japan-based leader in manufacturing, marketing, and sales of electrical and electronic equipment in information processing and communications, space developments and satellite communications, consumer electronics, industrial technology, energy, transportation, and building equipment. Business segments are divided into: energy and electric systems, industrial automation systems, information and communication systems, electronic devices, home appliances, and others. Basically, they produce everything from turbine generators to room air conditioners. Its shares are represented on the OTC market as an ADR MIELY. It has no Quant Rating and none of the analysts have covered it yet.
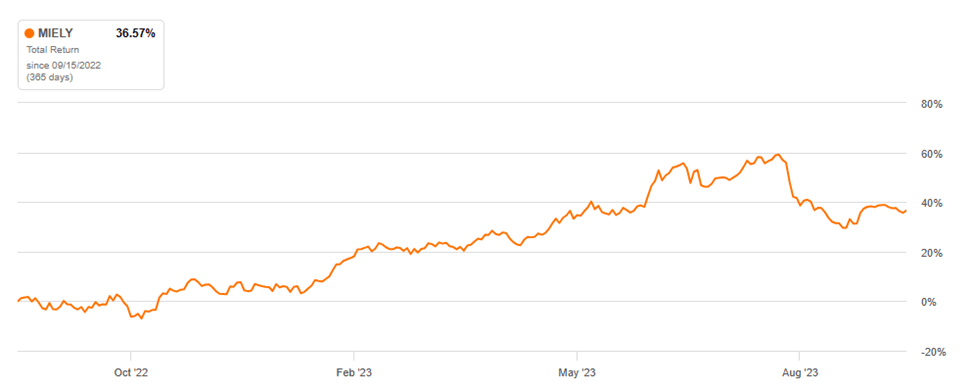
It had a whopping 36.75% 1-year Total Return to its stakeholders and gave optimistic guidance till the year 2026.
MIELY 1-year Total Return ( Seeking Alpha )
Peer analysis
| Average |
| Sector Median |
| MIELY |
| Total Return (1 year) |
| -8.15% |
| 114.77% |
| 22.78% |
| -9.58% |
| 8.36% |
| 0.28% |
| 21.41% |
| -4.13% |
| 36.86% |
| P/E ((FWD)) |
| 12.97 |
| 16.35 |
| 27.04 |
| 13.3 |
| 16.92 |
| 25.64 |
| 18.70 |
| 19.85 |
| 22.47 |
| EV/Sales ((FWD)) |
| 1.51 |
| 2 |
| 4.13 |
| 0.67 |
| 1.14 |
| 1.79 |
| 1.87 |
| 1.71 |
| 0.72 |
| EV/EBITDA ((FWD)) |
| 8.24 |
| 16.76 |
| 15.81 |
| 9.11 |
| 6.69 |
| 12.56 |
| 11.53 |
| 11.08 |
| 6.91 |
| Dividend Yield ((FWD)) |
| 2.68% |
| 0.28% |
| 2.11% |
| 1.95% |
| 1.14% |
| 1.63% |
| 1.55% |
| 2.26% |
| P/Sales ((FWD)) |
| 1.84 |
| 1.95 |
| 3.82 |
| 0.6 |
| 0.98 |
| 1.72 |
| 1.82 |
| 1.35 |
| 0.76 |
| Profit Margin |
| 2.24% |
| 4.49% |
| 6.51% |
| 4.41% |
| 5.20% |
| ROE ((TTM)) |
| 4.72% |
| 6.51% |
| 11.91% |
| 6.90% |
It seems that the whole sector was generous to investors on average for the past 1 year with an average Total Return of 21.41% . It is very difficult to compare MIELY with an average and median figure suggesting that it is overvalued in P/E but undervalued in all other multiples. The profit margin is a bit higher than the average for domestic players providing higher ROE. Daikin`s ROE suggests that the company`s target to reach 10% (we will talk later on) shortly is possible. The dividend yield is also higher than the average, which can be another plus for investors. For the rest, multiples show little info for valuation so let's move on to past performance and future guidance to prepare a basis for the price target.
Future targets and key drivers
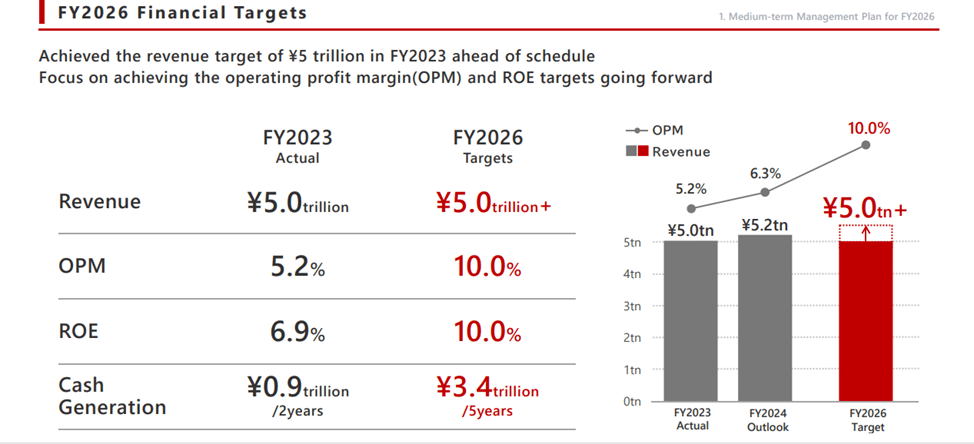
The company sets optimistic medium-term targets. With revenues staying flat, it plans to consistently increase the operating profit margin and almost double the ROE.
Mitsubishi Electric medium-term targets (Mitsubishi Electric presentation)
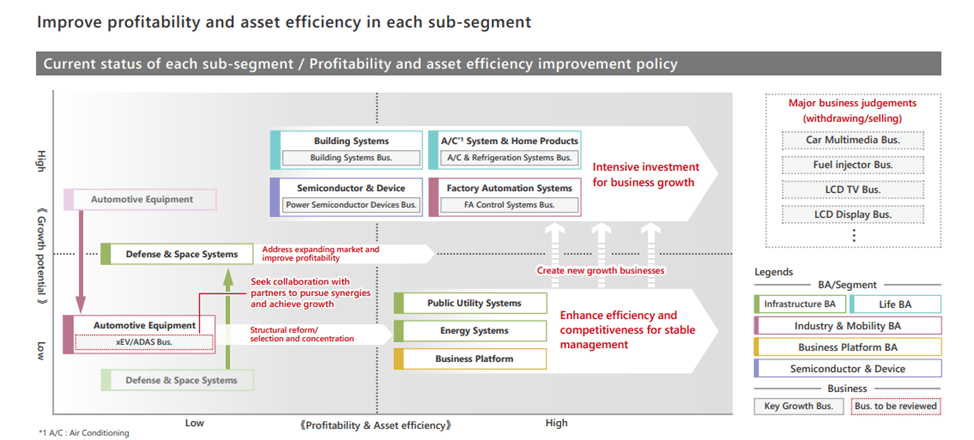
To reach its guidance the company is planning to strengthen investments in key growth businesses and improve asset-efficiency. Moreover, the company plans to invest more money in R&D in the segments with the highest potential and higher margins while decreasing or selling businesses with lower margins and future perspectives.
Segments and ways to improve (Mitsubishi Electric presentation)
I have to mention that the company forecast was made when the USD/JPY exchange rate was around 130, while it is weaker now, suggesting further revenue increase.
Latest Quarterly Results
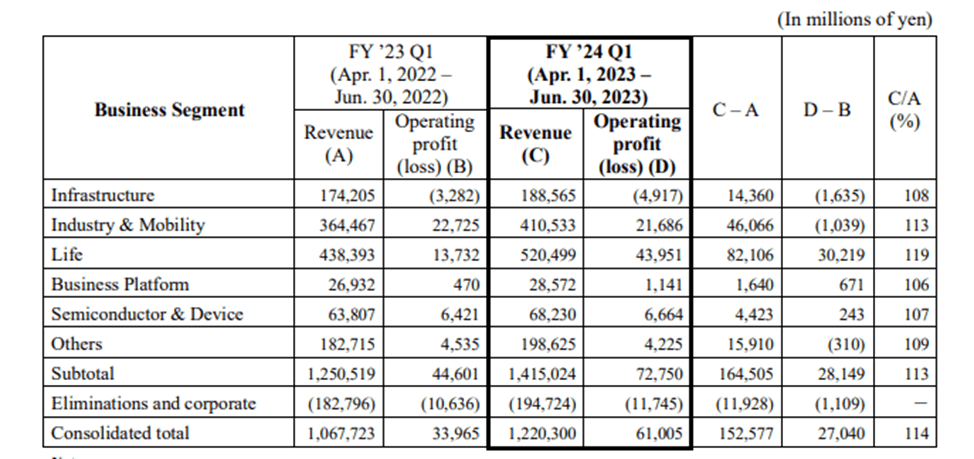
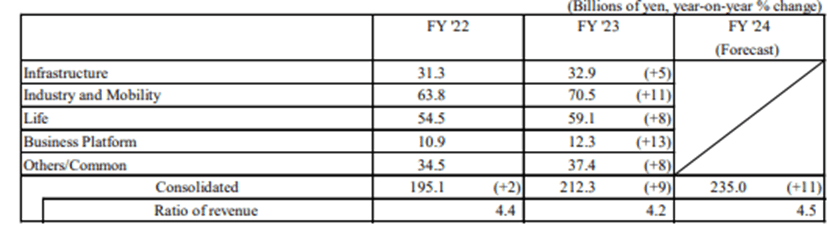
Despite the market swings, the household sector in Japan continued to recover. The table below shows that the company sticks with its strategy to increase margins and decrease the operations that provide less profits.
The first quarter revenue by segments comparison FY23 and FY24 (Mitsubishi Electric the First Quarter results FY24)
Revenue figures were also higher, but this was due to a weaker yen. The Life segment increased due to robust demand, while the Mobility segment increased due to eliminating order backlog. All in all, stable asset turnover and higher profit margins will allow them to reach ROE targets. Increased costs and shifts in project portfolios increased operating profit loss in the segments of Infrastructure and Industry & Mobility.
| 2023E |
| 2022 |
| 2021 |
| 2020 |
| 2019 |
| Asset turnover ((ATO)) |
| 1.6 |
| 1.6 |
| 1.7 |
| 1.7 |
| 2.2 |
| Profit Margin ((PM)) after tax |
| 5.0% |
| 4.3% |
| 4.5% |
| 4.6% |
| 5.0% |
R&D investments were rising as well which will have a positive impact on the future numbers.
R&D expenditures by segments (Mitsubishi Electric annual results FY23)
Life, Business Platform, and Semiconductor & Devices segments were the main contributors to the operating profit increase. The cost optimization resulted in a higher gross margin. It seems that the company is on its way to medium-term goals.
| H1 2023 |
| 2022 |
| 2021 |
| 2020 |
| 2019 |
| Cost of sales |
| 71.07% |
| 71.88% |
| 71.75% |
| 71.98% |
| 71.71% |
| Gross margin |
| 28.93% |
| 28.12% |
| 28.25% |
| 28.02% |
| 28.29% |
| Operating expenses |
| General and administrative |
| 23.81% |
| 22.94% |
| 22.64% |
| 22.75% |
| 22.79% |
Risks
All the forecasts are based on the global economy's slow recovery, prolonged inflation, and geopolitical risks that will change expectations and harm growth perspectives.
The Group's medium-term plan implies M&A that may not have a positive synergy. Supply chain problems will continue to affect the performance, harming optimal global production.
Rising costs will be passed to prices affecting the demand.
Valuation methodology
I used the same methodology as in my previous article , but there are some differences. As the company guided ROE, Sales, and PM, I have simulated what the statements would look like. Return on net operating assets almost equals ROE (in this case), leaving me to stick with a familiar indicator. The required return is WACC-calculated .
Valuation inputs and results
| Year |
| FY 2023 |
| FY2024E |
| FY2025 |
| FY2026 |
| Profit Margin ((PM)) |
| 5.2 |
| 6.3 |
| 8.15 |
| 10 |
| Profit margin after tax |
| 4.30% |
| 5.0% |
| 6% |
| 8% |
| Operating profit |
| 213908 |
| 260000 |
| 317434.3 |
| 416307.34 |
In millions of yen
In the table above I calculated the future operating profit from the ROE targets and Profit Margins provided in the guidance. The cost of capital is WACC-calculated and equals its average number of 5%.
| Year |
| FY2023 |
| FY2024E |
| FY2025E |
| FY2026E |
| Tax rate |
| 21% |
| 21% |
| 21% |
| 21% |
| Sales |
| 5003694 |
| 5200000 |
| 5203841.8 |
| 5203841.8 |
| Cost of sales |
| 3596781 |
| 3702400 |
| 3746766.1 |
| 3746766.1 |
| Operating expenses |
| 1147981 |
| 1196000 |
| 1196883.6 |
| 1196883.6 |
| Core operating income (before tax) |
| 258932 |
| 301600 |
| 260192.09 |
| 260192.09 |
In millions of yen
Simulating the future balance sheets and income statements, I end up with the return on net operating assets. Deducting the cost of capital brings residual operating income.
| Balance |
| Account receivables |
| 1051641 |
| 1040000 |
| 1040768.4 |
| 1040768.4 |
| Inventory |
| 1209254 |
| 1300000 |
| 1300960.4 |
| 1300960.4 |
| ((PPE)) |
| 896313 |
| 912280.7 |
| 912954.69 |
| 912954.69 |
| Other Net Operating Assets ((NOA)) |
| -26587 |
| -27660 |
| -27680 |
| -27680 |
| ((NOA)) |
| 3130621 |
| 3224621 |
| 3443895 |
| 4557954 |
| Cost of capital |
| 5.00% |
| Return on net operating assets ((RNOA)) |
| 8% |
| 9% |
| 10% |
| Re sidual operating income (ReOI) |
| 101119 |
| 133370 |
| 200046 |
| Growth in ReOI |
| 32% |
| 50% |
| Discount rate |
| 1.05 |
| 1.10 |
| 1.16 |
| Discounted ReOI |
| 96304 |
| 120971 |
| 172807 |
| Total Present value ((PV)) of ReOI |
| 390082 |
| C ontinuing V alue ((CV)) |
| PV of CV |
| 5875454 |
| ((NOA)) 2022 |
| 3130621 |
| Value of operations |
| 9396157 |
| Net Financial Assets ((NFA)) |
| 232603 |
| Value of equity |
| 9482207 |
| Number of shares |
| 2112 |
| Value per share |
| 4490 |
| 30.34$ |
In millions of yen except per share items
Summing up future flows with continuing value and common shareholder's equity and dividing by shares outstanding, we get a price target.
Valuation risk
The financial targets are outsourced from the company`s guidance, leaving the dependence on their outlook. If the growth rate continues to rise this year, it will result in a higher price target. Due to accounting principles, some of the figures I used in my reformulation might be slightly off, but I tried to minimize their influence. The latest quarter statements and annual statements lack some disclosure, for example, the are no notes regarding allowances, making it difficult to calculate receivables -- although this had only a minor effect on my calculations. WACC calculations are outsourced, but reasonably match my own. As the company is trading overseas in JPY, there is a risk of exchange rate swings which affect the US dollar price target. The tax rate wasn’t provided in the statements, I used the effective one.
Conclusion
At the moment when I am writing this article USD/JPY exchange rate is around 148 , suggesting that the fair price per share is 30.34$. Today`s price 26.05$ gives a solid 16.5% upside (excluding dividends) potential. Continuing to reach its medium-term plan and increasing ROE together with buybacks planned (at a price lower than fair) create more value for shareholders. I give Mitsubishi Electric Corporation a “Buy” rating and will continue to follow their results.
For further details see:
Mitsubishi Electric Corporation: Time To Buy