WSR - Monthly Dividend Magic: The REIT Royal Flush
2023-11-03 07:00:00 ET
Summary
- VICI Properties CEO is considering implementing monthly dividends.
- Realty Income, Agree Realty, STAG Industrial, and LTC Properties are highlighted as monthly dividend-paying REITs.
- Whitestone REIT's dividend history is less strong compared to other monthly payers, but its current dividend is considered secure.
Yesterday I interviewed VICI Properties ( VICI ) CEO, Ed Pitoniak.
As I do with many of my c-suite interviews, I always like to ask the CEO about the safety of the dividend and the frequency of the dividend.
In terms of dividend frequency, Pitoniak said, “Monthly dividends. We should and we will take a look.”
That’s a glimmer of hope at least, and something that I would like to see more REITs considering.
In terms of safety, Pitoniak said, “we have a 75% payout ratio, so it’s extremely well covered. We have a history of dividend growth that’s the best in the net lease sector.”
I understand why most REITs don’t really care about the frequency of the dividend payout.
After all , the “big fish” institutional investors could care less about a monthly dividend, or even a quarterly dividend, as far as that’s concerned.
Conversely, I find it interesting that most REITs in Canada pay monthly dividends.
My theory is that most Canadian institutional investors prefer private real estate and that Canadian retail investors love real estate.
Regardless, there appears to be a growing number of U.S. retail investors who enjoy monthly payers, which is a reason I decided to put together a monthly dividend magic article (like the one you’re reading right now).
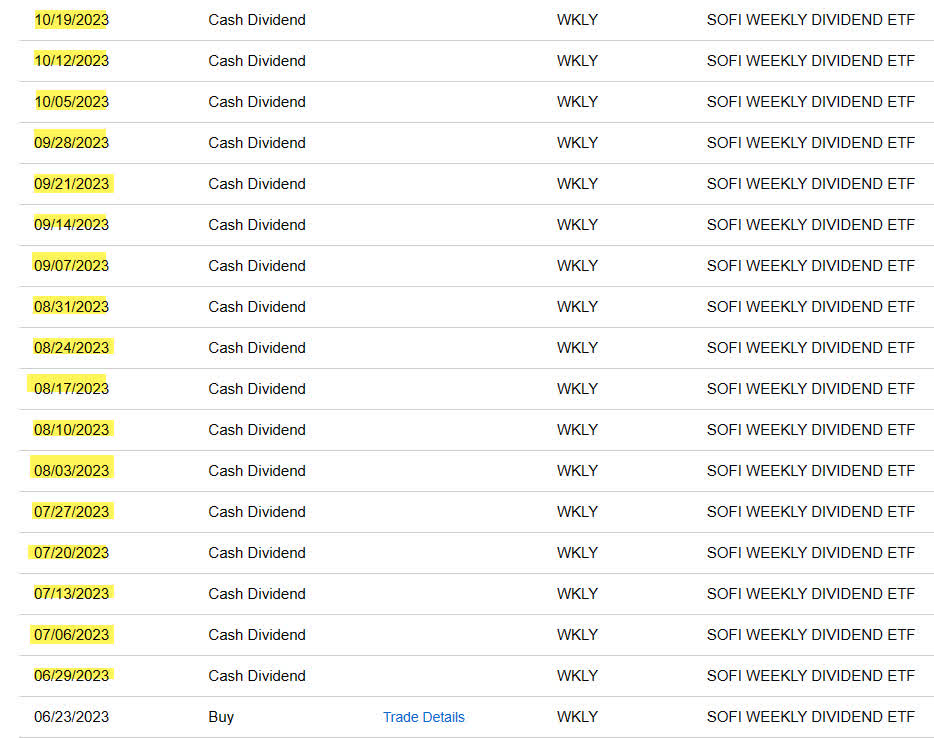
A few months ago, I wrote an article on SoFi Weekly Dividend ETF ( WKLY ), the first equity ETF that pays out income distributions on a weekly basis.
With assets under management of around $10 million, it’s obvious that there’s limited demand for weekly dividend income. I bought a few shares myself, and as you can see, I get paid every Thursday – like clockwork.
Charles Schwab
I doubt there will be a weekly paying REIT, but who knows?
So, without further ado, let’s recap my favorite monthly-paying REITs:
Realty Income ( O )
Realty Income, otherwise known as “The Monthly Dividend Company,” is a real estate investment trust (“REIT”) that invests single-tenant, free-standing commercial properties which are leased to more than 1,300 tenants on a long-term, triple-net basis.
As of the end of the second quarter, Realty Income’s portfolio consisted of more than 13,000 commercial properties covering approximately 255.5 million square feet which are located in 50 U.S. states, the U.K., Spain, Italy, and Ireland.
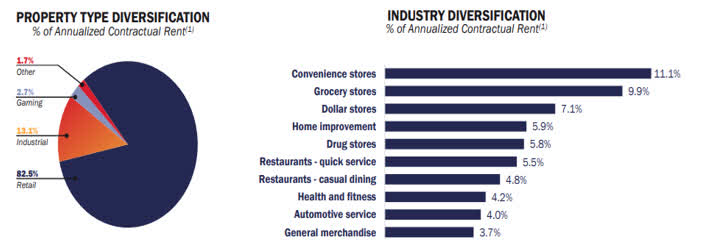
Approximately 82.5% of their contractual rent is derived from retail properties, 13.1% is generated from industrial properties, and 2.7% is derived from gaming properties.
By industry, their largest property type are convenience stores which makes up 11.1% of their contractual rent, followed by grocery stores which makes up 9.9% of their rent.
As of their most recent update, their total portfolio had a physical occupancy of 99.0% with a weighted average lease term (“WALT”) of roughly 9.6 years.
O - IR
Realty Income has recently made several significant acquisitions. Last August the company announced its $950 million investment in the Bellagio Las Vegas to acquire both common and preferred equity interests from Blackstone Real Estate Income Trust (“BREIT”) and on Oct. 30, 2023, Realty Income announced that it was acquiring Spirit Realty ( SRC ) in an all-stock transaction with an approximate enterprise value of $9.3 billion.
Once the merger has been approved and closed, SRC shareholders will receive 0.762 shares of newly-issued O stock for each share of SRC they own, which will result in Realty Income and Spirit Realty shareholders owning roughly 87% and 13% of the combined company, respectively.
Sumit Roy, the CEO of Realty Income, stated that:
"We expect that this transaction will create immediate and meaningful earnings accretion, while enhancing the diversification and depth of our high-quality real estate portfolio. Spirit's assets are highly complementary to our existing portfolio, extending our investments in industries that have proven to generate durable cash flows over several economic cycles.”
The transaction is expected to increase Realty Income’s property count from 13,118 to approximately 15,182 and provide more than 2.5% accretion to Realty Income’s adjusted funds from operations (“AFFO”) while maintaining a conservative leverage ratio (net debt plus preferred equity to adjusted EBITDAre) of 5.5x.
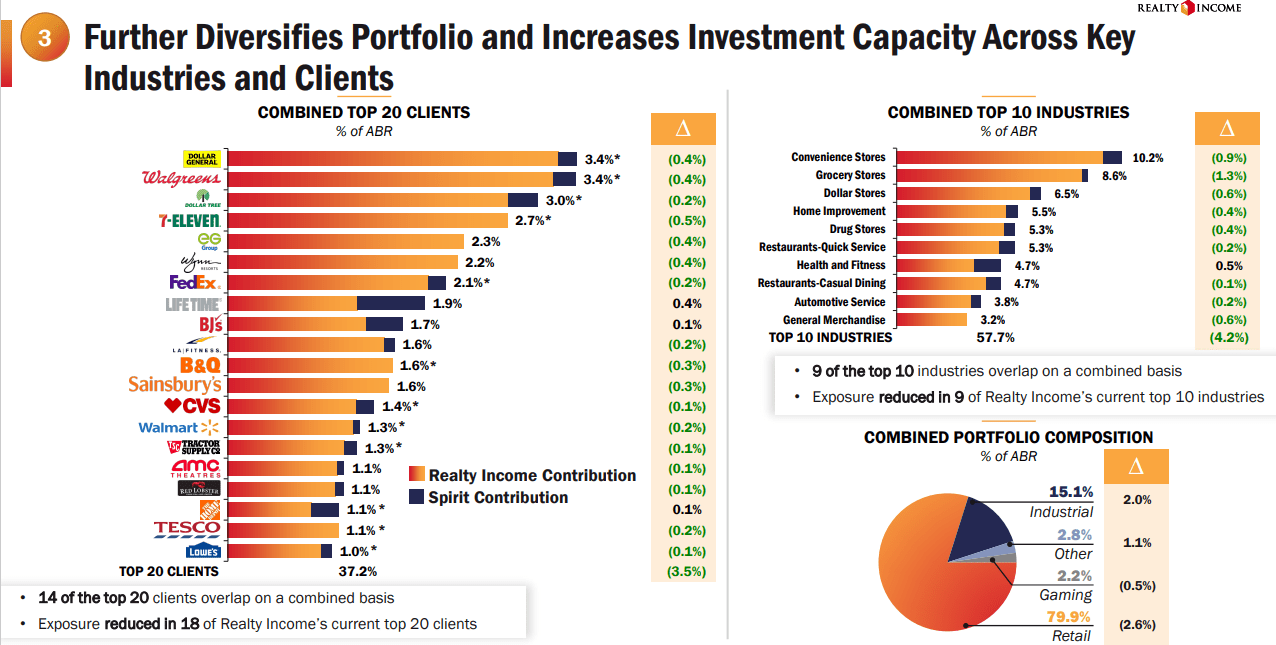
Additionally, the combined portfolio is expected to reduce Realty Income’s rent concentration for 18 out of its top 20 tenants, and for nine of their top 10 industries, while increasing O’s contractual rent from $3.8 billion to $4.5 billion.
Convenience stores are expected to remain Realty Income’s largest industry and the percentage of Realty Income’s contractual rent generated from industrial properties is expected to increase from 13.1% to 15.1%, while their contractual rent from retail properties is expected to decrease from 82.5% to 79.9%.
O - IR
Realty Income has paid consistent and reliable monthly dividends throughout its 54-year operating history and is a S&P 500 Dividend Aristocrats member.
O has increased its dividend for 29 consecutive years at a compound annual growth rate of 4.4% and has increased its dividend 122 times since it was publicly listed in 1994.
Realty Income pays an annual dividend yield of 6.27% with monthly disbursements and their dividend is well covered with a 2022 year-end AFFO payout ratio of 75.69%.
On Oct. 10, Realty Income announced that its board of directors authorized the company’s 640 th consecutive monthly dividend at a monthly rate of $0.256 per share, representing an annual dividend of $3.072 per share.
O - IR
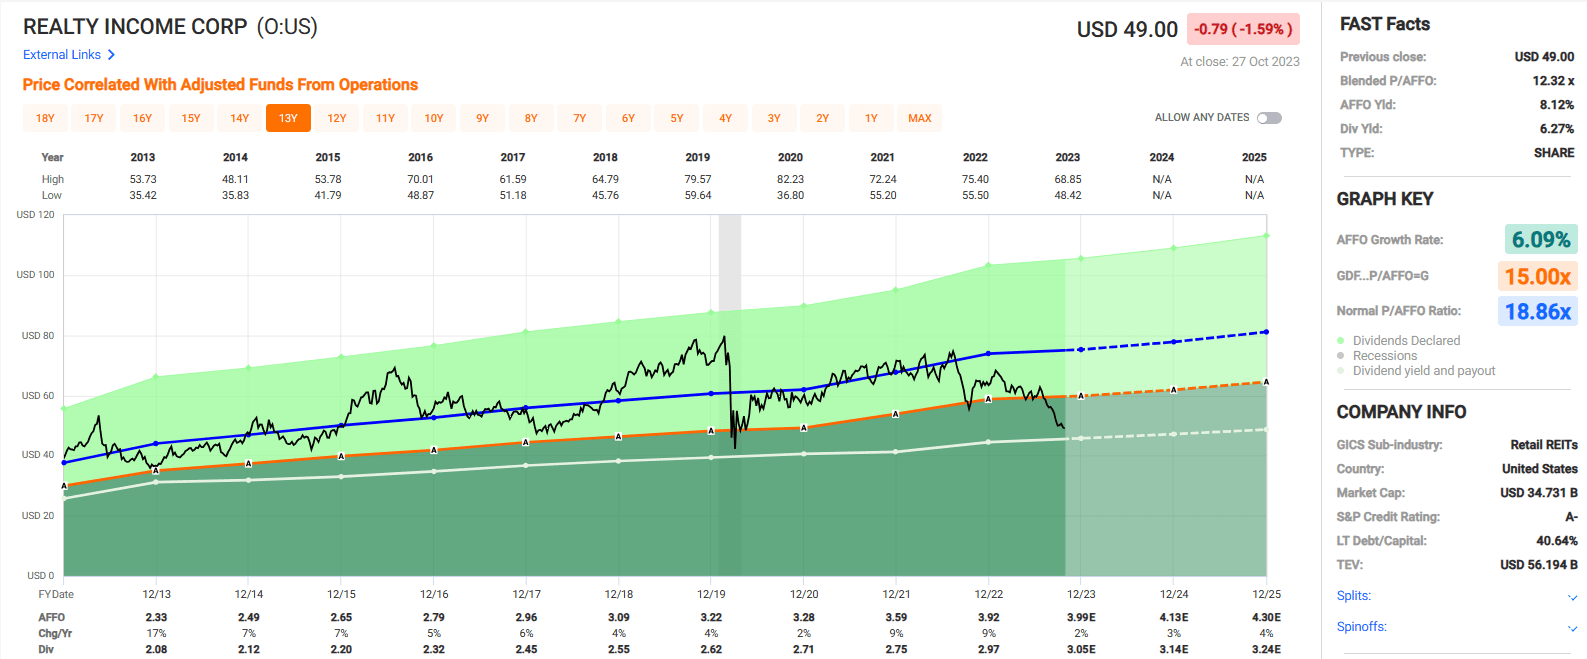
Over the last 10 years, Realty Income has delivered an average AFFO growth rate of 6.09% and an average dividend growth rate of 5.76%.
The stock currently is trading at a historically low valuation with a current P/AFFO of 12.32x, compared to 13.06x during the COVID crash and compared to their 10-year average AFFO multiple of 18.86x.
We rate Realty Income a Strong Buy.
FAST Graphs
Agree Realty ( ADC )
Agree Realty is a REIT that specializes in commercial properties that are net-leased to industry leading retail tenants.
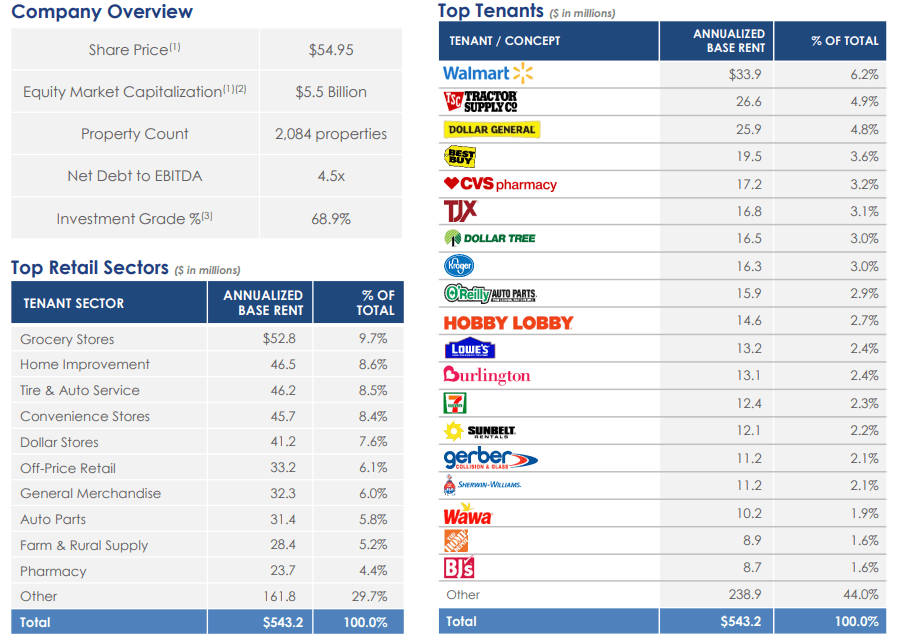
ADC’s portfolio consists of almost 2,100 properties covering roughly 43.2 million square feet of gross leasable space with properties spread across 49 states within the U.S.
ADC has a high-quality tenant base and receives 68.9% of their annualized base rents (“ABR”) from retail tenants that are investment grade.
Their top 3 tenants are Walmart, which makes up 6.2% of their annualized base rent, followed by Tractor Supply and Dollar General, which make up 4.9% and 4.8% of their ABR, respectively.
Other notable tenants listed in their top 20 include Kroger, CVS Pharmacy, Lowe’s, Sherwin-Williams, and Home Depot. In total, ADC’s top 20 tenants make up approximately 66% of their ABR.
As of their most recent update, ADC’s portfolio of net-leased retail properties was 99.7% leased with a weighted average remaining lease term of roughly 8.6 years.
ADC - IR
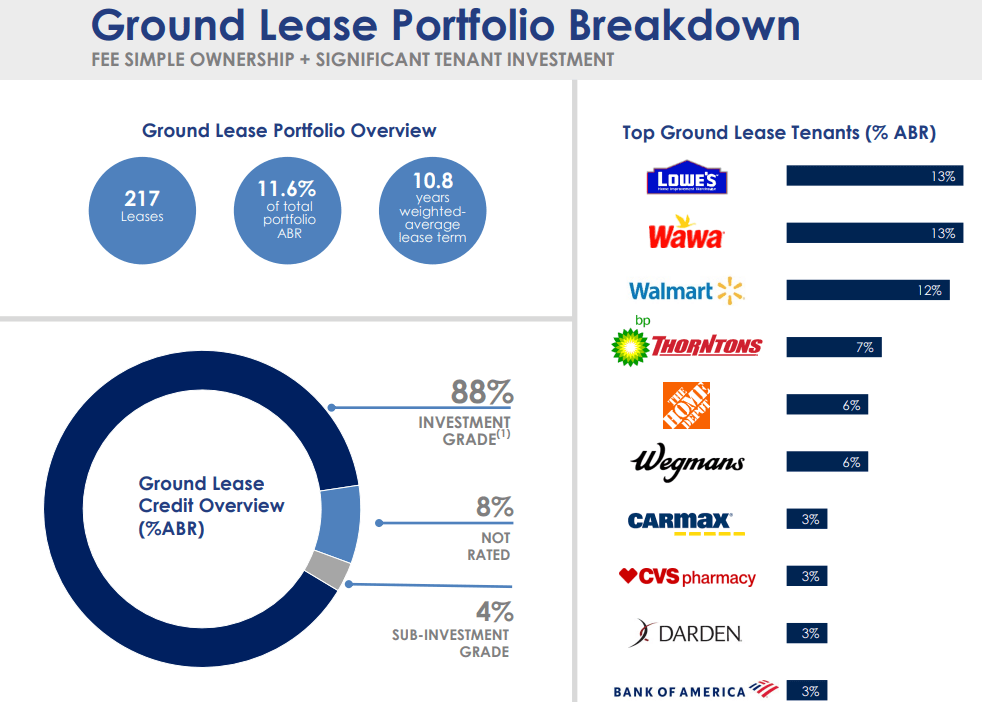
In addition to their portfolio of net-leased retail properties, ADC has a ground lease portfolio which consists of 217 ground leases located in 34 states which covers roughly 5.9 million feet of gross leasable space and makes up approximately 11.6% of ADC’s annualized base rents.
Their top three ground lease tenants include Lowe’s which makes up 13% of their ground lease ABR, followed by Wawa and Walmart which contribute 13% and 12% respectively to their ground lease ABR.
As of their most recent update, ADC’s ground lease portfolio was completely occupied with a weighted average remaining lease term of roughly 10.8 years.
Additionally, approximately 87.6% of their ground lease ABR is generated from investment grade retail tenants.
ADC - IR
On Oct. 24 Agree Realty released their third quarter operating results and reported total revenues during the quarter of $136.8 million, compared to $110.1 million in the third quarter of 2022.
Core FFO was reported at $96.4 million, or $0.99 per share, compared to Core FFO of $78.2 million, or $0.97 per share for the same period in 2022.
AFFO during the third quarter came in at $97.6 million, or $1.00 per share, compared to AFFO of $77.6 million, or $0.96 per share during the third quarter of 2022.
The change in AFFO represents a year-over-year increase of 4.2% on a per share basis.
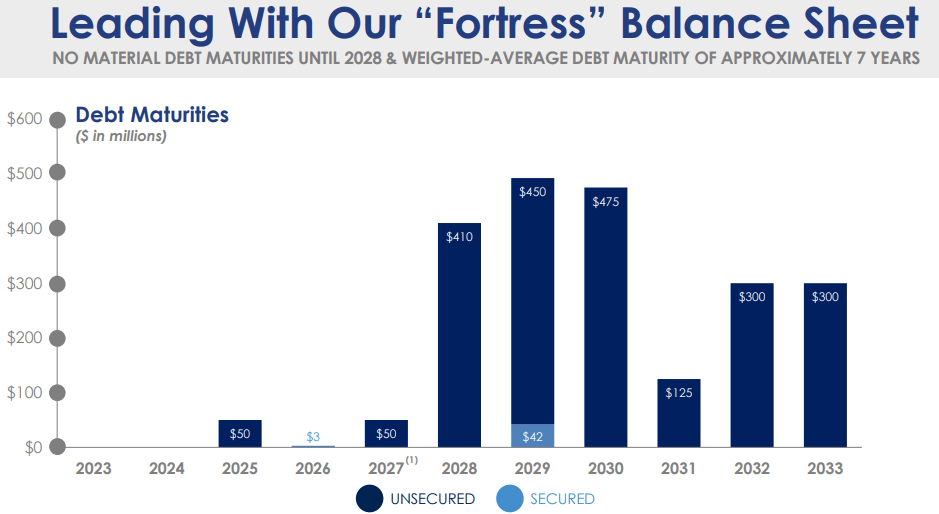
At the end of the third quarter, ADC had $957.4 million in total liquidity and strong debt metrics including a net debt to recurring EBITDA of 4.5x and a fixed charge coverage ratio of 5.1x.
Additionally, they have no significant debt maturities until 2028 and a weighted average term to maturity of approximately seven years.
ADC - IR
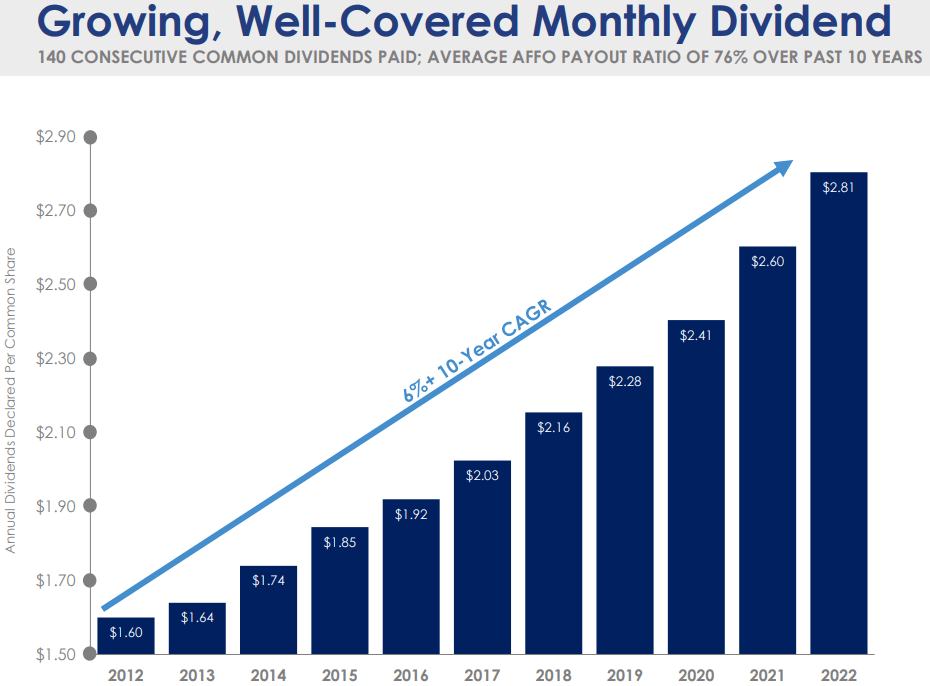
ADC pays a monthly dividend and has delivered a compound annual growth rate of approximately 6% over the past decade.
On Oct. 12 ADC announced that its board of directors authorized a monthly dividend of $0.247, which represents an annualized dividend of $2.964 per share and a 2.9% increase over the annualized dividend from the fourth quarter of the previous year.
ADC - IR
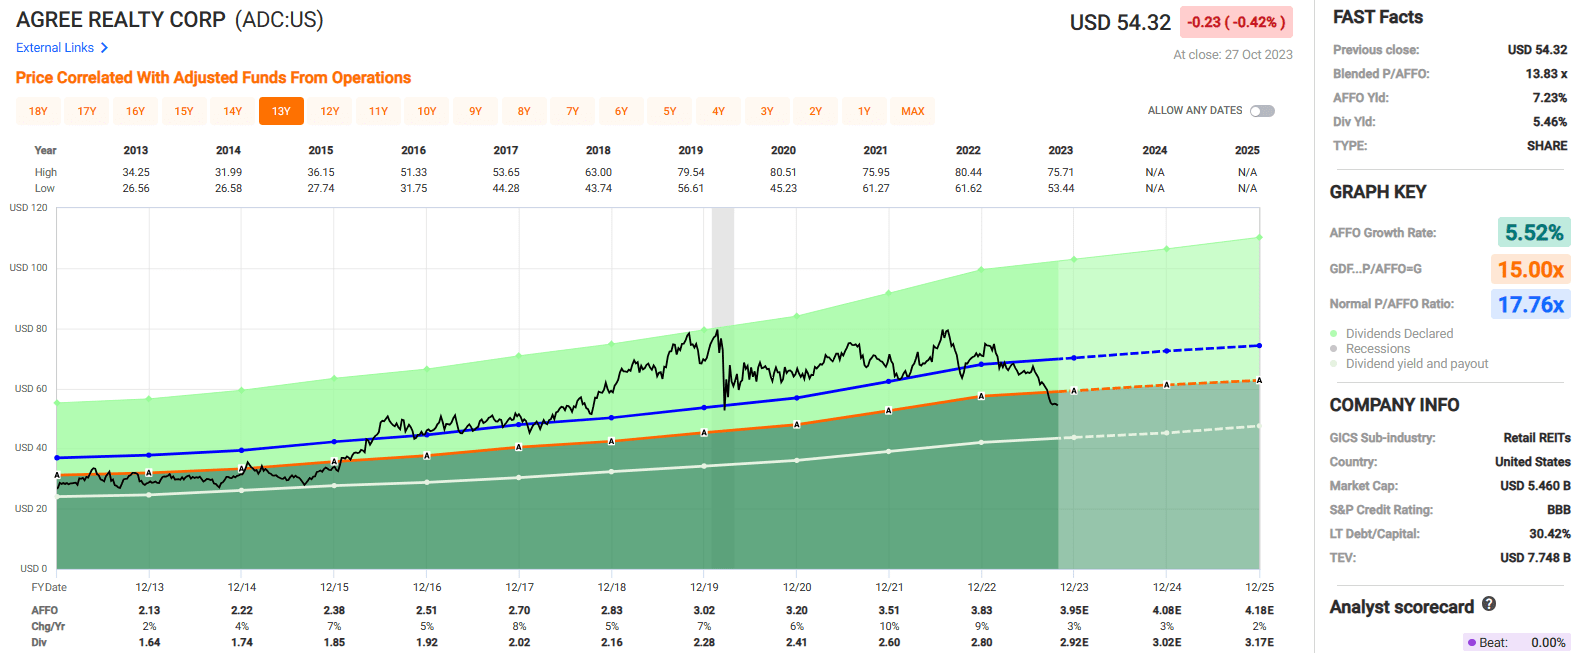
Agree Realty pays a 5.46% dividend yield that's well covered by earnings with a 2022 year-end AFFO payout ratio of 73.24%. The stock is currently trading at a P/AFFO of 13.83x compared to their 10-year average AFFO multiple of 17.76x.
We rate Agree Realty a Strong Buy.
FAST Graphs
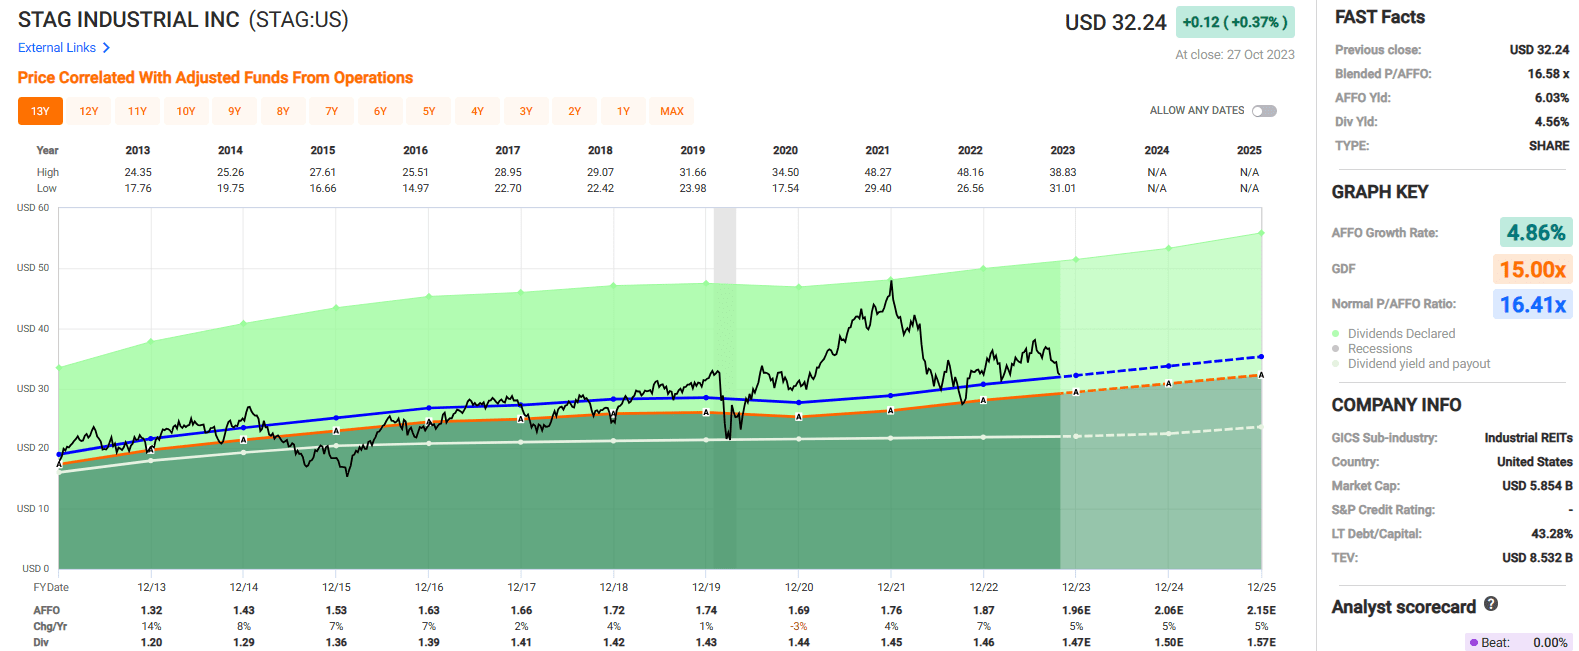
STAG Industrial ( STAG )
STAG is an industrial REIT that owns a portfolio consisting primarily of single-tenant industrial properties located across multiple markets within the United States.
Unlike many other institutional buyers that tend to target industrial properties in gateway or primary markets, STAG targets single-tenant industrial properties across many markets, including fragmented middle markets where their typical competitors are local investors that do not have the institutional platform and same access to equity or debt capital as STAG.
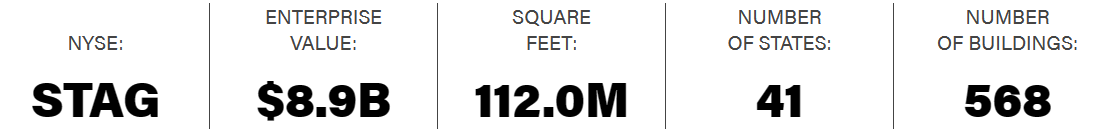
As of the end of the third quarter, STAG owned 568 industrial properties covering roughly 112.0 million rentable square feet across 41 states within the U.S and had a portfolio occupancy rate of 97.6% with a weighted average remaining lease term of 4.5 years.
STAG - IR
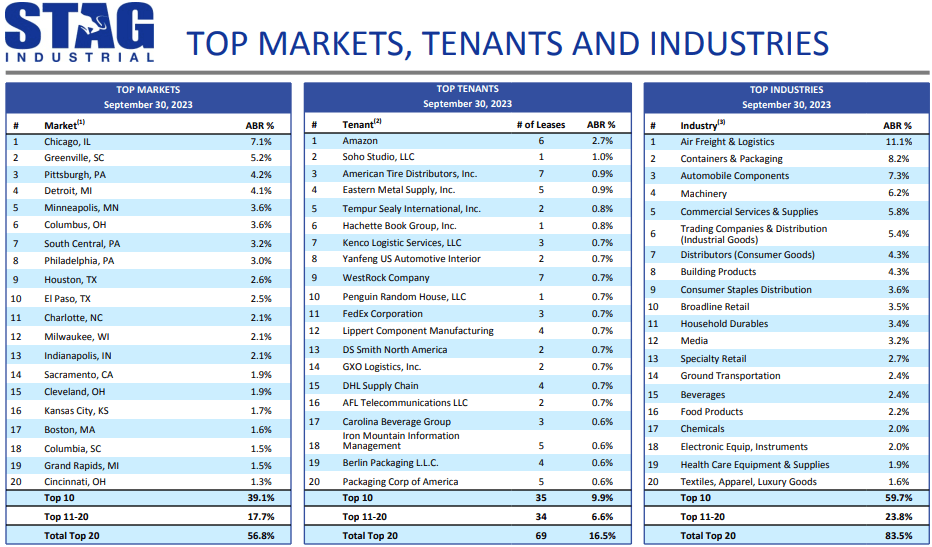
STAG’s largest market is Chicago which contributes 7.1% of ABR, followed by Greenville and Pittsburgh which contribute 5.2% and 4.2%, respectively.
The REIT is well diversified by tenant with its largest tenant, Amazon, only making up 2.7% of its ABR and its top 10 tenants combined only making up 9.9% of their ABR.
By industry, STAG’s largest category is Air Freight & Logistics which makes up 11.1% of their ABR, followed by Containers & Packaging and Automobile Components which make up 8.2% and 7.3% of their ABR respectively.
STAG - IR
On Oct. 26, 2023, STAG released third quarter operating results and reported total revenues during the third quarter of $179.3 million vs. $166.3 million in the third quarter of 2022.
Same-store cash net operating income (“NOI”) came in at $125.9 million during 3Q-23, compared to $119.5 million in 3Q-22, representing a 5.3% increase.
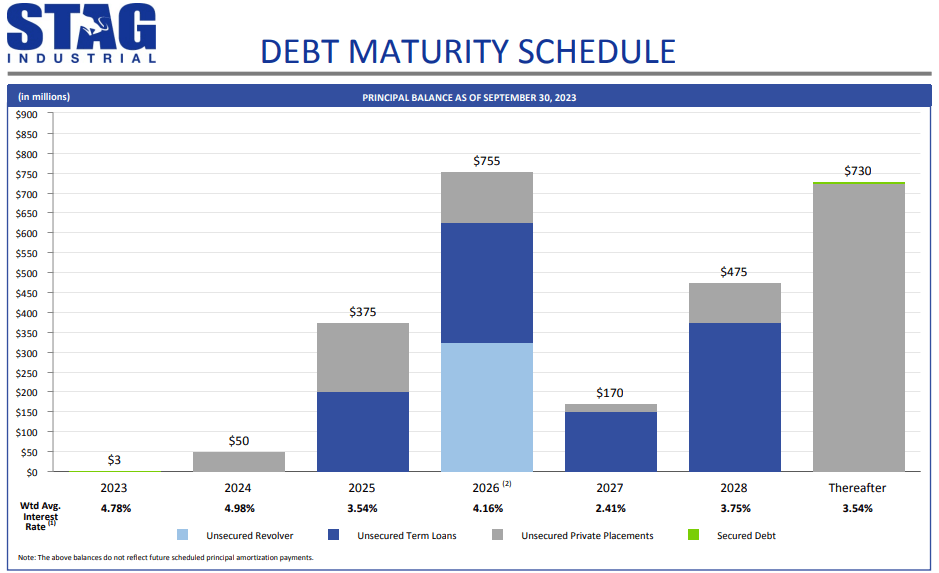
Core FFO during the quarter was reported at $108.8 million, or $0.59 per share, compared to $103.3 million, or $0.57 per share for the same period in 2022, representing an increase of 3.5% on a per share basis. At the end of the third quarter, STAG had a net debt to annualized run rate adjusted EBITDAre of 4.9x, no significant debt maturities until October 2024, and $682.6 million of total liquidity.
STAG - IR
STAG pays monthly dividends and currently offers an annual yield of 4.56% that's well covered with a 2022 year-end AFFO payout ratio of 78.08%.
The dividend has been increased each year since 2013 and has an average growth rate of 3.22% over the past 10 years. STAG is currently trading at a P/AFFO of 16.58x, which is in line with their 10-year average AFFO multiple of 16.41x.
We rate STAG Industrial a Buy.
FAST Graphs
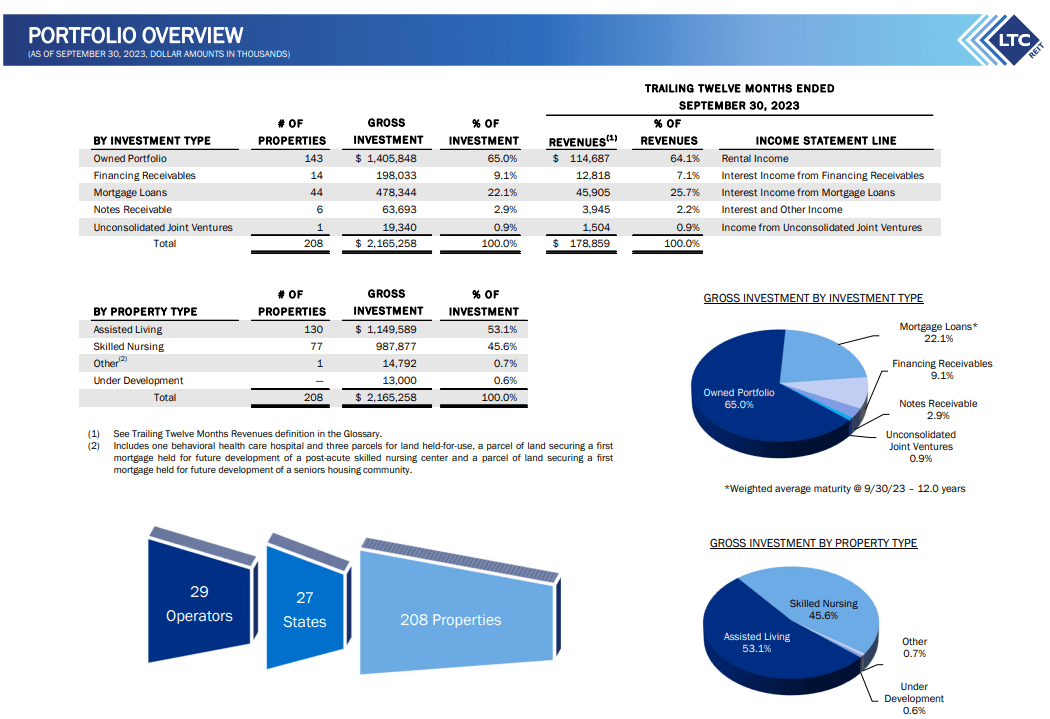
LTC Properties ( LTC )
LTC Properties is a healthcare REIT that primarily invests in senior housing and skilled nursing properties through sale-leasebacks, joint ventures, mortgage financing, and structured finance products such as mezzanine lending and preferred equity.
At the end of the third quarter, LTC owned or had an interest in 208 healthcare properties located in 27 states that were managed by 29 operating partners.
The majority of LTC’s revenue comes from its owned portfolio, which consists of 143 owned properties and contributed 64.1% of their revenues through rental income, followed by mortgage loans which contributed 25.7% of their revenues through interest income as of Sept. 30, 2023.
In addition to their owned portfolio and mortgage loans, LTC derives 7.1% of revenue from interest income on financing receivables, 2.2% of their revenue from interest income on notes receivables, and 0.9% of their revenue is generated through their unconsolidated joint ventures.
LTC - IR
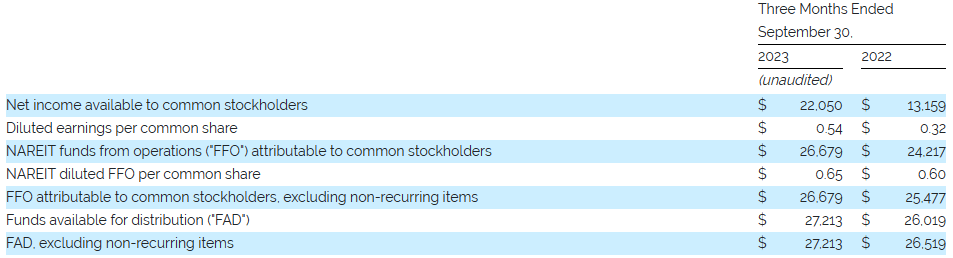
On Oct. 26 LTC released its third quarter operating results and reported total revenues during the third quarter of $49.3 million, compared to $43.5 million in the third quarter of 2022.
Year-over-year, LTC’s quarterly rental income remained relatively flat, but they saw a significant increase in their interest income from financing receivables and a moderate increase in their interest income from mortgage loans.
FFO during the third quarter was reported at $26.7 million, or $0.65 per share, compared to $24.2 million, or $0.60 per share during the same period in 2022.
LTC - IR
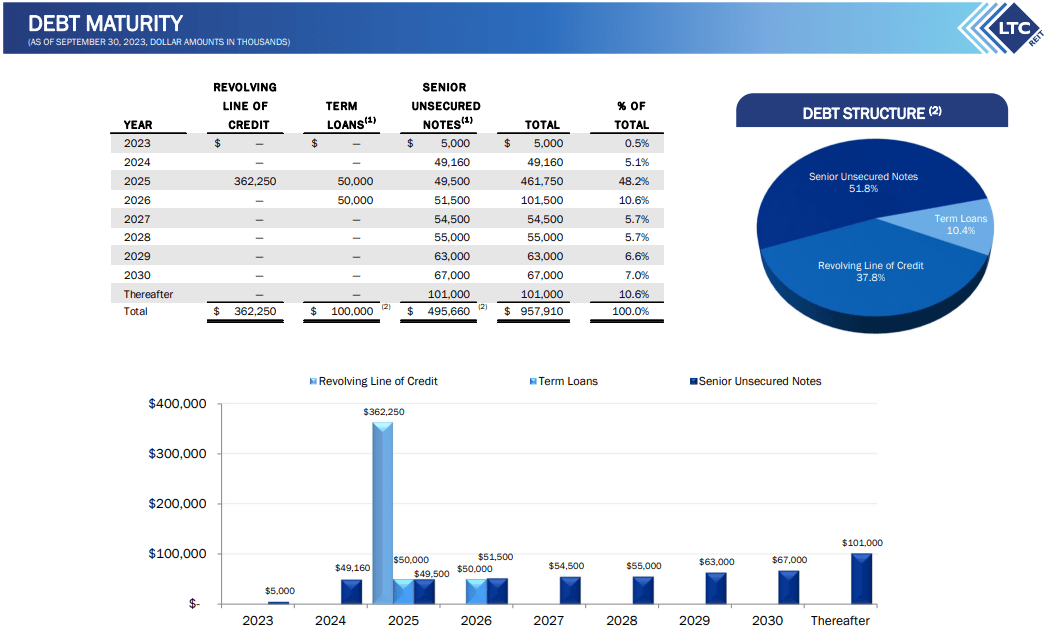
LTC Properties doesn’t have an assigned credit rating from S&P or Moody’s but they are investment-grade rated through the National Insurance Company rating agency.
They have solid debt metrics including a debt to adjusted EBITDAre of 6.0x, an adjusted EBITDAre to fixed charges ratio of 3.2x, a debt to gross asset value of 42.1%, and a weighted average interest rate of 5.0% on their outstanding debt.
Less than 1% of the debt matures in 2023 and only 5.1% matures in 2024, however they have several large debt maturities in 2025 which represents 48.2% of their total debt.
LTC - IR
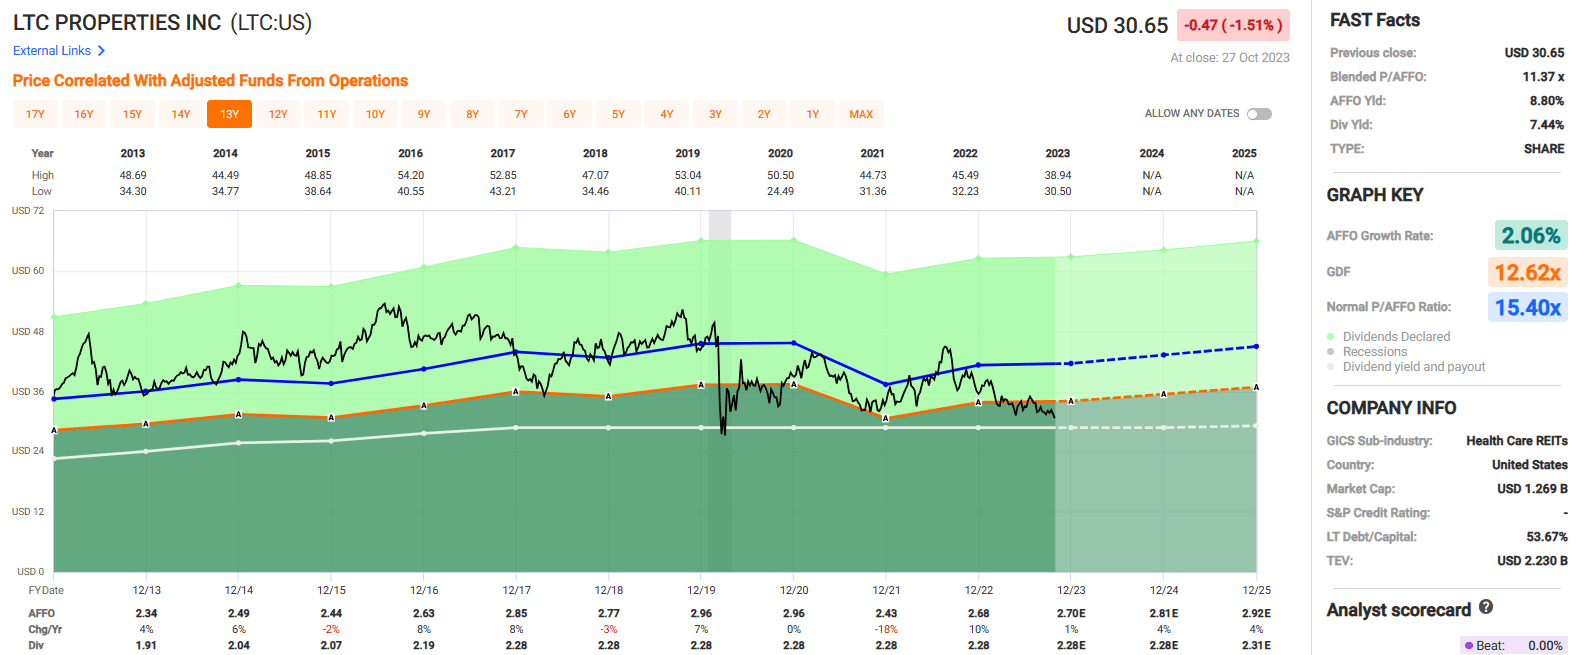
Going back to 2008, LTC has increased or maintained its monthly dividend with no cuts during the Great Recession or during the covid pandemic of 2020.
While their monthly dividend payouts have been reliable, LTC’s dividend has not been increased since 2017 when the dividend was raised by 4.11%.
Since that time it has been maintained at $0.19 per share on a monthly basis, representing an annualized dividend rate of $2.28 per share. So while LTC pays a high dividend yield of 7.44% that is reasonably covered by their AFFO (~85% AFFO payout ratio), they have a modest dividend growth rate with an average dividend growth rate of 2.87% over the last 15 years.
Currently LTC properties is trading at a P/AFFO of 11.37x, which is a discount compared to their 10-year average AFFO multiple of 15.40x. Similarly, LTC is paying a dividend yield of 7.44%, compared to their 5-year average dividend yield of 6.29% and their 10-year average dividend yield of 6.05%.
We rate LTC Properties a Buy.
FAST Graphs
Whitestone REIT ( WSR )
Whitestone is a Sunbelt focused shopping center REIT that develops, acquires, and owns open-air retail shopping centers which are primarily located in Phoenix, Houston, Dallas-Fort Worth, San Antonio, and Austin.
As a percentage of their net operating income (“NOI”), WSR’s largest market is Phoenix which makes up 42% of their NOI, followed by Houston which makes up 25%, Dallas-Fort Worth which makes up 18%, and Austin & San Antonio which together make up 15% of their NOI.
Whitestone targets tenants in service-oriented industries that includes restaurants, grocery stores, health & fitness centers, medical & dental, and financial & educational centers.
WSR’s largest industry is Restaurants & Food Service which makes up approximately 25% of their ABR, followed by Salons and Grocery which makes up 9% and 8% of their ABR respectively.
As of June 30, 2023, WSR’s portfolio consisted of 56 wholly owned properties covering approximately 5.0 million square feet of gross leasable area (“GLA”) with 29 properties located in Texas, 26 properties located in Arizona, and 1 property located in Illinois.
As of the end of the second quarter, WSR’s properties were leased to 1,466 tenants and their wholly owned properties had an occupancy rate of 93.3%.
WSR - IR
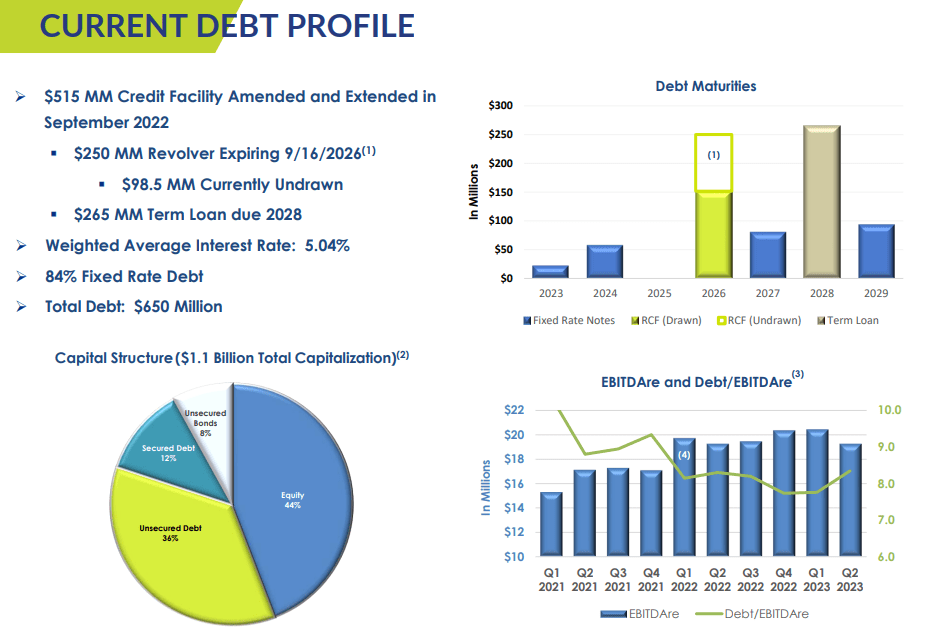
WSR has reasonable debt metrics, but I would like to see the company reduce its leverage over the next several years.
Currently, Whitestone REIT has a debt to pro forma EBITDAre of 8.3x, an EBITDA to interest expense ratio of 2.48x, and a long-term debt to capital ratio of 60.03%. WSR’s debt is 84% fixed rate with a weighted average interest rate of 5.04% and the company had $98.5 million of availability under their $250.0 million revolving credit facility as of their most recent update.
WSR - IR
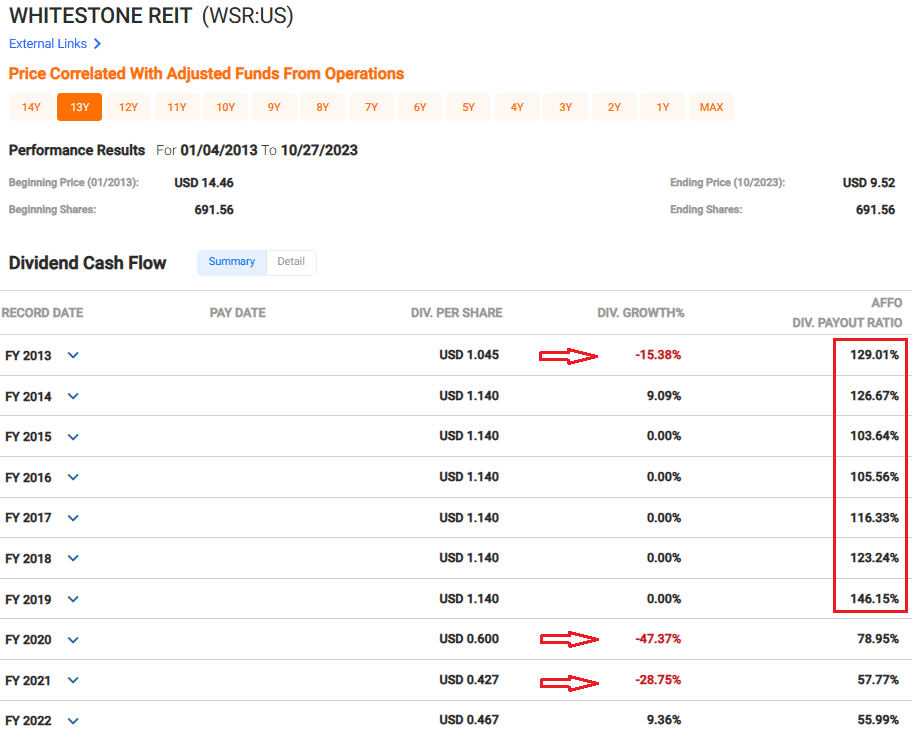
WSR has consistently paid a monthly dividend for over 15 years, but their dividend track record is not as strong as the other monthly payers we have looked at so far.
From 2013 to 2019 WSR’s AFFO dividend payout ratio exceeded 100%, showing that the REIT paid out more in dividends than the cash flow it generated over that period.
WSR’s AFFO payout ratio improved to 78.95% in 2020, and to 57.77% in 2021, but that was due to the -47.37% dividend cut it made in 2020 and then the -28.75% dividend cut it made in 2021.
FAST Graphs
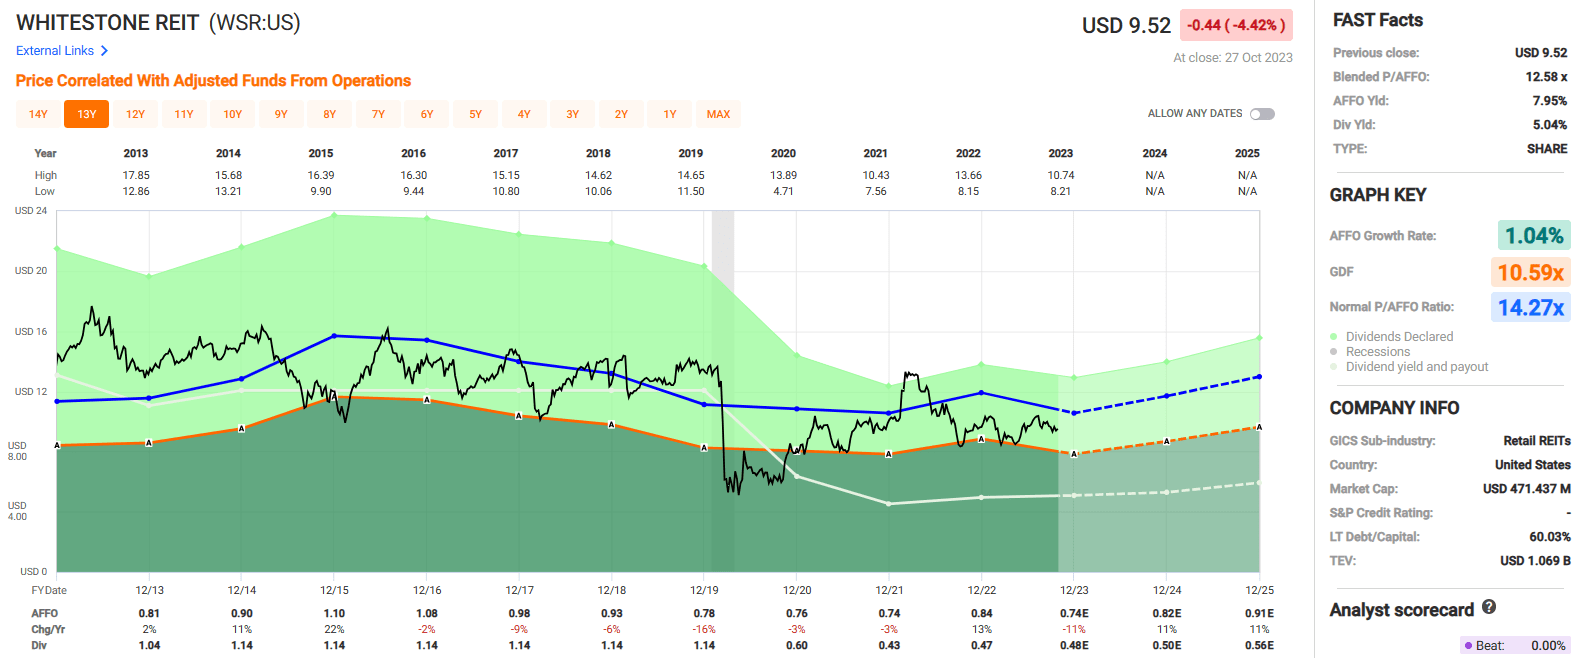
Whitestone REIT pays a 5.04% dividend yield that is well covered with an expected 2023 AFFO payout ratio of approximately 65%.
While WSR has had trouble with its dividend in the past, we believe its current dividend is secure as WSR currently has a low AFFO payout ratio and analysts expect for AFFO per share to increase by 11% in both 2024 and 2025.
The stock currently trades at a P/AFFO of 12.58x, which compares favorably to their 10-year average AFFO multiple of 14.27x and has a P/NAV of 0.90x, which implies the stock is trading at a 10% discount to its net asset value.
We rate Whitestone REIT a Spec Buy.
FAST Graphs
In Closing
Here's a recap of the four monthly paying picks:
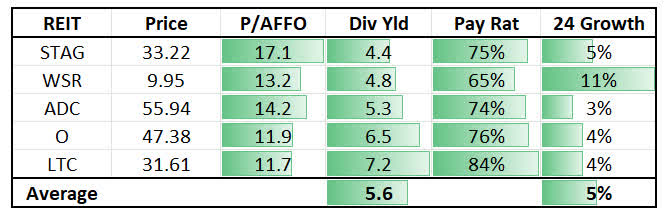
iREIT®
I hope you enjoyed our monthly mailbox magic report and I look forward to your comments or questions below.
Note: Brad Thomas is a Wall Street writer, which means he's not always right with his predictions or recommendations. Since that also applies to his grammar, please excuse any typos you may find. Also, this article is free: Written and distributed only to assist in research while providing a forum for second-level thinking.
For further details see:
Monthly Dividend Magic: The REIT Royal Flush