VEGI - MOO: Not My Preferred Way To Play Agriculture
2023-11-01 02:29:27 ET
Summary
- VanEck Agribusiness ETF provides investors with exposure to agribusiness sector.
- MOO has a long history of underperforming the S&P 500.
- The agribusiness is generally challenging due to high levels of competition.
- Investors who want long exposure to the agribusiness should consider Deere & Co as an alternative to MOO.
ETF Overview
The VanEck Agribusiness ETF ( MOO ) seeks to replicate the price and yield performance of the MVIS Global Agribusiness Index, which is intended to track the overall performance of companies involved in agri-chemicals, animal health and fertilizers, seeds and traits, from farm/irrigation equipment and farm machinery, aquaculture and fishing, livestock, cultivation and plantations, and trading of agriculture products.
MOO currently has net assets of ~$906 million and charges a net expense ratio of 0.53%. The fund currently holds 60 different securities, trades at a trailing P/E ratio of 12.4x, and offers a dividend yield of 2.56%.
High Management Fee
MOO has a relatively high net expense ratio of 0.53% for a passive product. To put that into context, the average equity ETF expense ratio is ~0.16%. Comparably, a similar ETF, the iShares MSCI Agriculture Producers ETF ( VEGI ) charges an expense ratio of 0.39%. As an investor, I work diligently to avoid high management fees (active or passive) as I believe they are often an overlooked headwind when investing.
MOO's fee of 0.53% strikes me as particularly high given the fact that investors are not getting any active management but rather passive index replication. Moreover, the fund is fairly concentrated with the top 5 holdings making up ~35% of the total fund.
Weak Relative Historical Performance
MOO launched in August 2007 and has significantly underperformed the S&P 500 thus far. Since inception, MOO has delivered a total return of ~125% compared to a ~282% return generated by the S&P 500.
On a more recent basis, MOO performance has continued to struggle on a relative basis. Over the past 3 years, MOO has delivered a total return of ~12% compared to a total return of ~30% for the S&P 500 during the same time. What makes this performance especially disappointing is the fact that the past three years have been a relatively strong environment for agriculture commodities as evidenced by the ~52% total return delivered by the Invesco DB Agriculture Fund ( DBA ) over the past three years. DBA differs from MOO in that it is focused on owning futures on agriculture products such as sugar, cocoa, live cattle, and other products while MOO holds shares in companies with exposure to the agriculture business.
Holdings Analysis
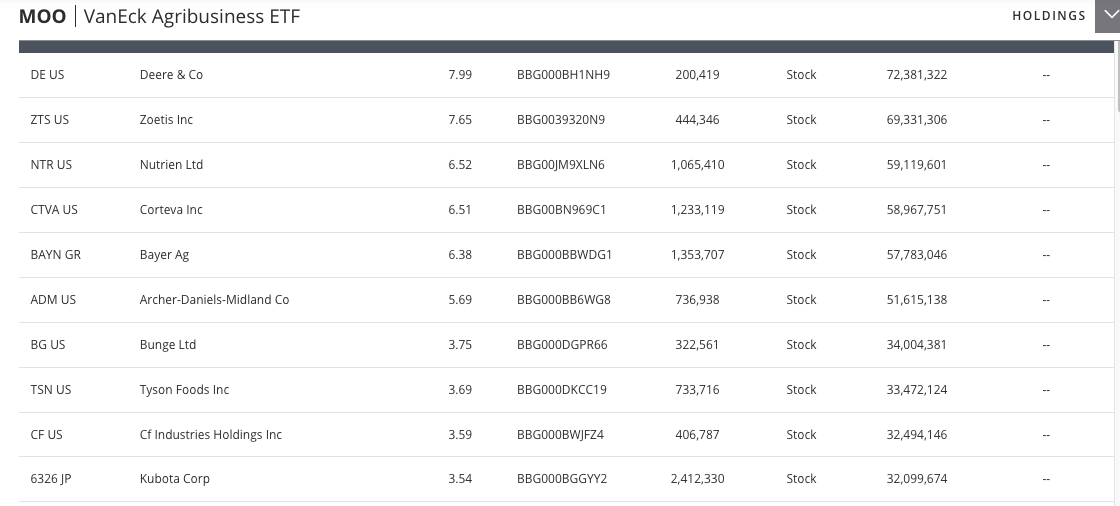
As shown by the table below, MOO is somewhat concentrated with the top 5 holdings accounting for ~35% and top 10 holdings accounting for ~55% of the fund as of October 27,2023 .
One important thing to note with MOO is that the fund is not necessarily a pure play on the agribusiness as a number of large holdings also have significant other businesses. For example, Bayer AG ( OTCPK:BAYRY ), which is the fifth largest holding in MOO with a weight of ~6.4%, has a significant consumer health business and the agriculture business makes up only ~50% of revenue. Zoetis ( ZTS ), which is the second largest holding in MOO with a ~7.5% weight, derives 64% of its revenue from companion animal products and just 35% of revenue from livestock products.
Generally speaking, my view is that ETFs earn their fees when they offer investors an efficient way to do something they cannot easily do on their own. It would not be difficult for investors to simply replicate the 60 holdings and weights for MOO and avoid paying the 0.53% in annual fees. Investors who do not want to bother with 60 holdings could just scale up the weights of the top 5 holdings and still get reasonably well-diversified exposure to the same risk factors. Moreover, individual investors have the ability to actively manage their tax position with stocks to a better degree than is the case with ETFs.
Highly Competitive Industry
Commodity industries tend to be highly competitive as it is difficult for companies to offer differentiated products. Thus, generally speaking agriculture companies tend to enjoy low profit margins and tend to experience high earnings volatility based on the economic environment. For this reason, it is not surprising to me that MOO has underperformed the S&P 500 over the long-term.
It is interesting to note that indirect agricultures businesses such as Deere & Co ( DE ) and Zoetis tend to have higher profit margins than more traditional agriculture business.
High Dispersion of Underlying Holdings
As shown by the chart below, MOO's top holdings have exhibited a wide range of performance. Over the past three years, the best performed of the top five MOO holdings, DE, has returned ~64%. The worst performer of the top five MOO holdings, ZTS has returned ~-1%.
Given the high dispersion of the underlying holdings of MOO, I think it is worthwhile for investors to evaluate which stock or group of stocks from the index are worth owning vs simply buying MOO.
My Preferred Alternative to MOO
While I am generally not bullish on the agriculture business due to the significant amount of competition and inability of companies to earn above market return over long periods of time, there is one name that stands out above the rest: Deere & Co.
As shown below, both Seeking Alpha and Wall Street analysts current rate DE as a buy. In addition to that, as shown by the charts below, DE has a very strong history of generating shareholder returns well in excess of the S&P 500. Moreover, DE has also significantly outperformed the S&P 500 over the past 3 years.
DE trades at just 10.5x trailing earnings compared to 12.4x for MOO. I find this valuation highly attractive on a relative basis given DE's strong history of outperformance.
Seeking Alpha Seeking Alpha
Conclusion
MOO represents a relatively unique ETF as it is one of the only ETFs to focus on the agribusiness. However, MOO charges a fairly high management fee for a passive product. MOO has a long history of relative underperformance compared to the S&P 500 and has even underperformed over the past 3 years despite rising agriculture commodity prices.
While the trailing P/E ratio of just 12.5x seems cheap on the surface, I am not attracted to the agribusiness sector due to the high degree of competition and high degree of cyclicality.
Investors who want to consider expressing a bullish trade in the agribusiness space may want to consider DE as a viable alternative to MOO given DE's strong long-term performance history along with bullish ratings from both the Seeking Alpha and Wall Street analysts.
For further details see:
MOO: Not My Preferred Way To Play Agriculture