MCO - Moody's: Resilient Analytics Business With Close To 100% Recurring Revenue
2023-04-26 16:51:55 ET
Summary
- Moody's is most commonly known as one of the two market leaders in credit ratings, together with S&P Global Inc.
- The overlooked Analytics business is Moody's crown jewel, with close to 100% recurring revenue and strong retention rates.
- When global issuance activity recovers, Moody's operating margin should bounce back to pre-pandemic levels.
- Despite my DCF calculation indicating that Moody's is slightly overvalued at the current price of $306.77, I initiate coverage on Moody's with a "buy" rating.
Introduction
In this article, I want to start coverage of Moody's Corporation ( MCO ). Moody's is most widely known as one of the big three credit rating providers, the other two being S&P Global Inc. ( SPGI ) and Fitch.
Regarding the structure of this article, I will start with a brief company overview before diving into Moody's two business segments: Moody's Investor Services ((MIS)) and Moody's Analytics ((MA)). I will also address the recent turbulences in the rating market and go over the company's consolidated financials, especially the adjustments made by Moody's. After briefly addressing the recently reported results for the first quarter of FY2023, I will finish with a section on valuation, risks and my conclusion.
Company Overview
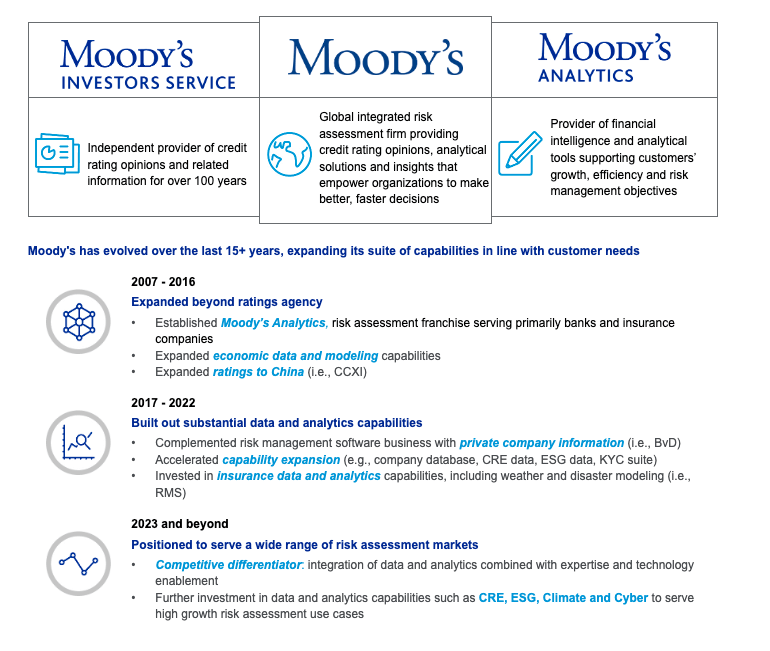
As I already stated in the Introduction, Moody's consists of the MIS and the MA segments. The overview from the company's recent 10-K filing describes the segments and Moody's evolution since 2007:
Company Overview (Moody's 10-K - Part I Item 1)
Moody's one-sentence description of their own business is:
Moody's is a global integrated risk assessment firm that empowers organizations and investors to make better decisions.
Source: Moody's 10-K
Moody's acts in an oligopoly with S&P Global and Fitch ratings in the credit rating market. It is widely estimated that Moody's and S&P Global make up around 80% of the global rating market (roughly 40% each), with Fitch coming in third place with around 15% market share. The remaining 5% market share belongs to other companies such as DBRS, a subsidiary of Morningstar Inc. ( MORN ). I will go over the rating market separately in the chapter dedicated to the Moody's Investor Services segment.
Moody's Analytics is described as follows:
Moody's Analytics ((MA)) is a global provider of: i) data and information; ii) research and insights; and iii) decision solutions, which help customers navigate increasingly complex risks. MA leverages its industry expertise across multiple risks such as credit, market, financial crime, supply chain, catastrophe and climate to deliver integrated risk assessment solutions that enable business leaders to identify, measure and manage the implications of interrelated risks and opportunities.
Source: Moody's 10-K
MA is Moody's fastest-growing segment. The recurring revenue in the MA segment amounted to 94% of total MA revenue in FY2022. In my opinion, the major tailwind for the MA segment will be the importance of risk assessment capabilities in the face of climate change. With the increasing frequency of major catastrophe events like forest fires, earthquakes and hurricanes, MA is well-positioned as a provider of tools and solutions to assess the risks of these events. I will come back to this in the dedicated MA chapter.
Moody's Investor Services
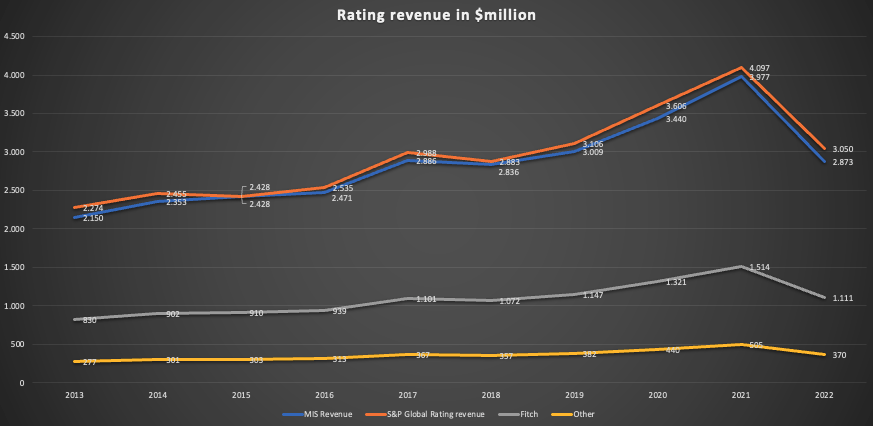
I want to start with a chart showing the total revenue of Moody's and S&P Global's rating segments over the past decade. I decided to add Fitch Ratings and other companies' rating revenue estimates, assuming a 15% market share for Fitch and a 5% market share for other rating providers:
Rating revenue overview since FY2013 (Moody's and S&P Global reports; Author estimates)
We can see that Moody's and S&P Global grew rating revenue nearly identically in line with the whole rating market.
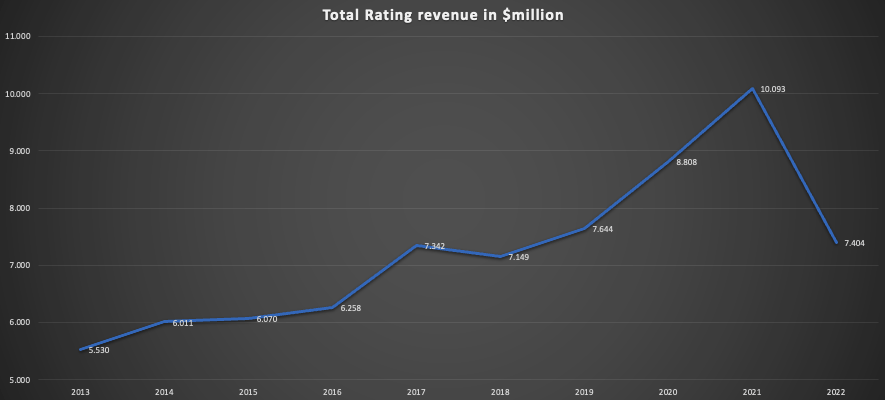
The next chart shows the total rating revenue for the past decade:
Total rating revenue since FY2013 (Moody's and S&P Global reports; Author estimates)
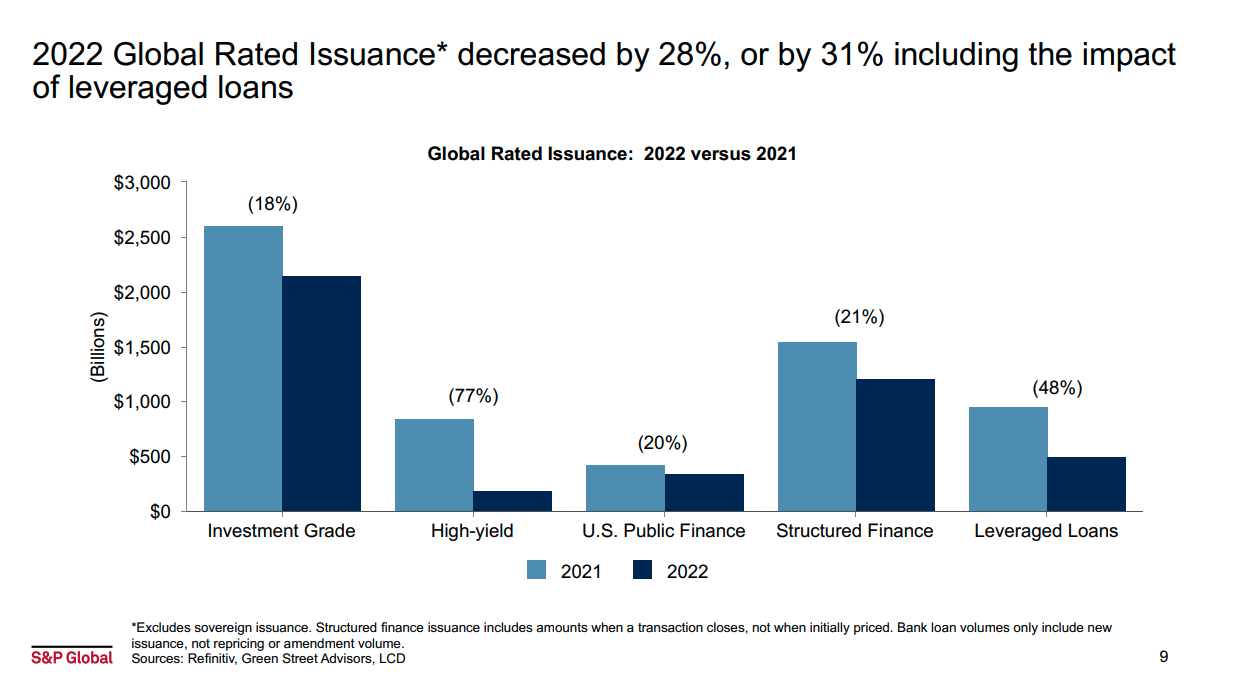
Total rating revenue increased every year except for 2018 (slight decline) and 2022 (steep decline). In light of the fastest rate-hike cycle we have seen in the past decades and rising energy prices due to the Russia-Ukraine conflict, the 2022 drop in rating revenue isn't surprising. High-yield Issuance for example dropped by 77% YoY in 2022, as can be seen in the slide below from S&P Global's 4th quarter FY2022 earnings presentation :
YoY Issuance (S&P Global 4th quarter FY2022 earnings presentation)
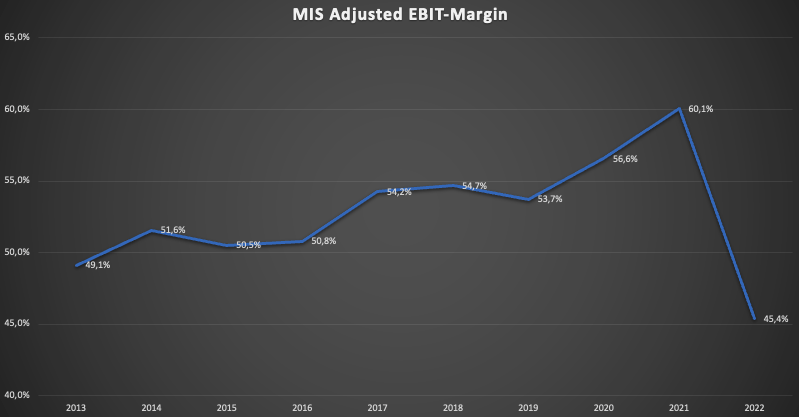
MIS FY2022 results were obviously hit very hard by this decline in issuances. The effect on the bottom line was even worse. While revenue declined by 31% from $3,812 to $2,699 (excluding Intersegment revenue with MA), adjusted operating profit declined by 46% from $2,289 to $1,225 ( Author Note: I use a different operating profit than the company is reporting and will go over this later in this article ). The chart below shows the MIS segment's adjusted operating profit margin (as by my adjusted operating profit definition) over the past decade:
MIS Adjusted EBIT-Margin since FY2013 (Moody's reports)
In the case of recovering issuances, MIS will likely be able to increase operating profit by a lot due to increased revenue and margin recovery.
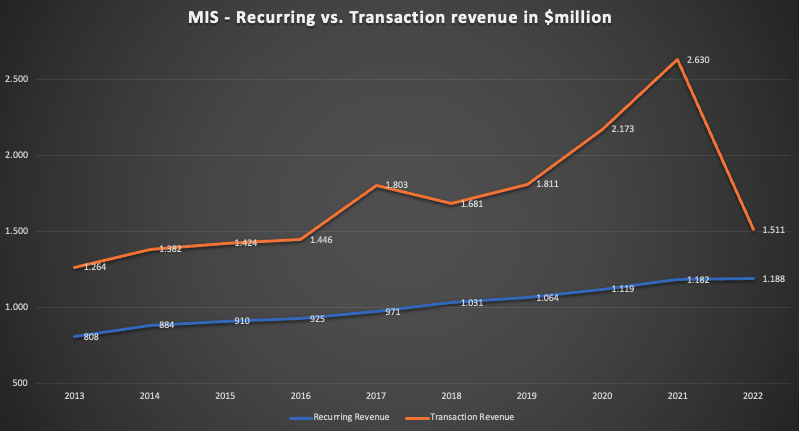
Another thing I noticed when looking at the MIS revenue profile over the past decade was that while transaction revenue increased a lot over the past decade and took a hit whenever total rating revenue declined (2018 and 2022), the recurring revenue portion of the segment increased at a decent CAGR of 4.37% with no decline, not even in FY2022. The chart below shows the development of recurring and transaction revenue for the MIS segment over the past decade:
MIS recurring vs. transaction revenue since FY2013 (Moody's reports)
This recurring revenue gives some downside protection in the case of further declining issuance numbers.
Now what can we do with all this information? The major takeaway, in my opinion, is that the huge decline in issuances in 2022, while resulting in a massive hit to MIS revenue and bottom line, leaves MIS in a position where it might be able to bounce back sharply over the next couple of years. In the last 4th quarter earnings presentation , Moody's estimated that for FY2023 MIS will grow revenue in the low-to-mid-single-digit percent range and expand adjusted operating margin by around 300 basis points. This should lead to overall adjusted operating profit growth in the low teens.
Might MIS be affected in the case of the looming recession everyone talks about for quite some time becoming a reality? Yes. Does this change the fact that the rating business has an incredibly high moat and companies still need to refinance outstanding debt? No. Will MIS be able to increase adjusted operating profit margins back to the mid-50s percent range? Most likely yes. What I am saying is that I can't predict the future and I don't know if a recession is coming, but I do know that all things pass eventually and the underlying rating business is incredibly profitable with a large moat. I think that the huge issuance drop in 2022 might have opened an opportunity to invest in Moody's despite the current seemingly high valuation multiples because these high valuation multiples are a temporary effect of the deteriorating issuance numbers.
Moody's Analytics
While MIS is the higher margin segment with a wide moat and the major contributor to consolidated profits, Moody's Analytics ((MA)) is the crown jewel of Moody's. This might seem odd because Moody's is most commonly known for their rating business.
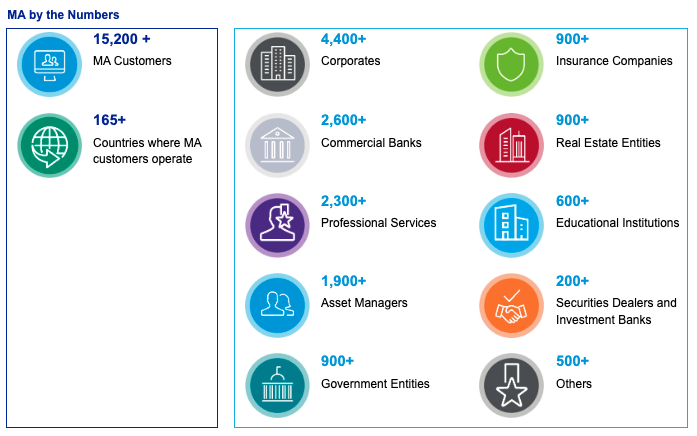
MA offers data, tools and solutions to help customers evaluate and manage all sorts of risks. Possible risks include natural disasters, cybersecurity, regulatory risks, reputational risks, or supply chain risks. The following snippet from the recent 10-K filing shows some numbers for MA:
Moody's Analytics by the Numbers (Moody's 10-K)
MA counted 15,200+ customers in 165+ countries in FY2022.
Now, where does MA have tailwinds? Think of cybersecurity. McKinsey estimates that the cybersecurity market might offer an opportunity of $1.5-2 trillion. This stands against the $150 billion spent globally in 2021. What is the first thing you should do when you start to think about spending on cybersecurity? You should evaluate the risk. This is where MA comes into play.
Another tailwind is climate change and the resulting increase in the number of disaster events. The United Nations estimates that the number of disaster events will reach 560 a year by 2030, up from between 350 and 500 per year over the past two decades. Major insurance companies, governments, corporations, asset managers, you name it. All of them will have to deal with the increasing risks of natural disasters caused by climate change. While this is a tragedy for the people involved, it is a major tailwind for the MA business.
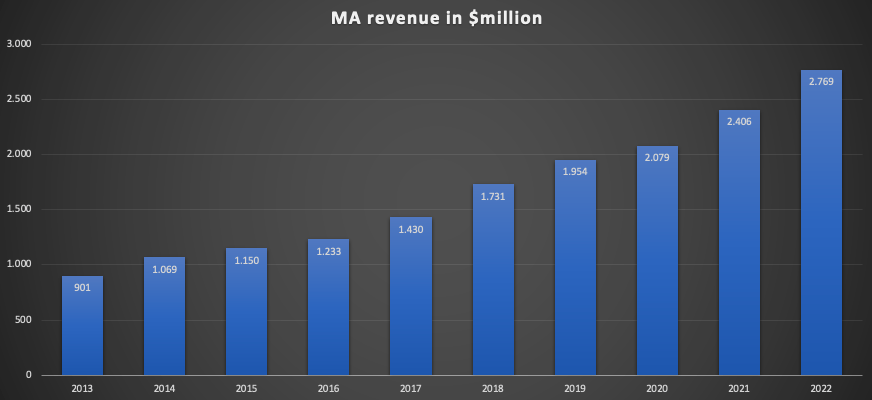
Now let's look at the numbers. I want to start with a simple chart showing MA revenue over the past decade:
MA revenue since 2013 (Moody's reports)
Since 2013, MA grew revenue with a CAGR of 13.3% without a single decline. While the rating business struggled in FY2022, MA has shown resilience.
The next chart shows the recurring revenue as % of total revenue:
MA recurring revenue % since 2013 (Moody's reports)
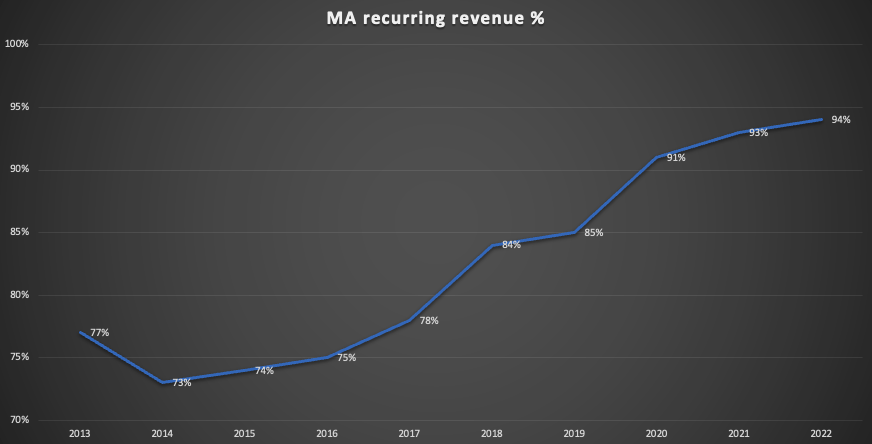
Recurring revenue as % of total revenue increased to 94% over the past decade. This undermines the resiliency of the MA business model.
The last chart shows MA adjusted EBIT margin over the past decade:
MA Adjusted EBIT-Margin since FY2013 (Moody's reports)
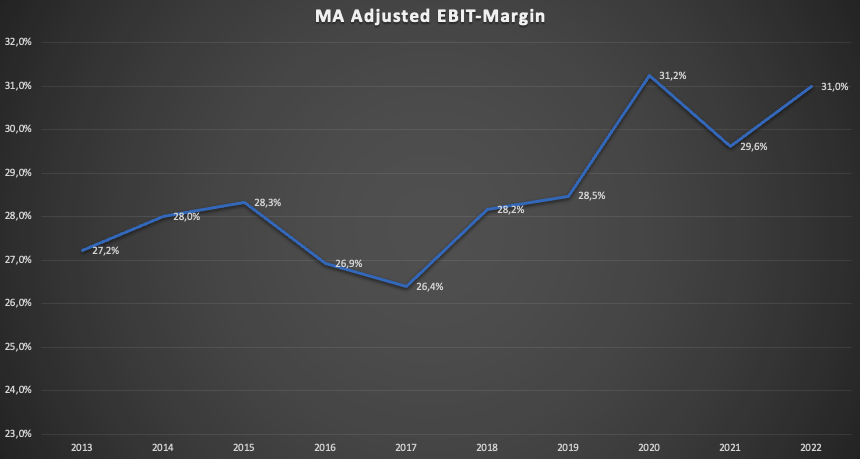
Just like MIS, MA was able to increase margins over the past decade. While revenue grew with a CAGR of 13.3%, adjusted EBIT grew with a CAGR of 14.9% over the past decade.
MA is a business with close to 100% recurring revenue in a growing market with several tailwinds while being able to use operating leverage to increase margins over time. Just by the sound of it, this sounds like the perfect business. Meanwhile, according to the following slide from a video on Moody's YouTube channel (06:20), retention rates seem to be in the mid-90 % range:
MA retention rate (Moody's Corporation YouTube: Moody's Moments Episode 4: Moody's Analytics)
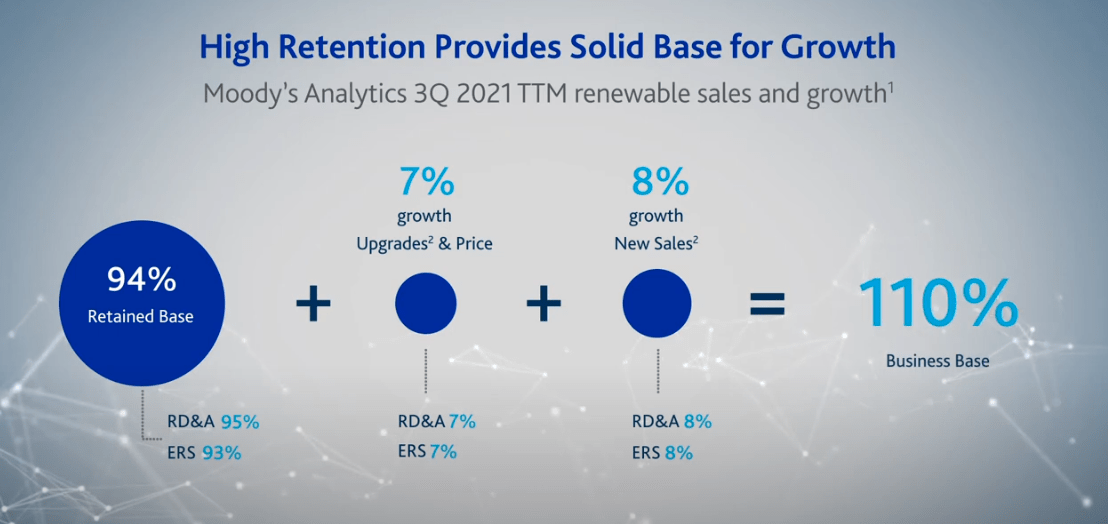
MA low-teens growth rates seem to be a result of high retention rates coupled with gaining new customers and pricing power. However I look at it, MA seems like an outstanding business.
Consolidated Financials and Adjustments
I want to turn to consolidated performance and Moody's reporting/accounting practices. I want to start with accounting and how Moody's adjusts the reported earnings. The snippet from the 4th quarter FY2022 earnings release below shows the reconciliation from GAAP to adjusted numbers:
Moody's Adjustments (Moody's 4th quarter FY2022 earnings release)
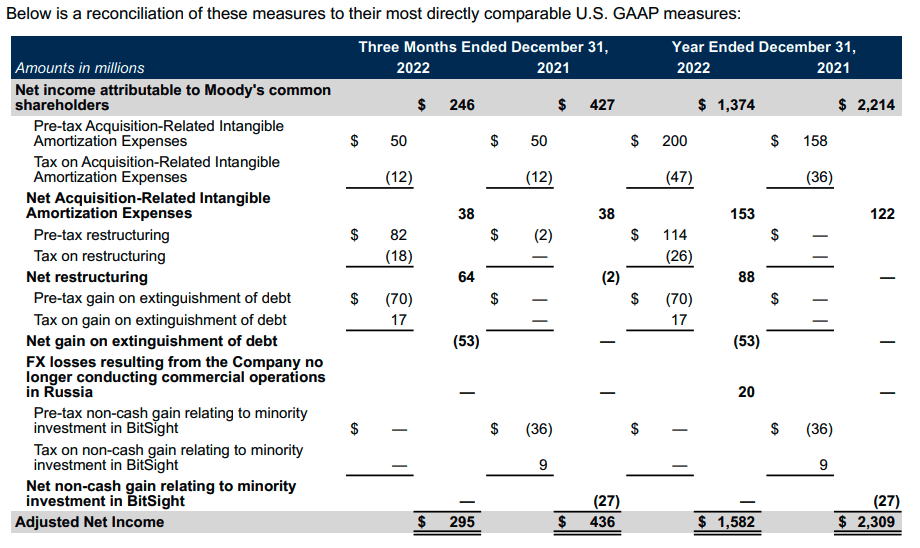
In FY2022, Moody's adjusted amortization of intangible assets, restructuring expenses and gains on extinguishment of debt. Besides that, Moody's periodically adjusts minor other effects that are not noteworthy. Adding back the amortization of intangible assets is the only adjustment I agree with. I tend to look closely at what adjustments management makes because, in my opinion, some unnecessary adjustments are a bad sign. In the case of Moody's, we have seen adjustments for restructuring in the years 2018, 2019, 2020 and 2022. What is the point of adjusting for restructuring expenses when they don't seem to be a one-time item? This seems misleading and like management is trying to make earnings look better than they are.
However, I conclude that I will only adjust for the amortization of intangible assets and a major settlement charge of $864 million for MIS in FY2016. Here is a chart with the resulting consolidated revenue and Adjusted EBIT over the past decade:
Consolidated revenue and adjusted EBIT since 2013 (Moody's reports)
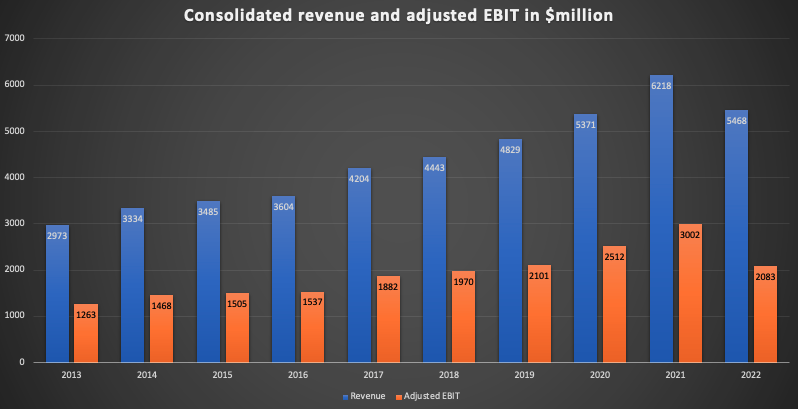
Revenue grew with a CAGR of 7% while adjusted EBIT grew with a CAGR of 5.7%. The low CAGR is a result of the FY2022 decline due to the decline in issuances described earlier. From FY2013 to FY2019 (pre-pandemic), revenue grew with a CAGR of 8.4% while adjusted EBIT grew with a CAGR of 8.9%.
The more interesting chart is the following:
Consolidated recurring vs. transactional revenue since 2013 (Moody's reports)
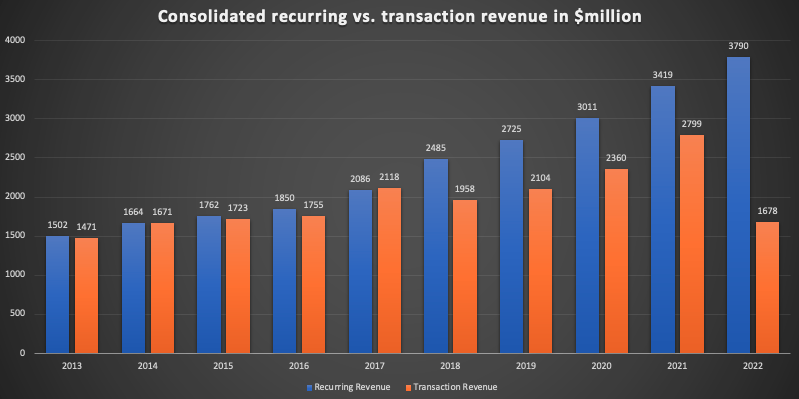
Consolidated recurring revenue grew every single year with a CAGR of 10.8% while transaction revenue (a) was a bit more cyclical and (b) grew much slower. So while overall revenue grew at high single digits, the higher quality revenue which is the recurring revenue grew with a low-teens percentage. A higher % of recurring revenue warrants a higher multiple, as can be seen in the following chart:
Moody's normalized earnings yield dropped significantly over the past decade. This is also a problem if one were to analyze Moody's and try to evaluate it on a historic multiple basis. Moody's can't be valued like it was in the past because the business has just gotten that much stronger and more resilient with the growing recurring revenue from MA.
Now let us look at consolidated margins:
Consolidated adjusted EBIT margin since 2013 (Moody's reports)
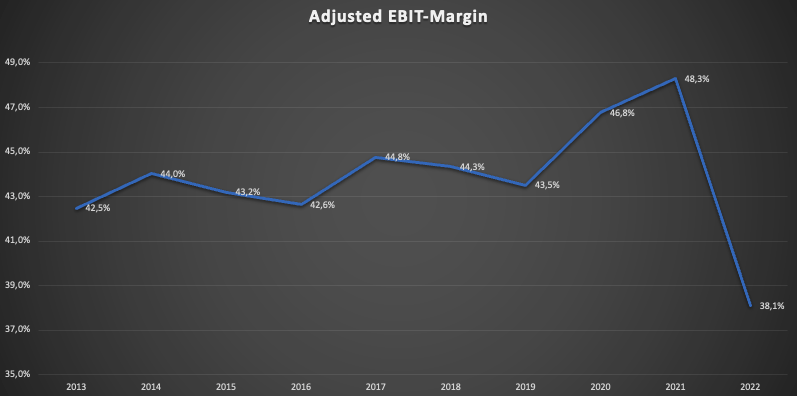
We can see a slight uptrend over the past decade just until the aforementioned decline in the rating business led to deteriorating margins. FY2020 and FY2021 margins were outliers driven by the rating business that flourished because of the zero-interest environment in those years. However, I think that the overall trend of improving margins is still intact and that margins will bounce back sharply once the dust settles.
To end this chapter I want to address Moody's financial stability by looking at the balance sheet. As we can see in the snippet from Seeking Alpha Financials below, net debt increased by a lot over the past decade.
Moody's net debt since 2013 (Seeking Alpha - Financials)
With EBITDA of around $2.3 billion in FY2022 (and $3 billion in FY2021), the current net debt to EBITDA comes in at around 2.5 times. I would like Moody's to run a more conservative balance sheet and cut back on share repurchases but I am also not concerned about current debt levels.
Meanwhile, interest expense barely increased, as can be seen in the following chart:
Interest expense since 2018 (Tikr Terminal)
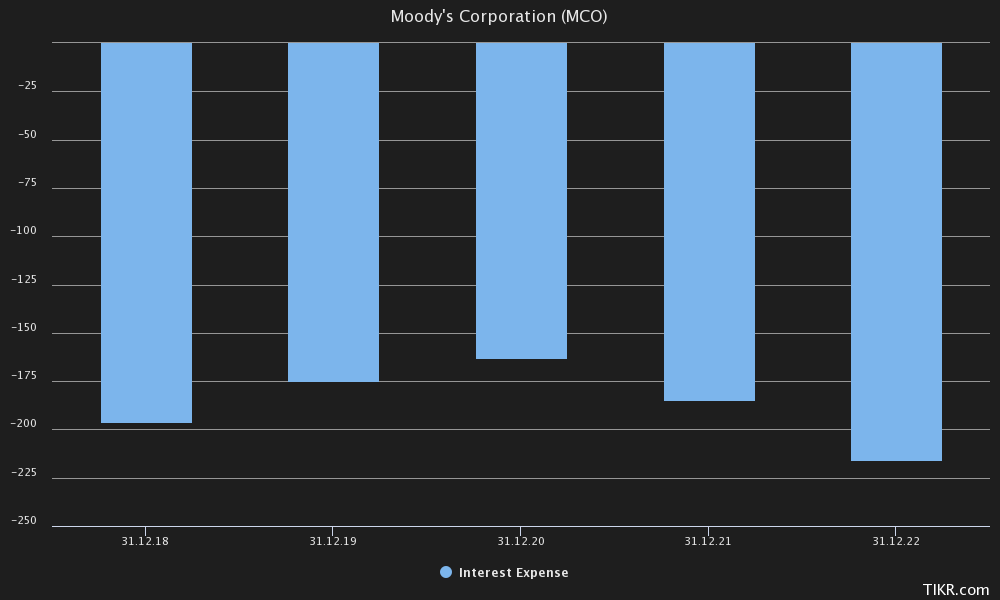
While net debt increased from $3,863 million in FY2018 to $6,243 million in FY2022, interest expense only grew from $196 million to $216 million. This shows that Moody's has been able to handle financing very well. In conclusion, while net debt levels have risen more than I would have liked, Moody's financial stability looks healthy.
First quarter FY2023 results
Moody's reported results for the first quarter of FY2023 on 25/04/2023 and managed to beat revenue and EPS forecasts. The most important parts of the report were the boost in FY2023 EPS guidance and the fact that management reaffirmed MIS long-term revenue growth drivers and MA low double-digit recurring revenue growth.
Adjusted EPS guidance was raised from $9.00-$9.50 to $9.50-$10.00 while free cash flow ((FCF)) guidance was trimmed to $1.4-$1.6 billion from $1.7-$1.9 billion. MIS long-term growth outlook was reaffirmed to be around 6-8% per year. This is in line with my own assumptions (I will come back to this in the next chapter).
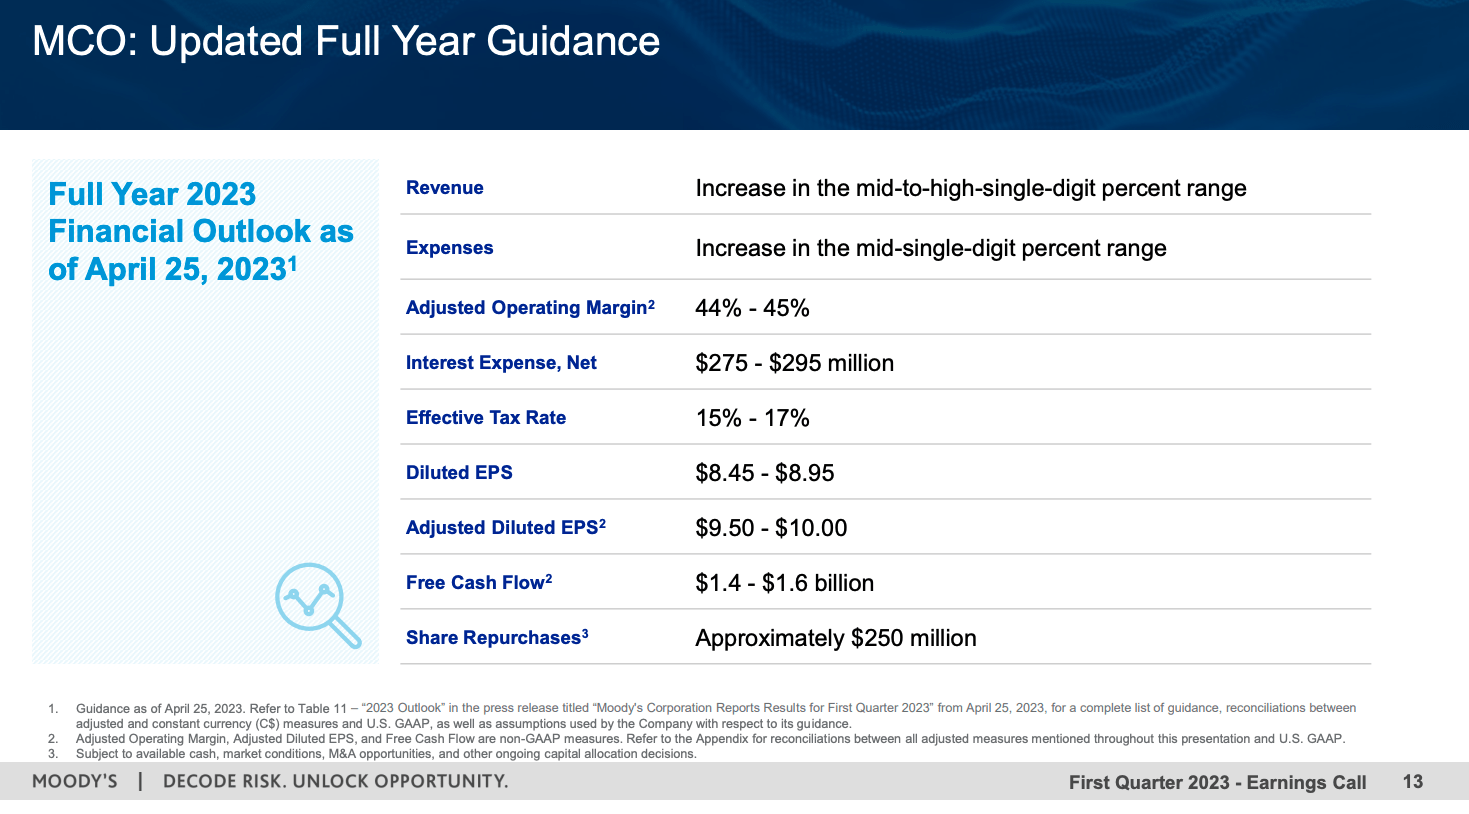
The slide from the earnings presentation below shows Moody's updated FY2023 guidance:
Moody's FY2023 guidance (1st quarter FY2023 earnings presentation)
I want to highlight two things here:
(1) Moody's expects FY2023 adjusted EBIT margin to come in around 44-45%. Keep in mind that Moody's doesn't calculate EBIT margins like me so these numbers are not comparable to mine. However, Moody's FY2022 adjusted EBIT margin (Moody's calculation) came in at 42.6%. The FY2023 guidance implies a margin improvement of around 200 basis points, indicating that margin recovery should start in FY2023.
(2) Interest expense is expected to be around $285 million. This is quite an increase from the $216 million reported in FY2022. We can already see that Moody's higher net debt level starts to find its way into the income statement. This is the reason why I would prefer Moody's to run a more conservative balance sheet, as I stated earlier. If Moody's has to refinance more debt at higher rates, this might be a minor headwind to the bottom line and slow down the expected margin recovery.
Valuation
Let's start with a simple valuation at the current price. At the end of the 1st quarter of FY2023, there were 184.1 million shares outstanding. While I am writing this, Moody's is trading at $306.77 per share, resulting in a market capitalization of $56.5 billion. Adjusted net income for the trailing twelve months came in at $1,530 million so the current P/E ratio is 37. With FY2022 FCF coming in at $1,022 million (note that I treat stock-based compensation as a cash expense), Moody's is trading at an FCF yield of only 1.8%. Note that I use FY2022 FCF because the first quarter FY2023 cash-flow statement hasn't been released yet.
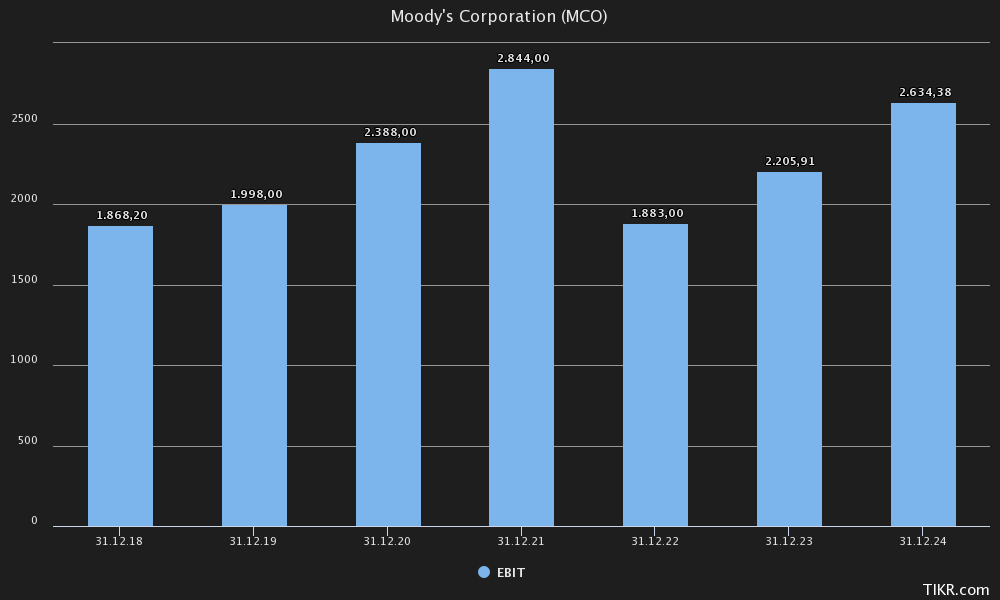
At first, this looks like Moody's valuation is very high. Now like I said, I expect margins to bounce back over the next few years. This should result in strong YoY growth in profits. Analysts seem to expect the same, as can be seen in the following chart:
Analyst's EBIT estimates (Tikr Terminal)
Note that this is reported EBIT. The adjustment for amortization in FY2022 amounted to $200 million. Assuming the same adjustments for FY2023 (1st quarter FY2023 adjustment was $51 million) and FY2024 would put adjusted EBIT at $2,405 million for FY2023 (15.4% YoY growth) and $2,834 million for FY2024 (17.8% YoY growth). Keeping that in mind we need to gauge growth rates for Moody's two business segments.
Let's start with MIS. I want to start with a quote from Moody's CFO Mark Kaye in the 4th quarter FY2022 earnings call :
On the tailwinds side, issuance activity tends to track GDP growth over the medium to long term. And our central case models GDP expansion at a level consistent with what prevailed prior to the COVID-19 pandemic. And we've used our GDP and interest rate predictions from Moody's Analytics forecast, which shows that the 2014 to 2019 average annual real GDP growth was between 2% and 3%, and that's sort of what we expect going forward.
Source: Moody's CFO Mark Kaye - 4th quarter FY2022 earnings call
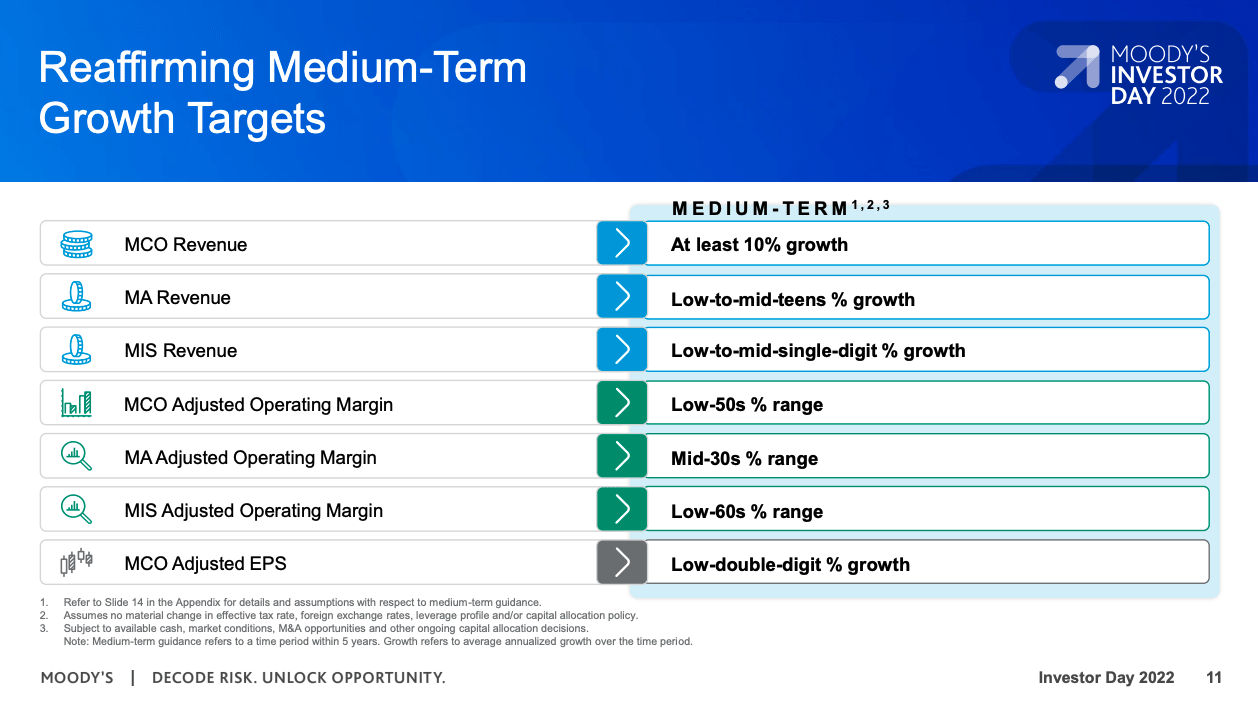
Moody's expects that global issuance activity will track GDP growth over the long term and expects GDP to grow around 2-3% going forward. Additionally, I think that Moody's wide moat in the rating market will allow them to increase prices above the rate of inflation at around 4-5% per year. This would result in annual revenue growth of around 6-8% per year. This would be in line with what major competitor S&P Global forecasted in their 2022 investor day presentation (6-9% annual organic growth). Moody's also guided for low to mid-single digits revenue growth in the MIS segment over the medium-term, as can be seen in the following slide from Moody's 2022 investor day presentation :
Moody's medium-term outlook (Moody's 2022 Investor Day)
As I already stated above Moody's also reaffirmed 6-8% revenue growth for MIS over the long term in the most recent 1st quarter FY2023 earnings presentation. This shows again that the overall outlook for the MIS business hasn't changed at all since the 2022 Investor Day that took place in early 2022.
As I already noted in the MIS chapter, I expect that the improvements in margins will continue. I think that margins might rise slower in the future though. In conclusion, I think MIS should be able to achieve earnings growth in the high single digits over the medium to long term.
Now let's turn to MA. As we can see in the slide above, Moody's expects MA revenue to grow at low to mid-teens percentage rates. This would be in line with the 13% CAGR over the past decade. Meanwhile, MA adjusted EBIT margins are expected to be in the Mid-30s % range. While my calculation of adjusted EBIT margins above is different from Moody's, this would be an increase of 500bps from the MA FY2022 adjusted EBIT margin of 30.2% reported by Moody's. So management indicates that there is quite some operating leverage left for the MA segment. This can also be seen in the most recent 1st quarter results where adjusted EBIT margin for the MA segment came in at 32.1%, up from 28.9% in the 1st quarter of FY2022.
Long-term return potential should always be the sum of (a) long-term FCF growth in the future and (b) the current FCF yield. I expect MIS to grow earnings and FCF in the high single digits and MA to grow in the mid-teens percentage range (including operating leverage). Since MIS account for two-thirds of adjusted EBIT, I assume overall adjusted EBIT growth might reach low double digits. This might seem odd because Moody's wasn't able to grow at these kinds of rates over the past decade. I think with MA growing much faster than MIS and representing a higher percentage of the consolidated business in the future, higher growth rates going forward seem reasonable. Let's assume consolidated MCO might grow earnings and FCF at a rate of 11% per year over the medium term, closer to the earnings growth rates of MA and in line with Moody's expectations for consolidated adjusted EPS growth. Even when only adding the current FCF yield of 1.8% stated above (which is not representative in my opinion because it seems temporarily depressed), we are already looking at 12-13% total return potential over the long term. Keep in my mind that this assumes no changes in valuation.
DCF valuation
We always need to gauge the possible effects of valuation changes by performing a supplemental DCF calculation. In the case of Moody's where earnings seem temporarily depressed, we need to factor in that over the next two years, margins are expected to recover, leading to earnings growth above the long-term expected rate. I will solve this by doing the following:
(1) I will start my DCF calculation from Analyst's FY2024 EBIT expectations and do a top-down calculation to estimate a potential FY2024 FCF.
(2) I will use this FCF and do a DCF calculation. This will result in an FY2024 price target.
(3) I will discount this price target to the present.
As I stated earlier, Analysts estimate Moody's to report an EBIT of $2,634 million in FY2024. Adding back $200 million for amortization of intangible assets would put FY2024 adjusted EBIT at $2,834 million. Over the last couple of years, interest expenses and taxes amounted to around 25% of adjusted EBIT. So FY2024 adjusted net income should be around $2,125 million ($2,834 million x 75%). Moody's cash conversion over the past couple of years came in at around 83%, so FY2024 FCF should come in at around $1,770 million. This number seems reasonable since according to this SA news article , the FY2023 Visible Alpha consensus FCF is $1,590 million.
$1,770 million divided by 184.1 million shares outstanding would put FCF per share at around $9.62. Assuming the aforementioned 11% growth CAGR over the eight years following FY2024, a 10% discount rate and 6% growth into perpetuity (as I always assume for wide moat businesses with good pricing power), Moody's should be worth around $354.25 on FY2024 earnings:
DCF calculation (moneychimp.com)
If we discount this number by 10%, the FY2023 value per share would come in at $319 per share. Keeping in mind that this would be a forward-looking value, Moody's looks slightly overvalued at the current price of $306.77.
Risks
The main risks with my take on Moody's are twofold:
(1) While I assume that the margins in the MIS segment will recover over the near term, a potential recession might delay the margin recovery for one or two more years. While I don't think that this changes anything on the long-term outlook for MIS, it would result in Moody's being overvalued at the current price. Moody's and S&P Global's commentary on the outlook for global issuance activity will be one of the major aspects to look out for.
(2) While I am very confident in the long-term outlook for the MA segment, I rely on management's outlook regarding the possibility of further margin expansion. MA is already operating at adjusted margins in the low 30% range. If MA is not able to expand margins, the consolidated estimated growth rate for Moody's would have to be adjusted to the downside, resulting in Moody's being overvalued at the current price.
Conclusion
While Moody's rating business took a big hit with rising interest rates and sharply declining issuance activity, the long-term outlook should still allow it to grow earnings in the high single digits.
Moody's Analytics is Moody's crown jewel. With close to 100% recurring revenue, strong retention rates, pricing power and tailwinds in the risk assessment market, Moody's Analytics seems to be an outstanding business. Possible margin expansion combined with management's estimate of low to mid-teens % revenue growth going forward should enable it to grow earnings in the mid-double digits.
Taking into account that Moody's earnings should start to increase sharply over the near term as margins start recovering to pre-pandemic levels, my DCF calculation indicates that Moody's is slightly overvalued at the current price of $306.77. However, as I already stated in my initial article on Costco Wholesale ( COST ), there can be times when I rate companies with a buy despite assumed overvaluation. Due to the strong long-term growth outlook and the resilience of the recurring revenue, Moody's is one of these companies.
Therefore I initiate a "buy" rating on Moody's.
For further details see:
Moody's: Resilient Analytics Business With Close To 100% Recurring Revenue