SPTS - More Inflation (And GDP) Data This Week: The Fact Is Inflation Is Decelerating
Summary
- With CPI inflation still declining, the tighter Fed policy is working.
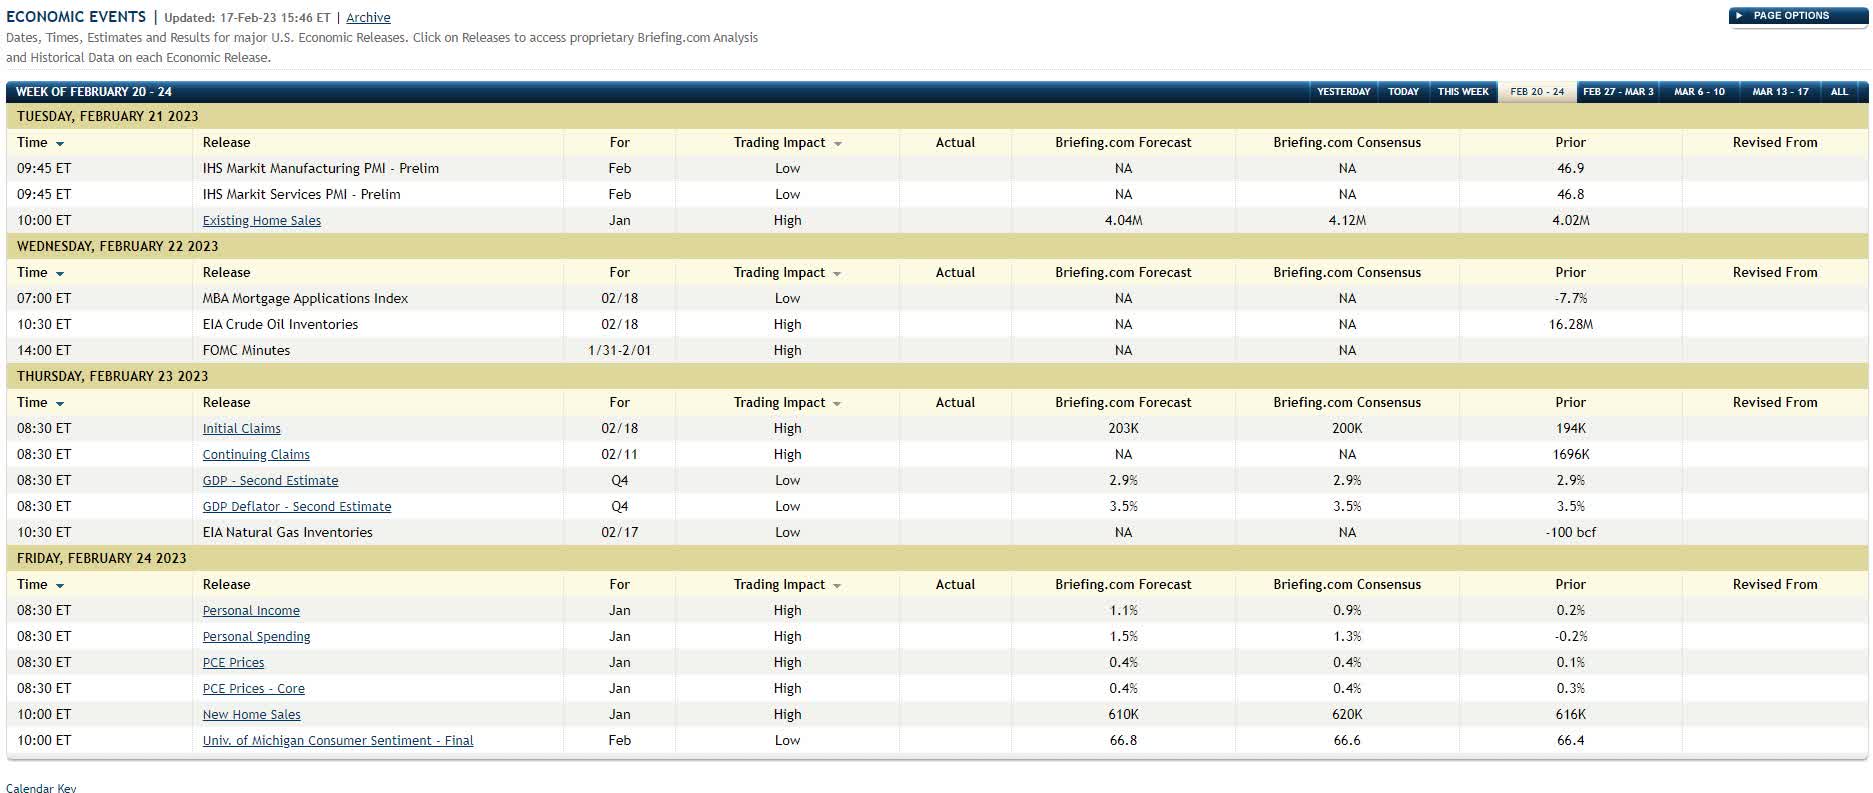
- With Thursday morning’s second pass at Q4 ’22 GDP, we get to see the GDP deflator. Consensus (as well as Briefing.com’s forecast) is for +3.5%, the same as we saw for the first look at the GDP deflator in late January ’23.
- Friday morning’s PCE deflator could be the most important metric of the week, since it’s the Fed’s preferred inflation metric.
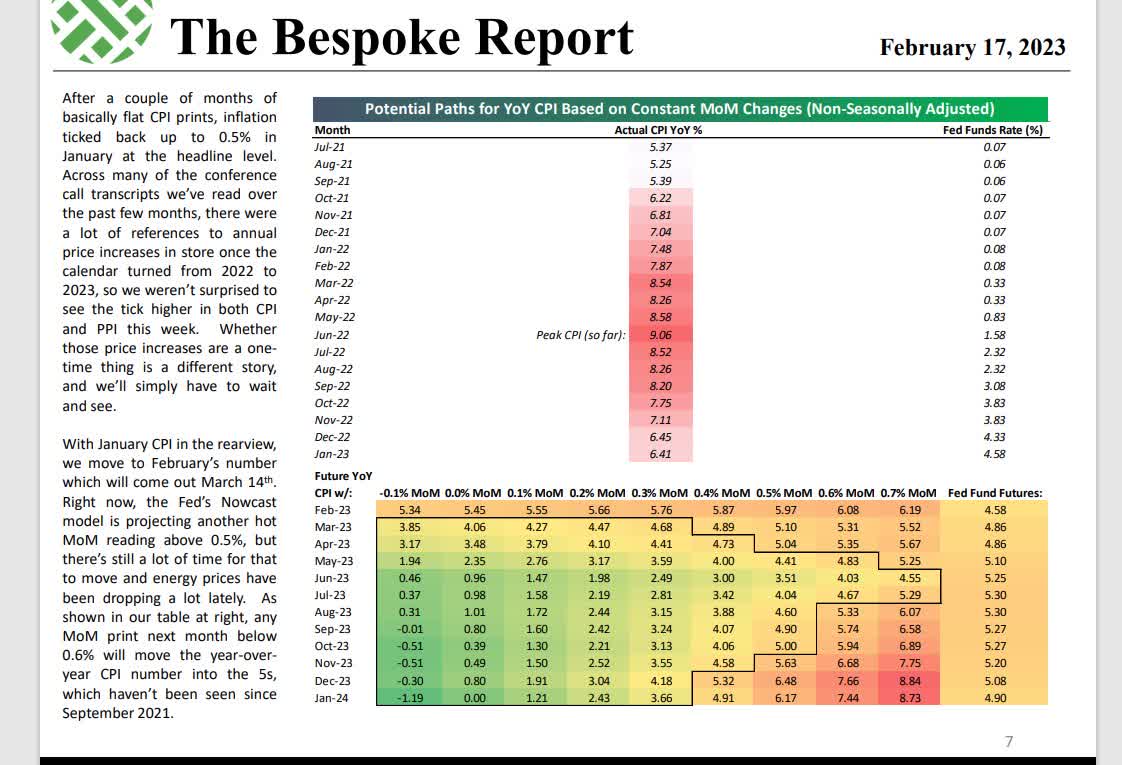
This chart from Bespoke still gets kudos for summarizing the drop in CPI over the last 8 months (in one pic) and then, in the bottom half of the graph, updating readers that with a +0.6% CPI reading for February ’23 (to be reported mid-March ’23), the overall CPI will continue to decline year-over-year.
The Fed Governors and Jay Powell can continue to talk tough, but with CPI inflation still declining, the tighter Fed policy is working, although the Fed’s preferred measure of inflation - the PCE deflator - won’t get released until Friday morning, February 24th, 2023.
More inflation data to come this week
With Thursday morning’s second pass at Q4 ’22 GDP, we get to see the GDP deflator, and consensus (as well as Briefing.com’s forecast) for Q4 ’22 GDP deflator is +3.5%, the same as we saw for the first look at the GDP deflator in late January ’23. The Q4 ’22 GDP estimate is expecting is +2.9%, but with the CPI and PPI numbers, I suspect the overall GDP number will get less attention than the deflator.
Friday morning’s PCE (personal consumption expenditure) deflator could be the most important metric of the week, since it’s the Fed’s preferred inflation metric. The Briefing.com consensus and forecast for PCE Prices and Core PCE prices are actually looking a little hotter than the December ’22 data, at +0.4% and +0.4% respectively.
For readers looking for some explanation of why there are so many different measures of inflation, the government-reported inflation data measures different baskets: the CPI and Core CPI (ex food & Energy) measures a fixed-weight basket of goods (two apples and two oranges over time), while the “deflator” accounts for (or attempts to account for) changes in consumption patterns over time. The most obvious example of changes in consumption patterns at present is the shift or slow migration to electric vehicles (EVs) in the last few years versus the internal combustion engine ((ICE)). The deflator measures price changes in good and services as well.
This article was found online from last fall, which I thought was a comprehensive look at CPI and the PCE and deflator measures, and wasn’t too technical.
One thing that struck me was that in the last 10 years it seems like there is a blending or melding of various inflation statistics so that there aren’t such stark differences between the various measures, and for investors, that’s probably a good thing. When Alan Greenspan issued his famous maxim or dictum in the late 1990s that the CPI likely overstated inflation, that was probably based on his assessment of other inflation measures relative to the CPI. However, to be frank, I’d rather read the opinion of an economics PhD on this topic rather than my own impression, but that will likely have to wait.
Summary / Conclusion
Listening to mainstream media as often as I do being an investment advisor, I shudder to think what it’s like for a retail investor trying to navigate the markets while being bombarded with media headlines and the daily onslaught of opinions. Just listening to “inflation” opinions, it fascinates me how there is a little distinction around the various measures and how they differ, but the fact is the mainstream media can’t get too technical or they risk losing viewers.
The point being while the CPI and PPI data this week were a little hotter than expected, the S&P 500 fell just -0.28% on the week, while the Barclays Aggregate ( AGG ) (the bond market main benchmark) fell just -0.43% on the week, or what I would consider rather muted responses to what seems like inflation hysteria.
Take note of the Q4 ’22 GDP and GDP deflator data, however, the PCE data on Friday morning, February 24th is the key economic release of the week, in my opinion. This is the favored Fed inflation indicator, and Jay Powell has said repeatedly that “PCE Services - ex-housing” data is being scrutinized carefully.
Anyway, take this all as another opinion in a sea of opinions being profferred to readers. Past performance is no guarantee of future results. The inflation trends seem to be trending towards “disinflation” or deceleration, but that could quickly reverse too, even though history says that once inflation fever is broken, it tends to continue to recede.
All my Money & Banking and Bond Management classes taught me over the years that it was “unanticipated inflation” that causes the most serious issues for the bond market and economic forecasting, and with the last year, you’d have to think that inflation has become pretty “well-anticipated”. The Fed’s hawkishness is a way to insure that investors and corporate managers don’t become too complacent in the battle to continue to bring inflation down.
Editor's Note: The summary bullets for this article were chosen by Seeking Alpha editors.
For further details see:
More Inflation (And GDP) Data This Week: The Fact Is Inflation Is Decelerating