NTR - Mosaic: Clear Undervaluation And Seasonal Trading Bottom
2023-11-24 05:17:39 ET
Summary
- Mosaic had a very successful year in 2022 due to high fertilizer pricing caused by the Russian invasion of Ukraine, with 2023 results not far behind.
- MOS's improved balance sheet and valuation metrics make it an intriguing investment, especially if grain prices rise soon.
- Technical trading momentum is trying to turn higher, and seasonal price patterns are strongest between December and February.
The Mosaic Company ( MOS ) is one of the largest fertilizer companies in North America, selling concentrated phosphates and potash to crop farmers as its main customers. Mosaic's business is very cyclical, often performing poorly during recessions, as farmers cut back on discretionary spending when grain prices are low. For sure, this is the main risk owning shares, with late 2008 into 2009, plus 2020 as examples of rough stretches for investors.
However, today the company is coming off one of its best years ever in 2022, as the Russian invasion of Ukraine sent worldwide potash and fertilizer pricing through the roof on supply worries. The company has dramatically improved its balance sheet since the 2020 pandemic and is again trading below book value. In addition, using trailing 2023 financial results and analyst projected numbers for 2024, Mosaic appears to be quite undervalued on a variety of metrics.
What's talked me into buying shares over the last few weeks is much improved technical trading action, alongside regular seasonal bottoms in the stock between late October and early December. The new growing season cycle usually begins for fertilizer interest about now, planning ahead to farmer purchases/company sales by early spring for North American crop plantings.
So, the overall buy proposition is very intriguing going forward, especially if a recession can be avoided for the optimistic-thinking crowd. (I am projecting some sort of U.S. recession will start soon, whether mild or deep is open to debate.) What I cannot predict with any certainty is the direction of grain prices globally, or the eventuality of fertilizer supply shortages. All else being equal, if grain prices hold up or increase next year, Mosaic should experience another year of above average demand and pricing power for its fertilizers.
Bullish Valuation Story
Despite a drop in fertilizer pricing and operating business results during 2023, the company has remained extremely profitable. Crossing stronger sales, income and cash flow than before the COVID-19 pandemic, with a stock price about the same as late 2018, the underlying valuation has become quite attractive for new investment.
On price to trailing 12-month earnings (9.2x), revenue (0.81x), cash flow (4.3x) and free cash flow (8.42x), Mosaic looks like a bargain vs. its historical averages. I have drawn a chart of fundamental valuation zigzags back to 2006 below.
YCharts - Mosaic, Trailing Fundamental Valuations, Since 2006
Another part of the valuation setup that attracts my attention is the total equity market capitalization is trading slightly below accounting book value. Historically since 2006, MOS has traded above book value roughly 90% of the time. The only major discount occurred for a few months in 2020 after the pandemic started. Yet, this span also opened the best opportunity to acquire shares for long-term investors since 2007.
YCharts - Mosaic, Equity Market Capitalization to Accounting Book Value, Since 2006
When we subtract changing cash holdings and include total debt, the enterprise value calculation points to an even smarter buy proposition. EV to core cash EBITDA is running around 5.5x today, while EV to sales is near 1.0x. Both stats are effectively the lowest since the Great Recession ended in 2009.
YCharts - Mosaic, Enterprise Valuation to EBITDA & Sales, Since 2006
Cash Flow Stats
Cash flow as a function of each dollar in sales or total debt are also worth serious investor consideration. In terms of efficiency and productivity, cash flow numbers are the best since 2015.
YCharts - Mosaic, Cash Flow to Sales & Debt, Since 2015
The cash flow gains are primarily the result of windfall profits the last two years reinvested into a much-improved balance sheet. Total debt to equity is the lowest since 2015, while total liabilities to assets have shrunk to 2017 levels.
YCharts - Mosaic, Balance Sheet Ratios, Since 2006
Free cash flow yield is now staying well above normal levels. One of Wall Street's favorite valuation gauges is cash flow generation minus necessary capital spending each year to keep a business functioning. When we take the free cash flow total and divide by the current share quote, FCF yield of nearly 12% on a trailing basis is dramatically better than other U.S. corporations. For example, most companies in the S&P 500 are delivering between 4% and 6% for free cash flow yield in 2023. Big Tech favorites are in the 2% to 3% range. In addition, Mosaic's FCF yield is more than double existing cost-of-living changes in the CPI of 3.5% or alternative investment rates around 5% on cash savings instruments.
YCharts - Mosaic, Trailing Cash Flow Yield, Since 2006
SA Valuation Grade
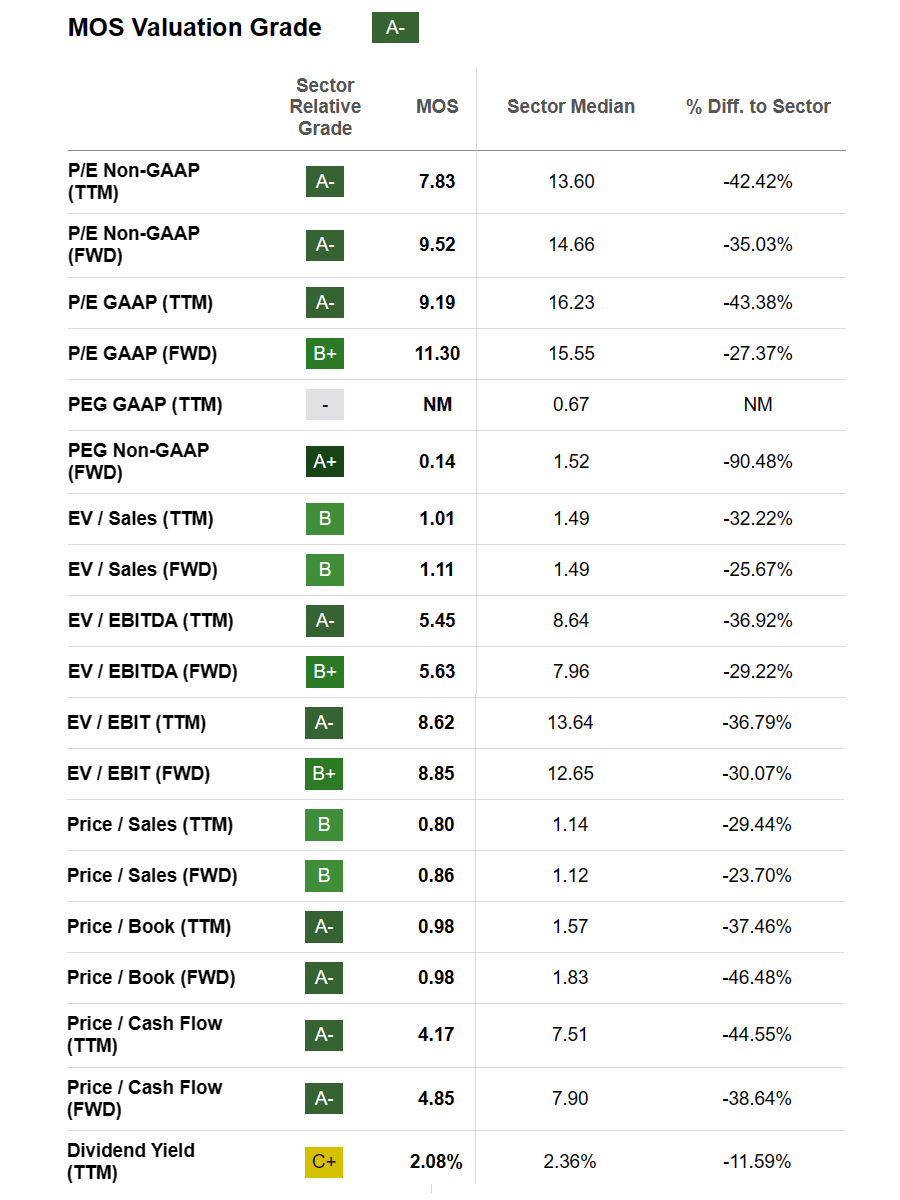
Lastly, Seeking Alpha's computer ranking system gives Mosaic an "A-" Valuation Grade , based on comparisons to industry results. If you like to buy stocks that are cheap, MOS is one to research further.
Seeking Alpha - Mosaic Valuation Grade, November 22nd, 2023
Seasonal Bottom - Technical Charts
Mosaic has had a "down" year in 2023 vs. 2022, both for the business and the stock quote. Operating results and fertilizer pricing fell hard off the 2022 war-induced peak, with shares declining in step.
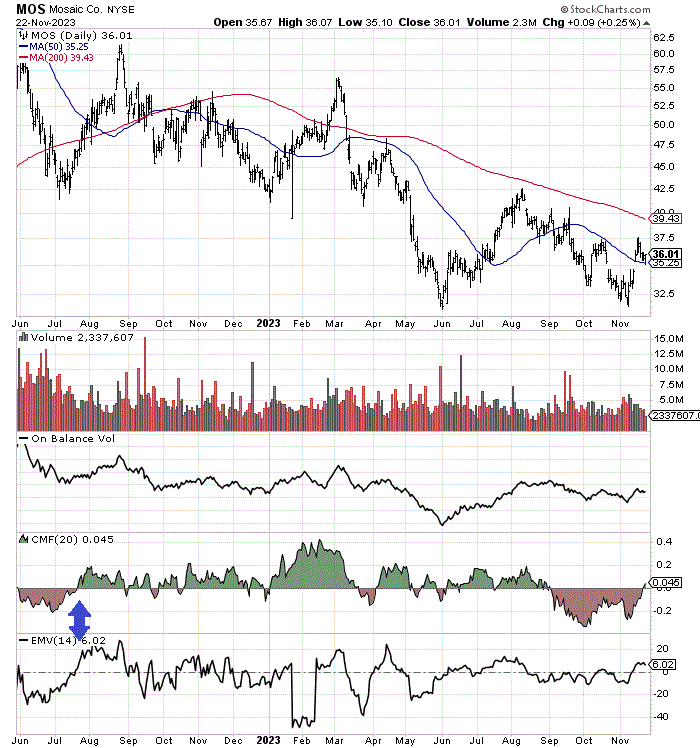
Yet, selling pressure appears to have abated since late May. A variety of momentum indicators like On Balance Volume bottomed and have acted in a healthier manner since then. The share price low of May has remained as support, with the early November low bouncing off this level. We may have outlined a double-bottom pattern in the $31-$32 area.
Now price has closed above its 50-day moving average on 5 consecutive days for the first time since August. More importantly, 20-day Chaikin Money Flow and 14-day Ease of Movement calculations have turned positive this week. The last time a prolonged selloff in these two indicators reversed into positive territory simultaneously was July 2022 (marked with blue arrows). Following this setup, price rose abruptly by +35% over 6 weeks.
StockCharts.com - Mosaic, 18 Months of Daily Price & Volume Changes
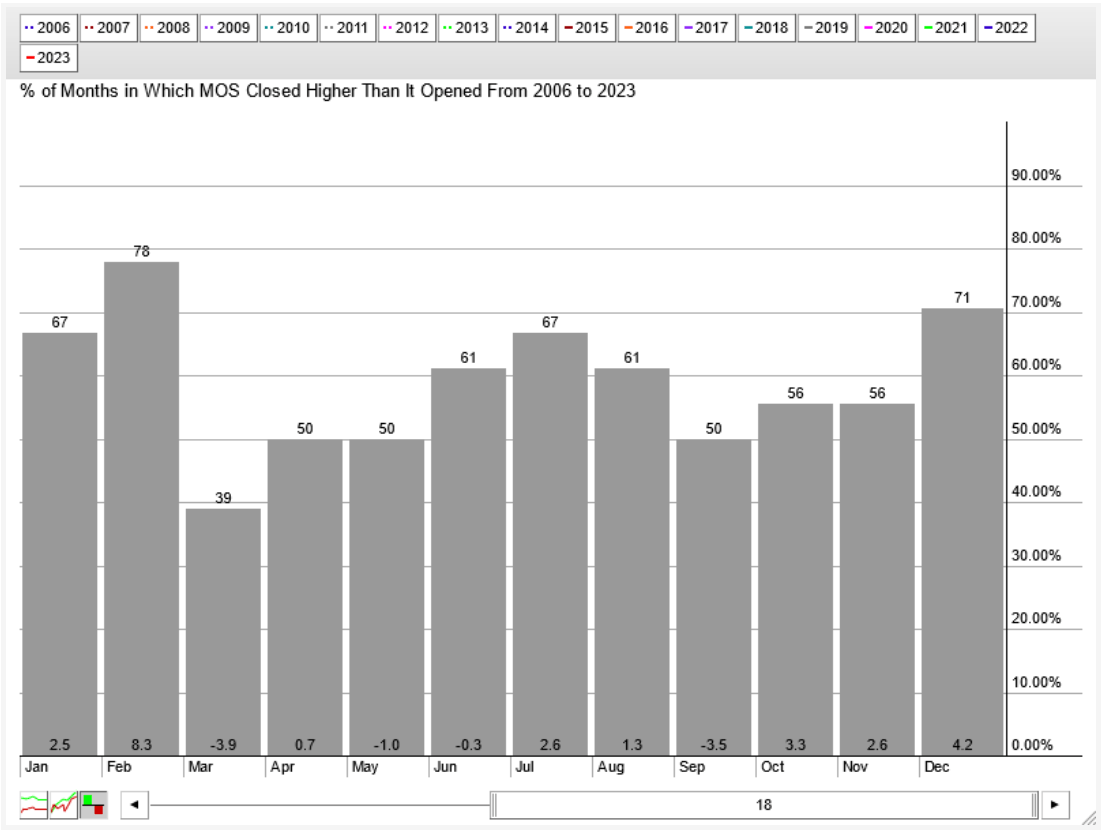
Bulls take note, the best 3-month span to own shares has historically been between December and February. If your goal is to increase the odds of investment success using seasonal patterns, buying shares in November and holding into the end of winter holds vastly increased odds of delivering a profit than other times during the year. You can review the 18-year average odds of monthly price advance throughout the seasonal calendar below.
StockCharts.com - Mosaic, Percent of Up/Down Months for Price, Seasonal Calendar, Since 2006
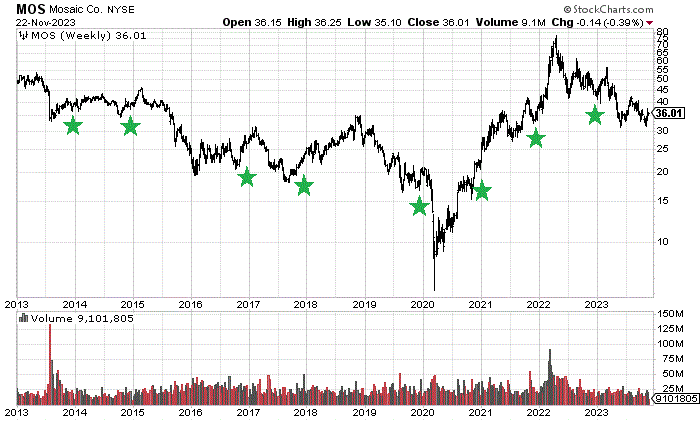
In addition, had you purchased at the end of November and held until the end of February (our 3-month primetime period to own shares), Mosaic rose in price 8 of the last 10 years (80% of the time). So, using technical and seasonal analysis, MOS could be ready for another decent jump into early 2024.
StockCharts.com - Mosaic, Weekly Price Changes (Dividend Adjusted), Since 2006, Author Reference Points
Final Thoughts
Without doubt, phosphate and potash pricing will dictate Mosaic's share quote direction. The good news is prices for both are still trading at a higher level than most years since 2013.
YCharts - Potash & Phosphate, Monthly Prices, Since 2006
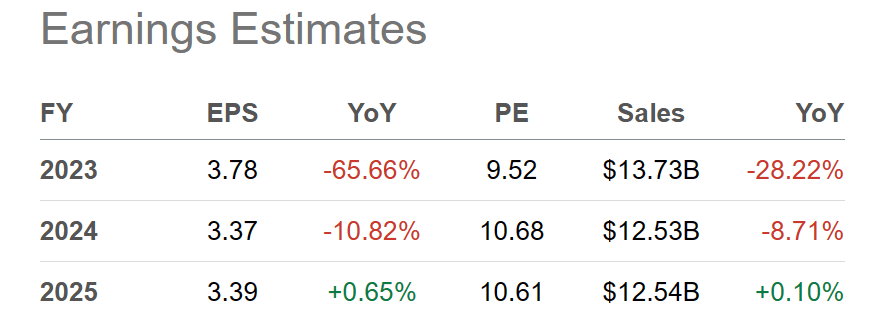
Wall Street analysts are projecting a stabilization trend for fertilizer pricing in 2024, at levels above 2019, before the pandemic started. For upside forecasting, any increase in farming demand (with rising grain prices) or supply shortfalls from war and climate-change effects could translate into sales above $14 billion and EPS higher than $4 annually. Under rosy scenarios, free cash flow yields could potentially remain better than 10% for years.
Seeking Alpha Table - Mosaic, Analyst Estimates for 2023-25, Made November 22nd, 2023
I mentioned Intrepid Potash ( IPI ) as another bullish idea in the U.S. fertilizer field a few weeks ago here . Given a turn higher in industry pricing, I expect Intrepid (selling for less than tangible book value and holding only minor liabilities) and the largest North American fertilizer company Nutrien ( NTR ) to be solid winners alongside Mosaic during 2024. Again, it depends on farm demand for potash and phosphates (related to grain prices), whether we experience an overall global recession, and the potential for supply disruptions next year.
I may sell half of my position, given a quick 10% or 15% gain in Mosaic. One of my trading strategies is to lock-in immediate gains. This mathematically increases the odds of overall trading/investing success, as I would effectively slash the base purchase cost on the leftover smaller position (meaning MOS would have to fall -20% to -30% to generate a net loss on the whole transaction). That way if we do end up in recession next year, future Mosaic losses would be easier to handle inside a diversified portfolio design.
At prices around $36 over the next couple of weeks, I rate Mosaic a Buy . Undervaluation characteristics, turning momentum, and the seasonally strong period into early March argue for ownership, in combination. Upside projections for 2024 will depend on a range of factors, but a 15x P/E ratio (the 20-year cycle-adjusted average) on a rate of $4 EPS gets you to $60 a share in a best-case scenario. My downside "risk" estimate is 15x on $2 EPS would bring price back to $30 (well below book value) in a mild recession.
Thanks for reading. Please consider this article a first step in your due diligence process. Consulting with a registered and experienced investment advisor is recommended before making any trade.
For further details see:
Mosaic: Clear Undervaluation And Seasonal Trading Bottom