MOS - Mosaic: The Sell-Off Was Justified
- Our previous Sell rating on Mosaic stock has played out accordingly, as the market digested MOS gains further, despite its "cheap" valuations. It has also significantly underperformed the market recently.
- We believe it could be consolidating at its near-term support, potentially drawing in more dip buyers. Therefore, we will be watching closely for another potential bull trap to form.
- Our valuation analysis indicates that MOS could continue to underperform the market.
- Given its potential consolidation phase, we revise our rating from Sell to Hold. We will reassess our rating if another bull trap forms subsequently.
Investment Thesis
We present a timely update to our thesis on The Mosaic Company ( MOS ), as our previous Sell rating on MOS has played out accordingly. Despite its seemingly "cheap" valuations, it has significantly underperformed the SPDR S&P 500 Trust ETF ( SPY ) since we published our last article.
Notably, MOS has fallen by more than 20.5%, against the SPY's 4.1% decline at writing. As a result, we remind investors that price structures are forward-looking and urge investors not to ignore critical warning signals that we previously highlighted.
Our valuation model also suggests that the market expects MOS to continue underperforming. Therefore, a steeper fall to normalize those massive gains from its COVID bottom could continue.
Notwithstanding, our price action analysis suggests that it seems to be at a near-term bottom. But we don't expect the current bottom to hold. However, given oversold technicals, we expect a short-term rally before another bull trap forms subsequently.
Therefore, we believe it's appropriate to revise our rating from Sell to Hold as we await the next potential bull trap. Investors can consider layering out again at its next rally. Investors/traders who shorted the stock can also consider covering their positions.
Ask Why Did The Market Form The Bull Trap At 12% Free Cash Flow Yield
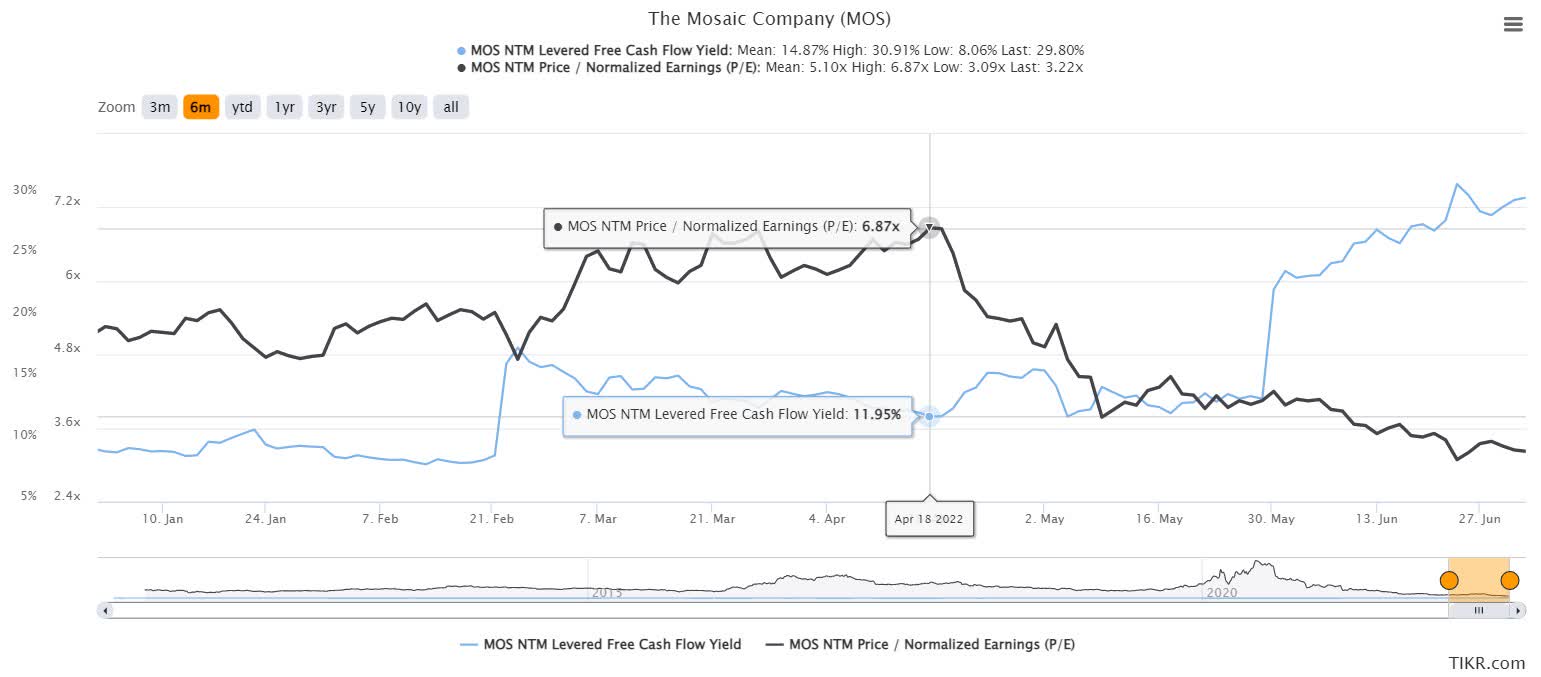
Our previous analysis indicated the market set up the bull trap (significant rejection of buying momentum) in mid-April. The recent price action has corroborated our thesis, as we managed to alert investors to sell before its steep decline.
Notably, the rejection was formed even though MOS traded at an NTM FCF yield of close to 12% in mid-April. The market is not "dumb." If it forms a bull trap, which is a significantly bearish price structure, investors need to ask why, despite its seemingly "cheap" valuations.
Because Mosaic's Growth Could Slow Markedly
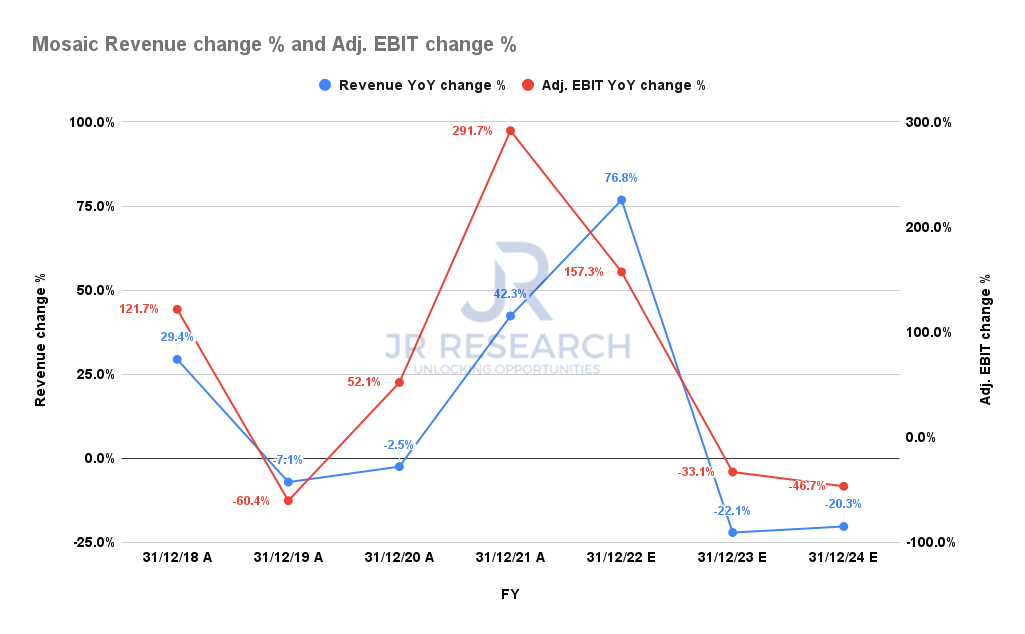
Mosaic revenue change % and adjusted EBIT change % consensus estimates (S&P Cap IQ)
Mosaic's revenue growth is expected to peak in FY22 before declining through FY24. Notwithstanding, the consensus estimates (generally bullish) suggest that Mosaic could post higher revenue in FY24 than its pre-COVID metrics. Therefore, we believe the Street's modeling is appropriate given the current tailwinds underpinning Mosaic's business model.
However, the recessionary headwinds seem to have caught up with MOS. Citi ( C ) downgraded commodity chemical stocks in mid-June, expecting further headwinds from the Fed's rate hikes.
Before the downgrade, Bloomberg reported that the Biden Administration has been " quietly encouraging agricultural and shipping companies to buy and carry more Russian fertilizer in a bid to ease soaring food costs." Furthermore, another recent report highlighted that farmers are biding their time on further fertilizer purchases, possibly expecting prices to fall further.
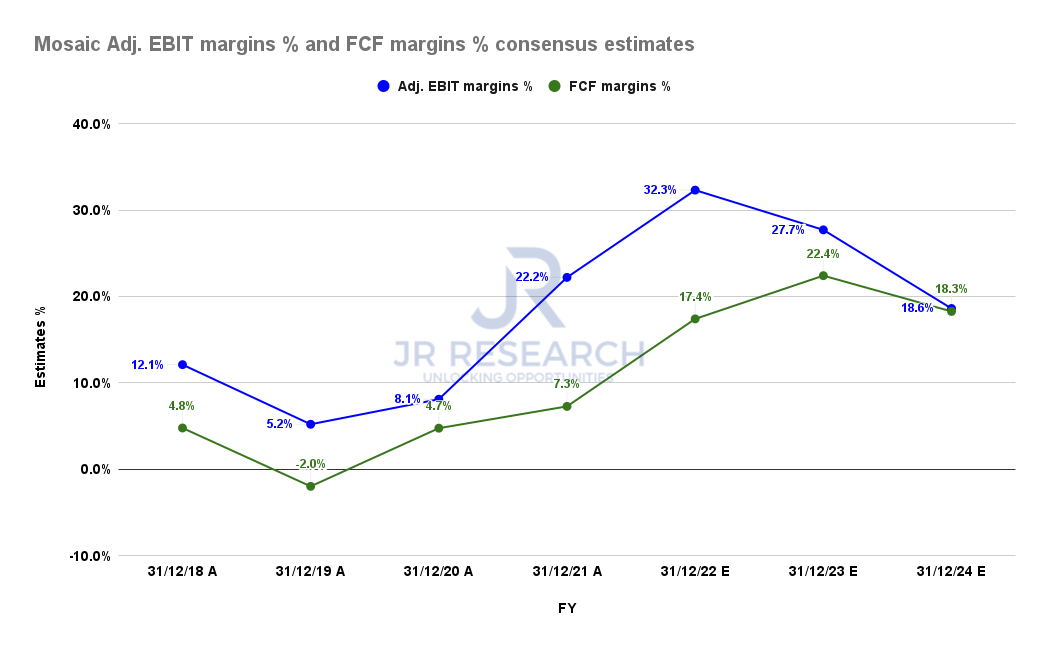
Mosaic adjusted EBIT margins % and FCF margins % consensus estimates (S&P Cap IQ)
As a result, we believe investors need to consider that Mosaic's profitability could also be markedly impacted through FY24. The revised consensus estimates suggest a significant deceleration in its free cash flow ((FCF)) margins, given slower revenue growth.
Notably, it expects peak FCF margins of 32.3% in FY22 before falling to 18.3% in FY24. Notwithstanding, they are still likely to be higher than its pre-COVID metrics. It's also expected to be much higher than its 5Y and 10Y average of 3.5% and 5.4%, respectively. Therefore, much optimism has already been baked into the Street's consensus.
MOS - Bull Trap Eviscerated Buyers At The Top
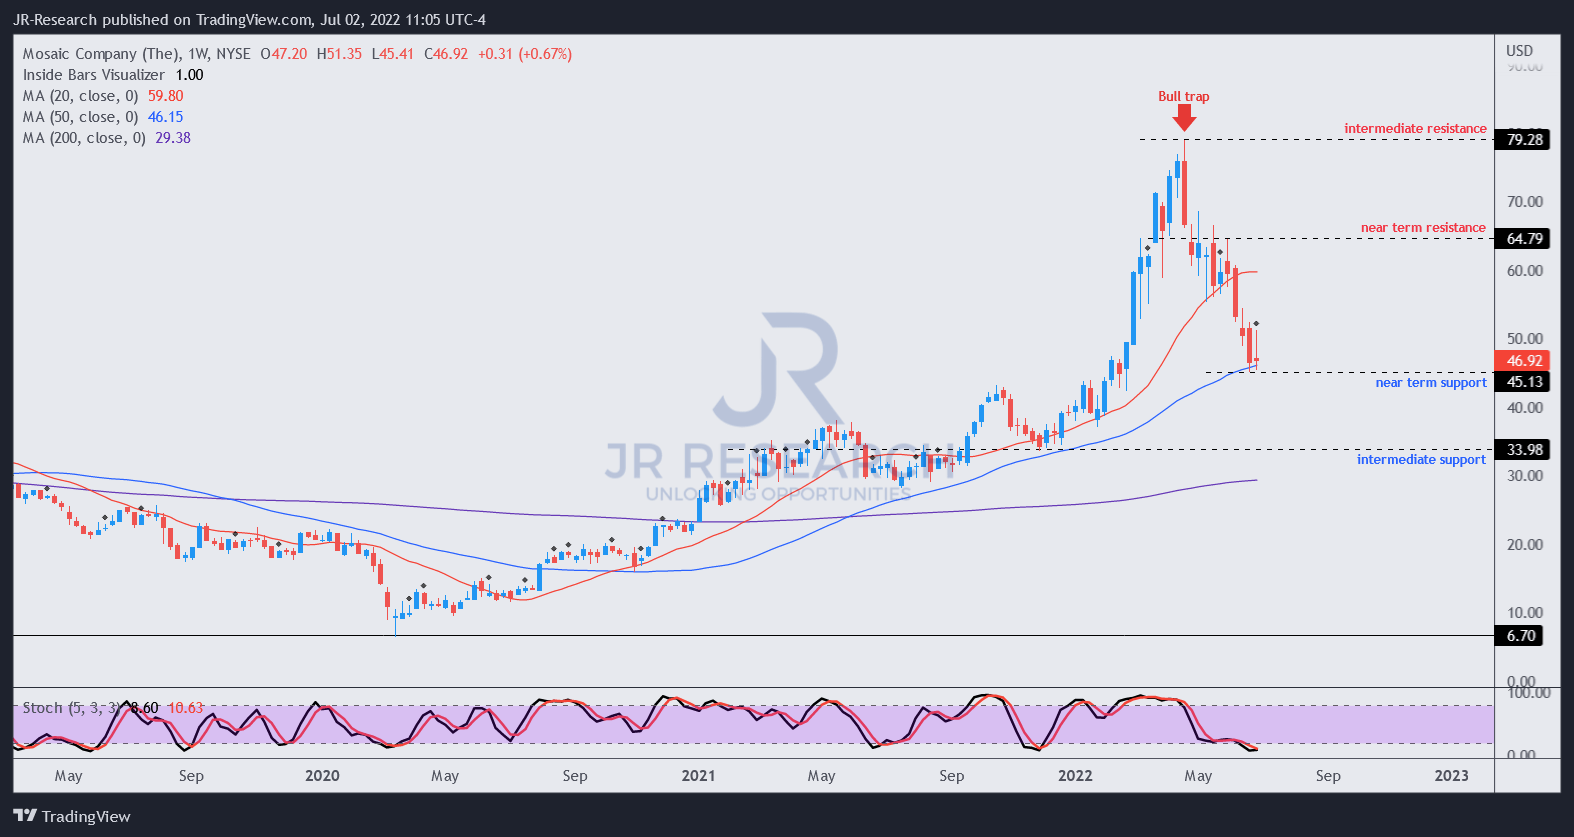
April's bull trap has shown investors why they should pay attention to price action. We have often emphasized that price structures are forward-looking. It highlights the market's forward intentions. Therefore, investors who can "decode" and interpret price structures could gain tremendous forward insights into the market's next potentially significant move.
Notably, the selling overdrive has sent MOS into oversold zones. Therefore, we expect a near-term bottom to form, underpinned by its near-term support. Notwithstanding, we don't expect its support to hold eventually. However, the market could use a consolidation phase to draw in more dip buyers before staging a short-term rally to form another bull trap.
Accordingly, we will await its next potential bull trap price structure first.
MOS Will Likely Underperform
| Stock |
| MOS |
| Current market cap |
| $16.98B |
| Hurdle rate ((CAGR)) |
| 10% |
| Projection through |
| CQ4'26 |
| Required FCF yield |
| 20% |
| Assumed TTM FCF margin in CQ4'26 |
| 15% |
| Implied TTM revenue by CQ4'26 |
| $34.77B |
MOS reverse cash flow valuation model. Data source: S&P Cap IQ, author
It's easy to see why MOS could underperform, despite having "cheap" valuations. We used a hurdle rate of 10%, slightly below the market 5Y CAGR.
MOS last traded at an FCF yield of close to 30%. But a bull trap formed at the 12% mark. Therefore, we think the market was convinced that 12% was too low to compensate for potentially slowing revenue growth and lower margins moving ahead.
As a result, we used a blended FCF yield requirement of 20% to model for the market's current valuation dynamics.
Assuming a blended TTM FCF margin of 15% (still much higher than its 5Y and 10Y averages), we derived a TTM revenue target of $34.77B by CQ4'26.
We believe Mosaic could fail to attain our revenue target based on the current consensus estimates. As a result, the market will likely ask for even higher FCF yields to compensate for a much lower implied hurdle rate.
Is MOS Stock A Buy, Sell, Or Hold?
We revise our rating on MOS from Sell to Hold.
While our bias is still to the downside, we believe it could be at a near-term bottom. Then, the market could use a consolidation phase to distribute further before staging a short-term rally to form another bull trap.
Therefore, we don't encourage investors to buy the dip. Instead, we will be monitoring for its next potential bull trap, which would give us the next Sell signal.
Our valuation model suggests that MOS could significantly underperform the market moving forward.
For further details see:
Mosaic: The Sell-Off Was Justified