SUB - MUNI: Outperforming Competitors But Still Unattractive
2023-12-28 10:04:43 ET
Summary
- PIMCO Intermediate Municipal Bond Active Exchange-Traded Fund ETF is an actively managed municipal bond fund with a flexible strategy and high turnover.
- The MUNI ETF has a higher risk in credit rating but a lower risk in maturity compared to iShares National Muni Bond ETF.
- It is more diversified geographically, with a lower allocation to New York and California.
- Despite being among the best performers in its category in the last 5 years, MUNI may not be attractive as a long-term investment due to losses in inflation-adjusted value and income stream.
Strategy
PIMCO Intermediate Municipal Bond Active Exchange-Traded Fund ETF (MUNI) is an actively managed municipal bond fund launched on 11/30/2009. It has 441 holdings, a trailing 12-month distribution yield of 2.80%, an estimated yield to maturity of 3.68% and an expense ratio of 0.35%. Distributions are paid monthly.
As described in the prospectus by PIMCO , the fund's objectives are current income and long-term capital appreciation. It seeks…
to maintain a fairly consistent level of dividend income, subject to market conditions, by investing in a broad array of fixed income sectors and utilizing income efficient implementation strategies. Long-term capital appreciation sought by the Fund generally arises from decreases in interest rates or improving credit fundamentals for a particular sector or security (…) PIMCO will utilize a bottom up approach to seek to identify asset classes and securities that are undervalued.
The fund invests primarily in investment grade bonds, but may also invest in:
- Derivative instruments, such as options, futures, swaps, mortgage- or asset-backed securities.
- High yield securities ("junk bonds"), up to 30% of assets.
- Securities denominated in foreign currencies, up to 15%.
- Instruments tied to emerging countries, up to 15%.
- Preferred and convertible securities, up to 10%.
In the most recent fiscal year, the portfolio turnover rate was 352%, which is very high. In this article, I will take as a benchmark the largest municipal bond ETF: iShares National Muni Bond ETF (MUB).
Portfolio
The next chart lists the states where MUNI has more than 1% of assets. They represent an aggregate weight of 82%, and 87% for MUB. Compared to the benchmark, MUNI underweights New York, California, and is more diversified geographically.
Geographical allocation in % of assets (Chart: author; data: PIMCO, iShares)
MUNI has 17.87% of assets invested in securities below investment grade (rated below BBB- or not rated), whereas MUB has less than 0.1% in this category.
Credit rating profile in % of assets (Chart: author; data: PIMCO, iShares)
About 84% of the fund's assets has a maturity of 10 years or less, vs. 39% for MUB.
Maturity profile in % of assets (Chart: author; data: PIMCO, iShares)
Performance
Since its inception in November 2009, MUNI has underperformed MUB by 34 bps in annualized return (including distributions). However, it shows a marginally better risk-adjusted performance (Sharpe ratio in the next table) thanks to a lower volatility
| Total Return |
| Annual Return |
| Drawdown |
| Sharpe ratio |
| Volatility |
| MUNI |
| 44.71% |
| 2.66% |
| -11.15% |
| 0.42 |
| 3.97% |
| MUB |
| 51.54% |
| 3.00% |
| -13.68% |
| 0.4 |
| 5.05% |
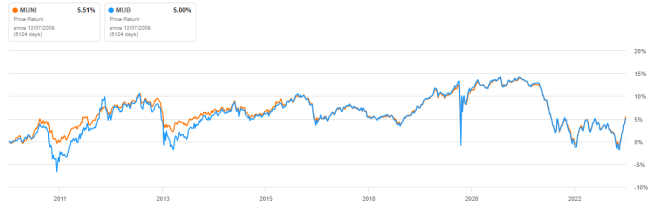
For both funds, the capital appreciation has been about 5% in 14 years, as reported by the chart below (price return, excluding distributions). In the same time, the cumulative inflation has been about 42%, based on CPI. This represents a significant loss in inflation-adjusted value for shareholders.
MUNI vs. MUB, price return since MUNI inception (Seeking Alpha)
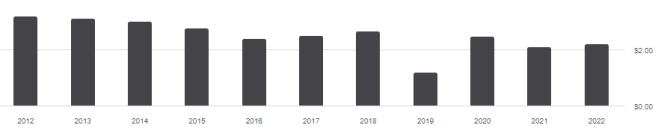
The annual sum of distributions has gone slightly down in the last 10 years, from $1.23 to $1.10 per share (-10.6%). Once again, this represents a significant loss of income stream for shareholders relative to a cumulative inflation about 29%.
It is even worse for MUB, which has suffered a decrease in distributions of 30.3% (from $3.20 to $2.23 per share).
MUNI vs competitors
The next table compares characteristics of MUNI, MUB, and four of the most popular Muni bond ETFs:
- Vanguard Tax-Exempt Bond ETF (VTEB)
- iShares Short-Term National Muni Bond ETF (SUB)
- SPDR Nuveen Bloomberg Municipal Bond ETF (TFI)
- First Trust Managed Municipal ETF (FMB).
| MUNI |
| MUB |
| VTEB |
| SUB |
| TFI |
| FMB |
| Inception |
| 11/30/2009 |
| 9/7/2007 |
| 8/21/2015 |
| 11/5/2008 |
| 9/11/2007 |
| 5/13/2014 |
| Expense Ratio |
| 0.35% |
| 0.05% |
| 0.05% |
| 0.07% |
| 0.23% |
| 0.65% |
| AUM |
| $1.36B |
| $38.08B |
| $33.41B |
| $9.09B |
| $3.79B |
| $1.94B |
| Avg Daily Volume |
| $15.34M |
| $663.78M |
| $468.71M |
| $74.91M |
| $61.33M |
| $14.95M |
| Yield TTM |
| 2.80% |
| 2.65% |
| 2.80% |
| 1.73% |
| 2.41% |
| 2.99% |
MUNI is the smallest fund in this group regarding assets under management, or AUM. It has the second most expensive fee behind another actively managed fund: FMB. In the last 5 years, MUNI has been the best performer by a short margin:
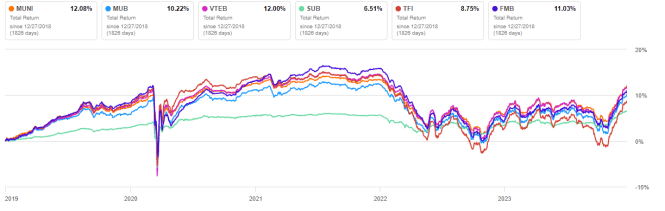
Takeaw ay
PIMCO Intermediate Municipal Bond Active Exchange-Traded Fund ETF is an actively managed fund in municipal bonds with a flexible strategy and a high turnover. Compared to iShares National Muni Bond ETF, it shows a higher risk in credit rating, but a lower risk regarding maturity. The strategy has resulted in a slightly lower historical volatility since inception and a better preservation of distributions in the last 10 years. Despite a high expense ratio, it has been among the best performers in its fund category in the last 5 years. Nevertheless, losses in inflation-adjusted value and income stream don't make MUNI really attractive as a long-term investment. The Muni bond asset class is more useful as a component of a tactical allocation strategy switching between bond categories, but in this case a more liquid ETF like MUB is preferable.
For further details see:
MUNI: Outperforming Competitors, But Still Unattractive