MUR - Murphy Oil: A Small But Solid Domestic E&P Company
2023-06-26 12:28:42 ET
Summary
- Murphy Oil Corporation reported a net income of $191.64 million, or $1.22 per diluted share, for the first quarter of 2023.
- The company produced 172.508K Boep/d in the first quarter, comprising 60% of liquids.
- Murphy Oil maintained a quarterly dividend of $0.275 per share in 1Q23.
- I suggest accumulating Murphy Oil between $34 and $35, potentially lowering support to $33.
Introduction
Murphy Oil Corporation (MUR) is an independent global oil and natural gas exploration and production company I have followed on Seeking Alpha since October 2017.
The company released its first-quarter 2023 results on May 3, 2023. Company presentation can be accessed by clicking here.
Note: This article updates my preceding article, published on January 30, 2023.
1 - 1Q23 Results Snapshot
The company posted a first-quarter 2023 adjusted net income, excluding discontinued operations and other one-off items, of $1.24 per diluted share, beating analysts' expectations. It compares to $0.73 last year.
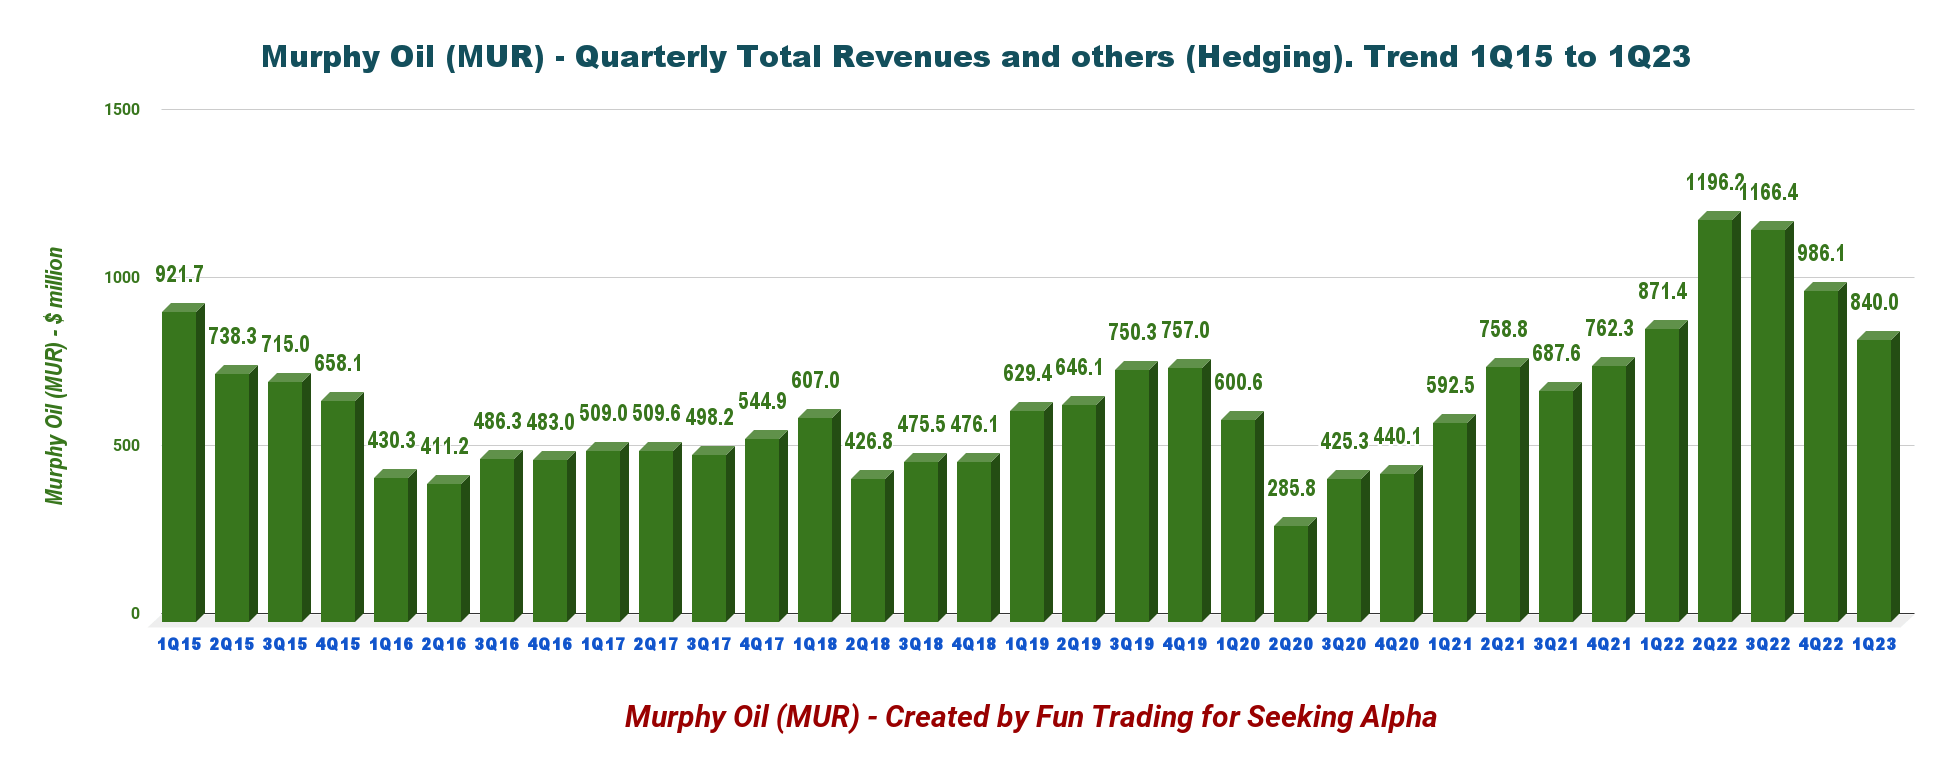
Murphy Oil's revenues of $839.97 million in 1Q23 beat revenue expectations. The revenues decreased slightly from the prior-year quarter’s $871.37 million.
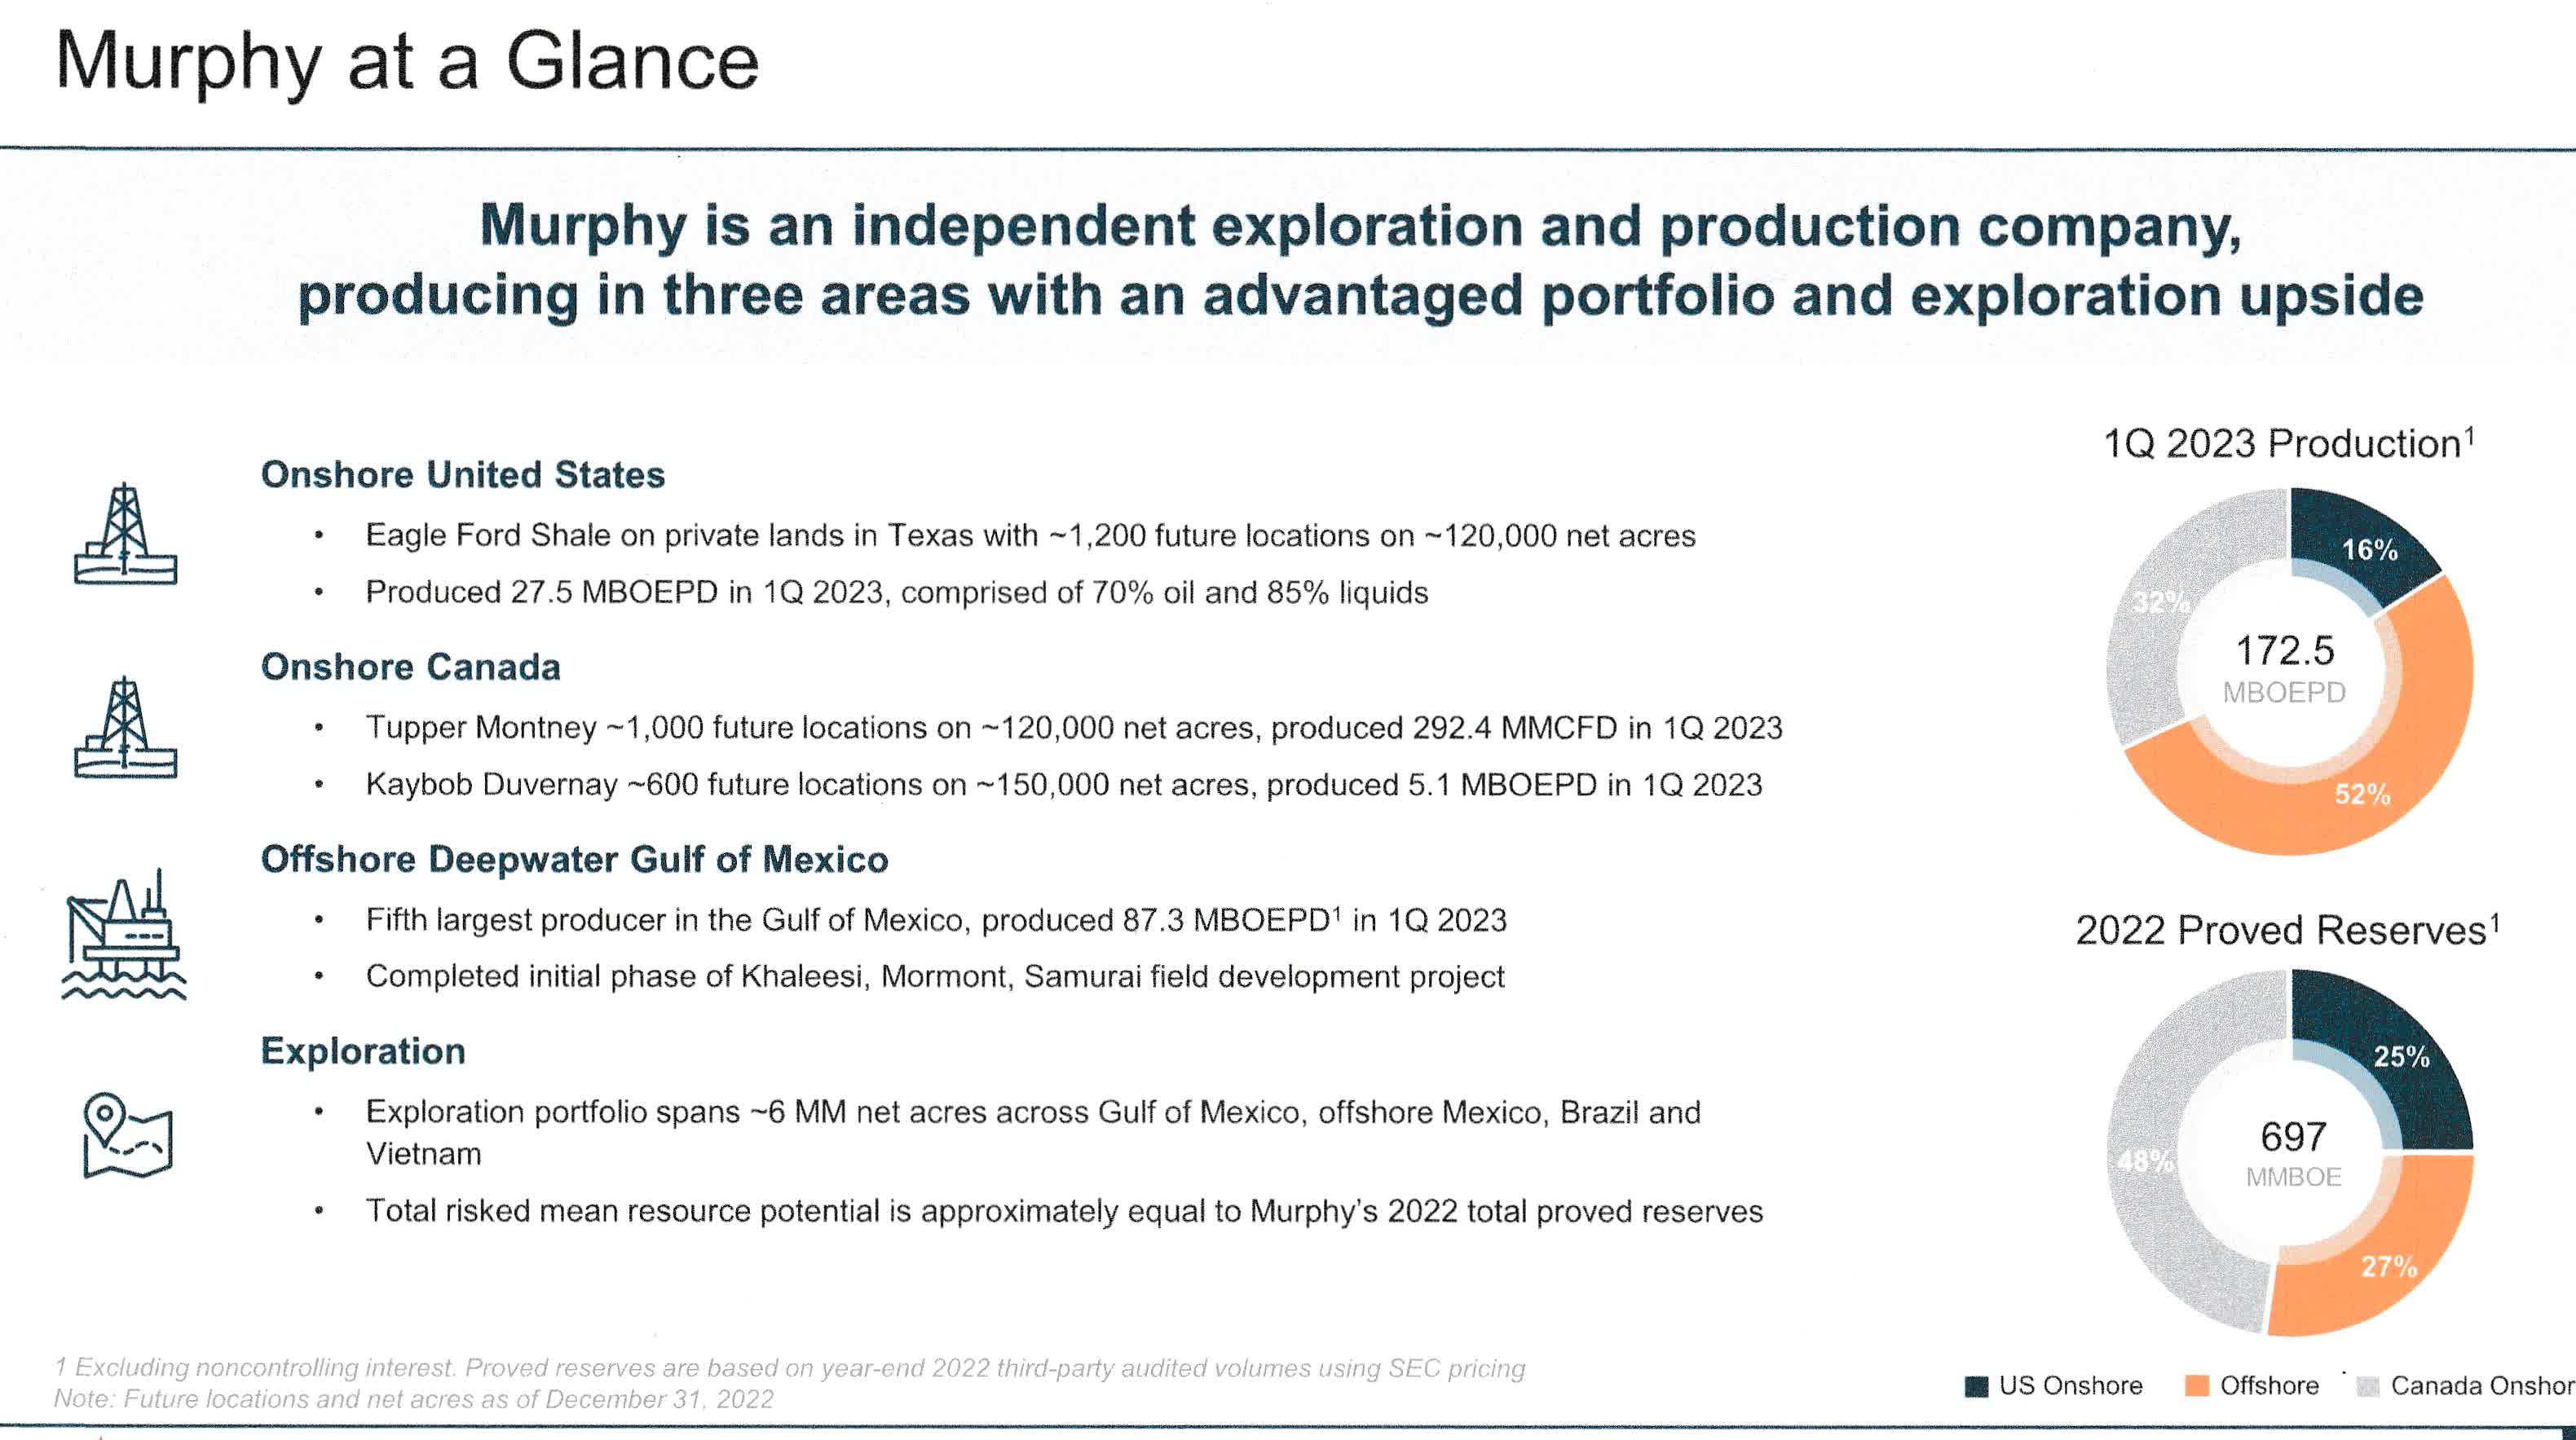
The E&P company produced 172.508K Boep/d in the first quarter (excluding noncontrolling interest in GOM), comprising 60% of liquids.
MUR at a Glance (MUR Presentation)
Murphy Oil’s total costs and expenses were $544.9 million in the first quarter, down 8.4% from $595.1 million in the prior-year quarter. MUR’s first-quarter production surpassed the upper end of expected production volumes in the 161,5K-169K Boep/d range.
Murphy Oil declared a quarterly dividend of $0.275 per share in the first quarter of 2023.
2 - Stock Performance And Commentary
MUR is now up 17% on a one-year basis. The stock is following the general trend in this sector, rebounding from a period of consolidation.
CEO Roger Jenkins said in the conference call:
Our efforts to on maintaining strong well performance and uptime led to Murphy's first quarter production volumes of 172.5 M [ph] barrels equivalent per day exceeding the upper end of our guidance. We executed our onshore well program is planned with 15 operated wells online. In the Gulf of Mexico, our team brought online the Samurai 5 well obtained in the quarter, we've been able and the well is produced above expectations this past month.
MUR is a US/Canada E&P producer with a very low risk attached, paying a dividend yield of about 2.94%.
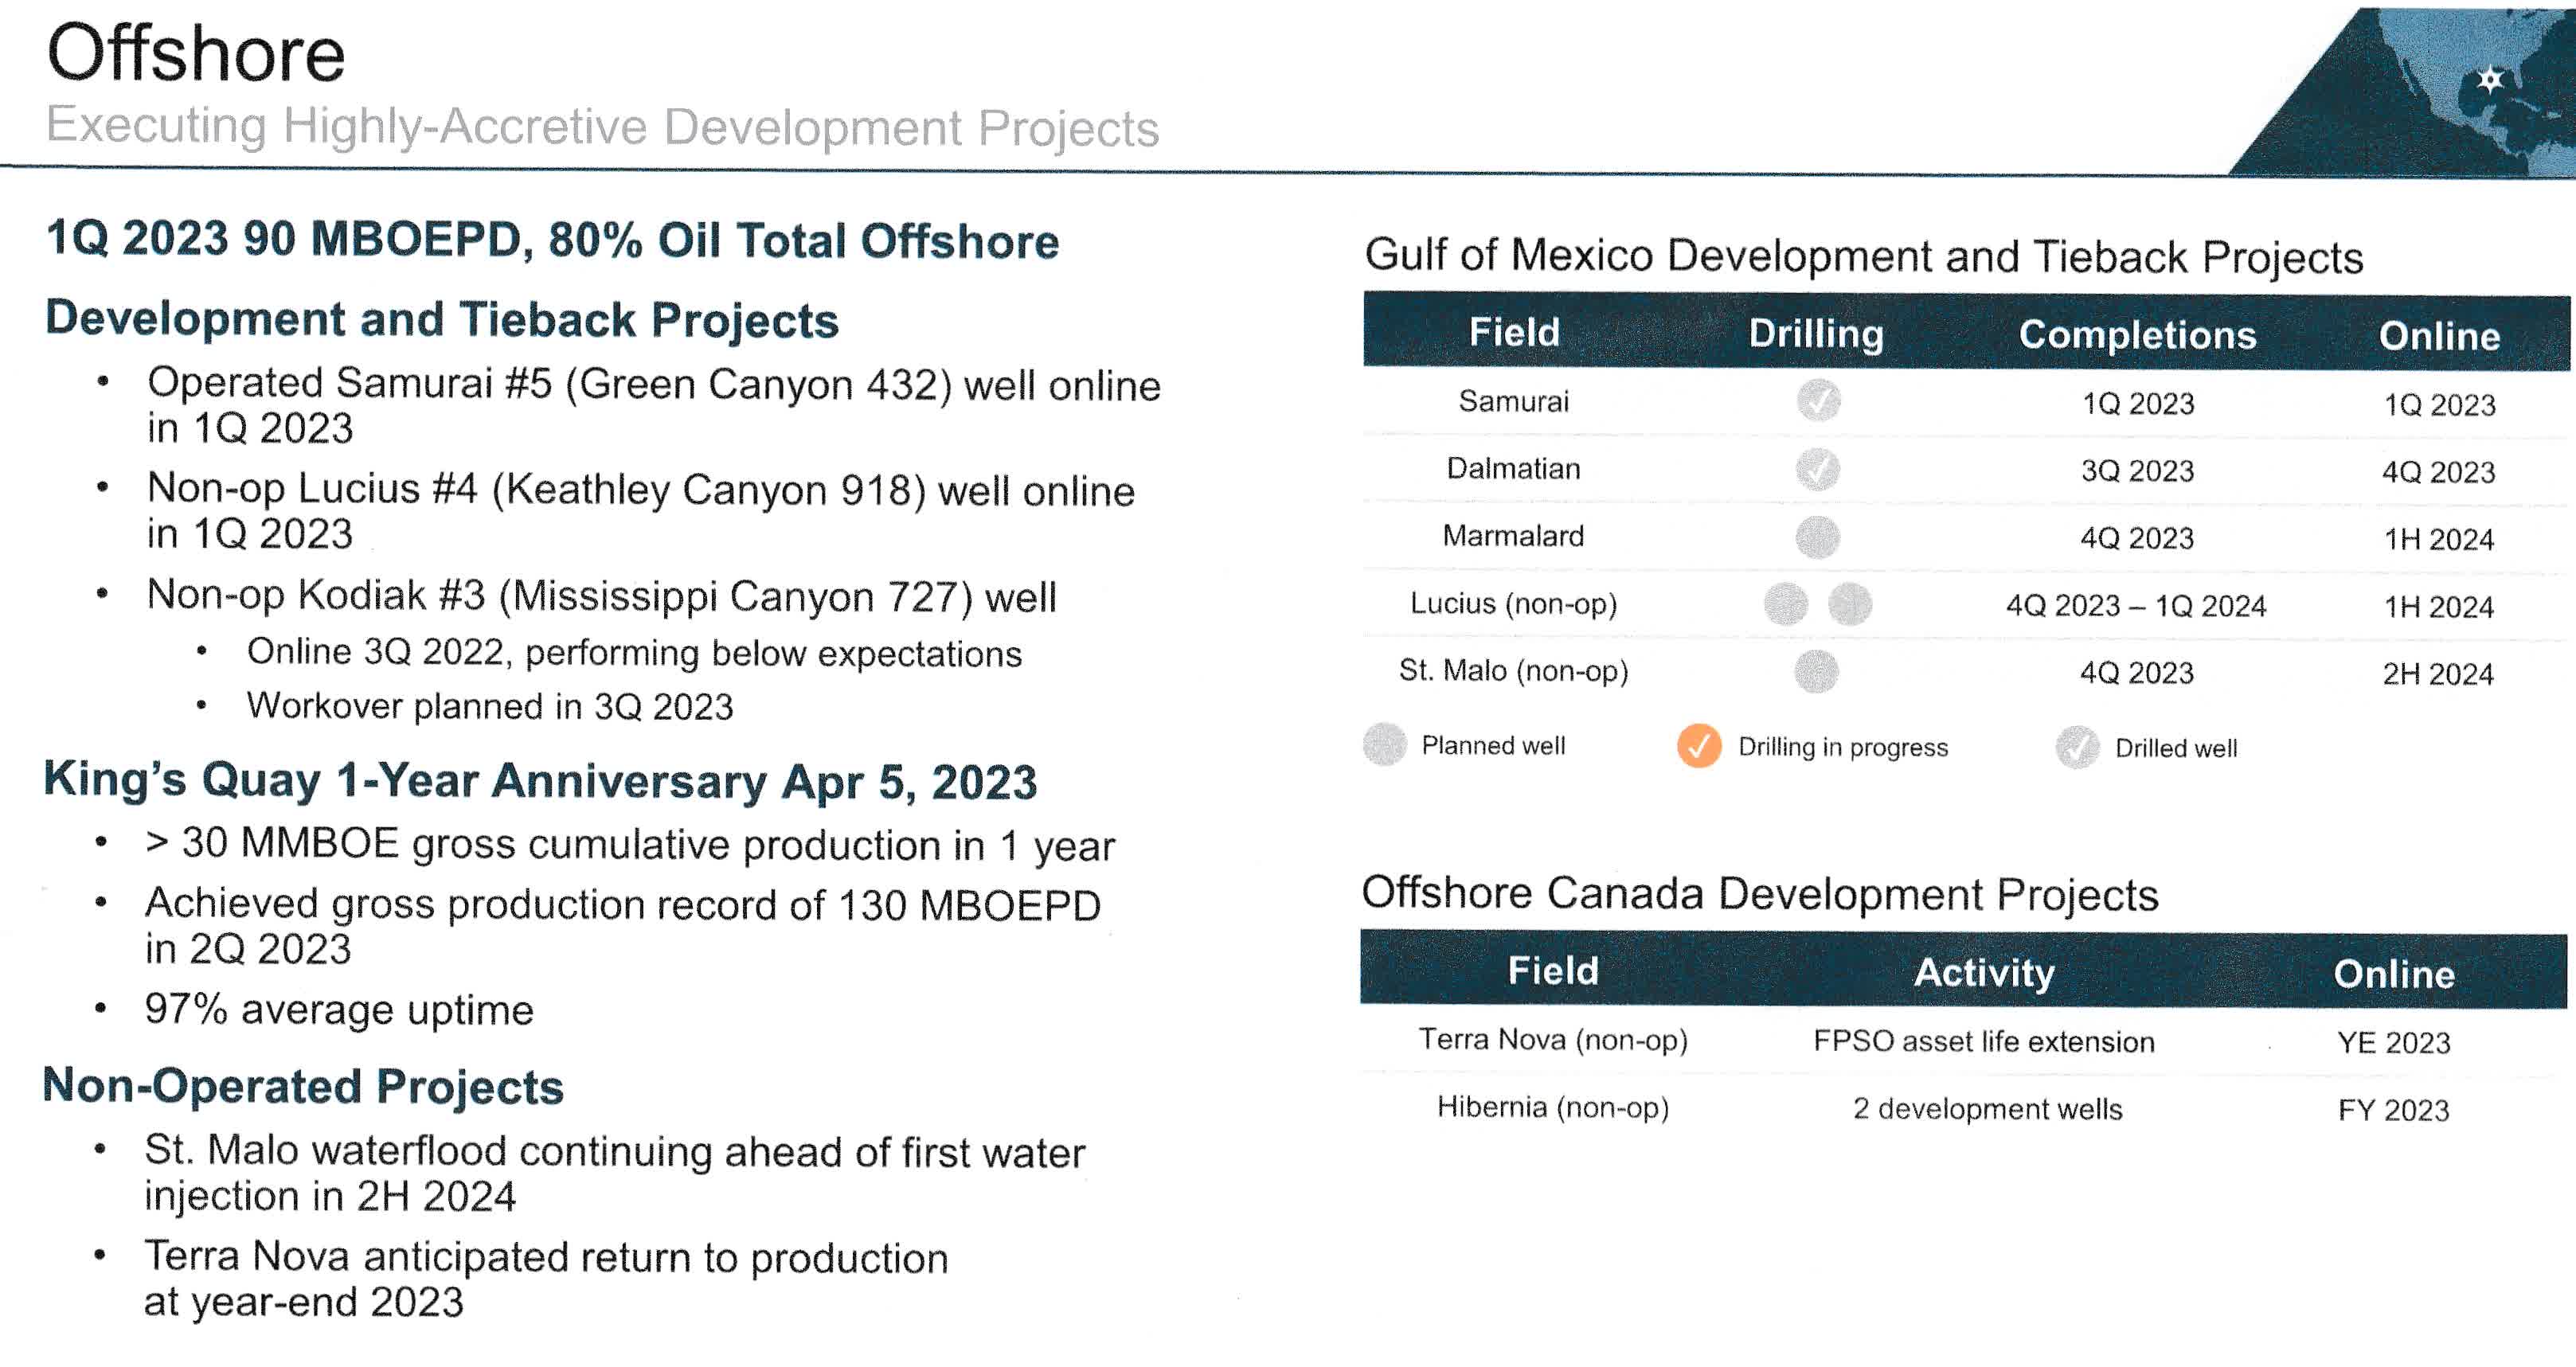
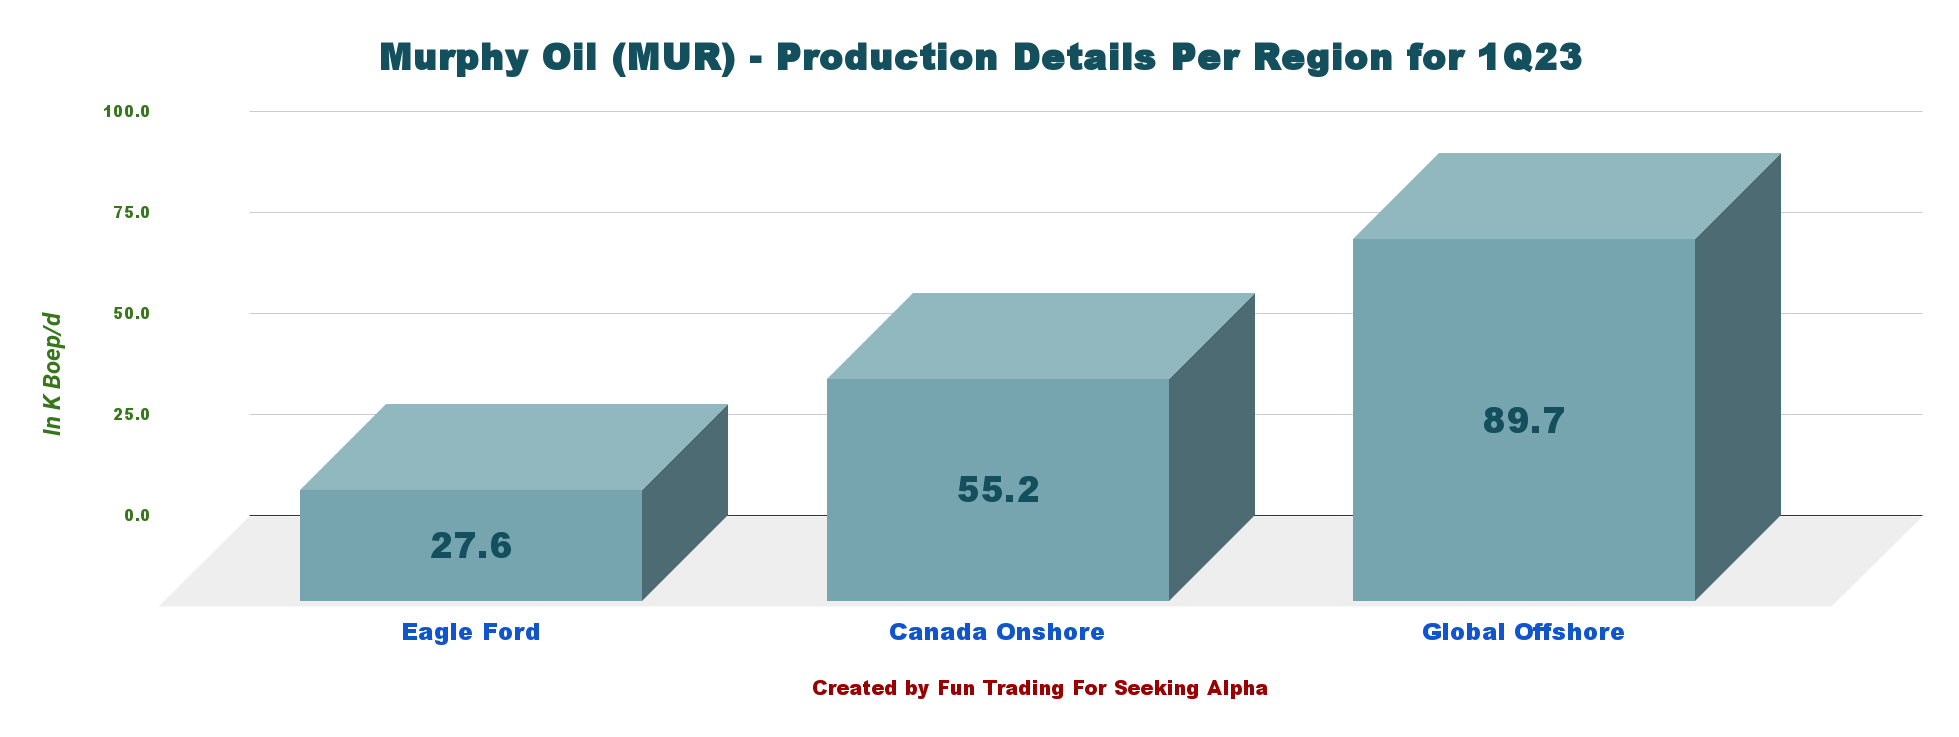
Murphy Oil achieved 89.7K Boep/d in the Gulf of Mexico with 80% oil .
MUR Offshore Gulf of Mexico (MUR Presentation)
Finally, with high oil prices, the company was able to reduce its debt significantly in 2022.
Thus, MUR should be considered a good stock for the long term. However, because of the inherent volatility of the oil and gas sector, I recommend trading short-term LIFO (about 40%) and keeping a medium-core long-term position for a much higher target.
Trading LIFO is the most adapted strategy that allows you to profit while waiting for a significant uptrend. It perfectly adapts to companies like MUR with a solid balance sheet and decent dividends.
Murphy Oil - Financial History Including 1Q23 - The Raw Numbers
| Murphy Oil |
| 1Q22 |
| 2Q22 |
| 3Q22 |
| 4Q22 |
| 1Q23 |
| Total oil and gas revenues in $ Million |
| 871.37 |
| 1,196.24 |
| 1,166.41 |
| 986.12 |
| 839.97 |
| Net income in $ Million |
| -113.34 |
| 350.56 |
| 528.43 |
| 199.40 |
| 191.64 |
| EBITDA $ Million |
| 119.51 |
| 752.77 |
| 985.91 |
| 519.65 |
| 492.39 |
| EPS diluted in $/share |
| -0.73 |
| 2.23 |
| 3.36 |
| 1.26 |
| 1.22 |
| Operating cash flow in $ Million |
| 338.33 |
| 620.91 |
| 704.99 |
| 501.52 |
| 279.78 |
| CapEx in $ Million |
| 244.91 |
| 354.41 |
| 329.28 |
| 185.40 |
| 345.32 |
| Free cash flow in $ Million |
| 93.42 |
| 266.50 |
| 392.33 |
| 316.12 |
| -65.54 |
| Total cash $ Billion |
| 0.48 |
| 0.43 |
| 0.47 |
| 0.49 |
| 0.31 |
| Long-term debt (including current) in $ Billion |
| 2.47 |
| 2.27 |
| 2.02 |
| 1.82 |
| 1.82 |
| Dividend per share in $ |
| 0.175 |
| 0.25 |
| 0.25 |
| 0.275 |
| 0.275 |
| Shares outstanding (diluted) in Million |
| 154.92 |
| 157.46 |
| 157.34 |
| 157.68 |
| 157.39 |
| Oil Production |
| 1Q22 |
| 2Q22 |
| 3Q22 |
| 4Q22 |
| 1Q23 |
| Oil Equivalent Production in K Boe/d NET |
| 141.0 |
| 164.4 |
| 188.5 |
| 173.59 |
| 172.51 |
| US Onshore Crude oil price ($/b) |
| 93.87 |
| 109.25 |
| 93.65 |
| 83.06 |
| 74.98 |
Source: Murphy Oil press release .
Analysis: Revenues, Earnings Details, Free Cash Flow, Debt, And Oil & Gas Production
1 - Total Revenue was $839.97 Million In 1Q23
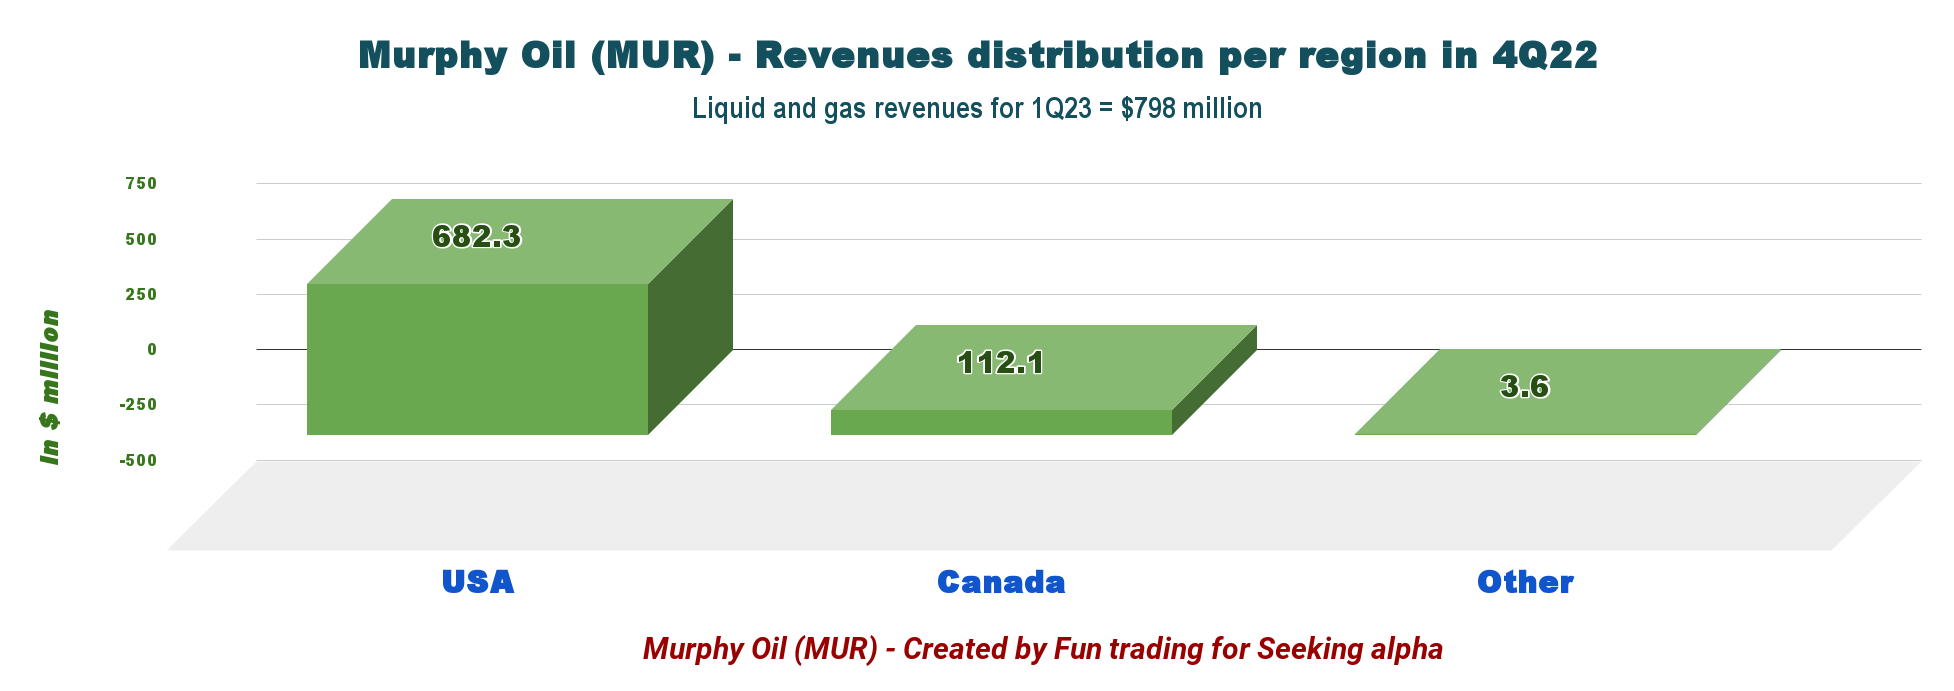
MUR Quarterly Revenues History (Fun Trading) Note: Revenues from oil and gas production were $796.231 million. MUR 1Q23 Revenue per Segment (Fun Trading)
Murphy Oil reported a net income of $191.64 million , or $ 1.22 per diluted share, for the first quarter of 2023. This compares to a loss of $113.34 million or $0.73 per share a year ago.
The net cash provided by continuing operations activities in 1Q23 was $279.78 million, compared with $338.33 million in 1Q22.
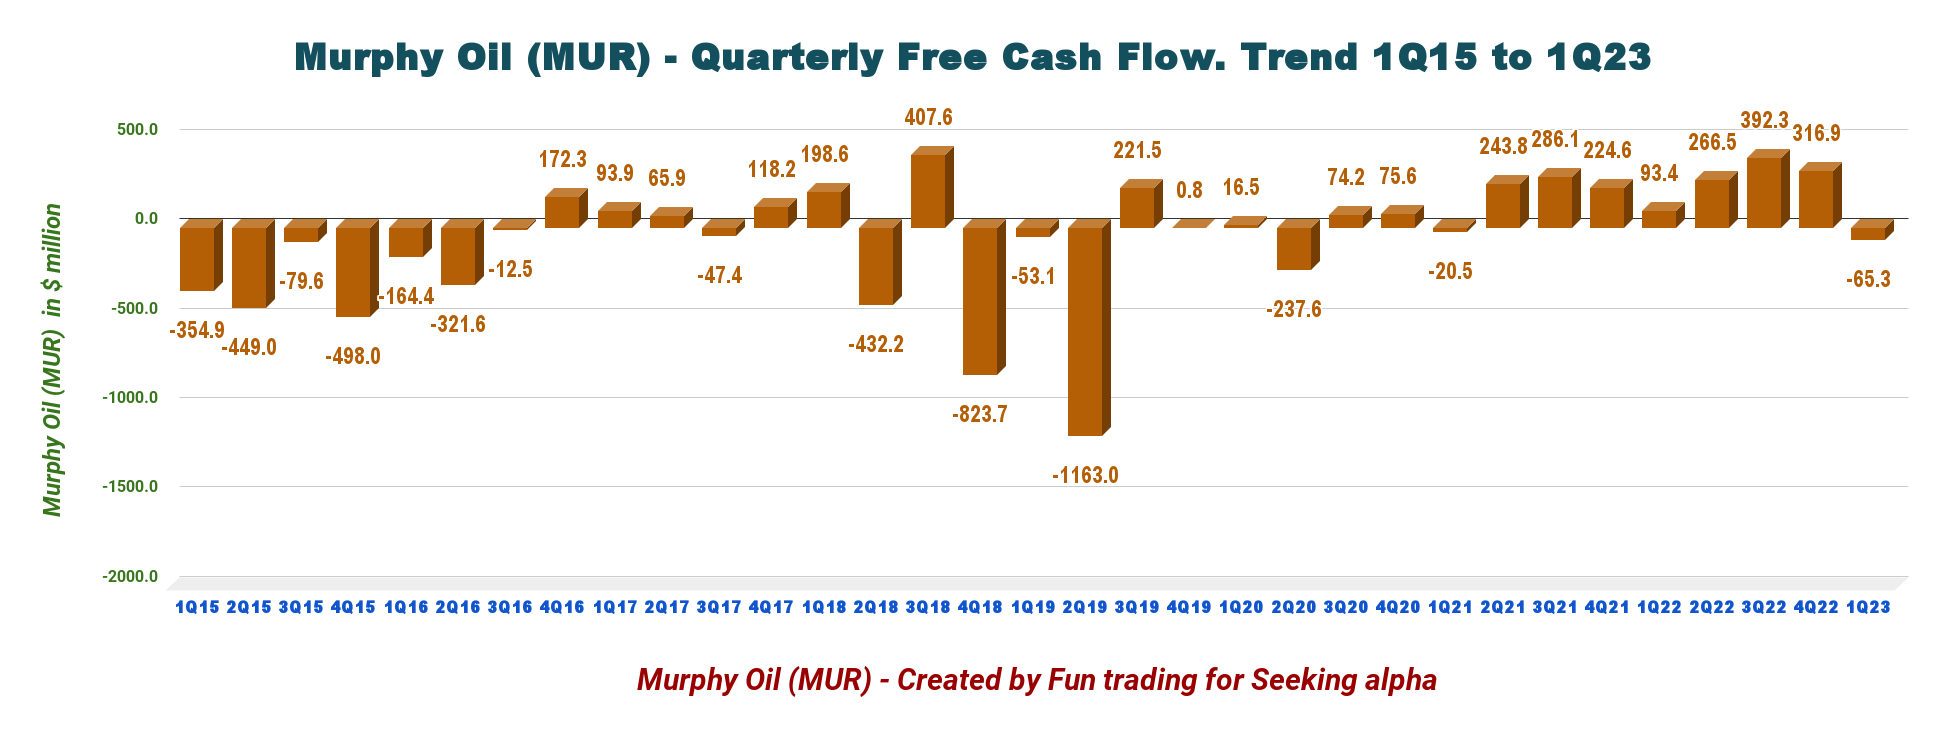
2 - Free Cash Flow was a loss of $65.54 Million in 1Q23
MUR Quarterly Free Cash Flow History (Fun Trading) Note: The generic free cash flow is cash from operating activities minus CapEx. The company has a different calculation, including divestiture.
The generic free cash flow was a $65.54 million loss in 1Q23. The trailing 12-month free cash flow is $892.78 million.
The company now pays a quarterly dividend of $0.275 per share .
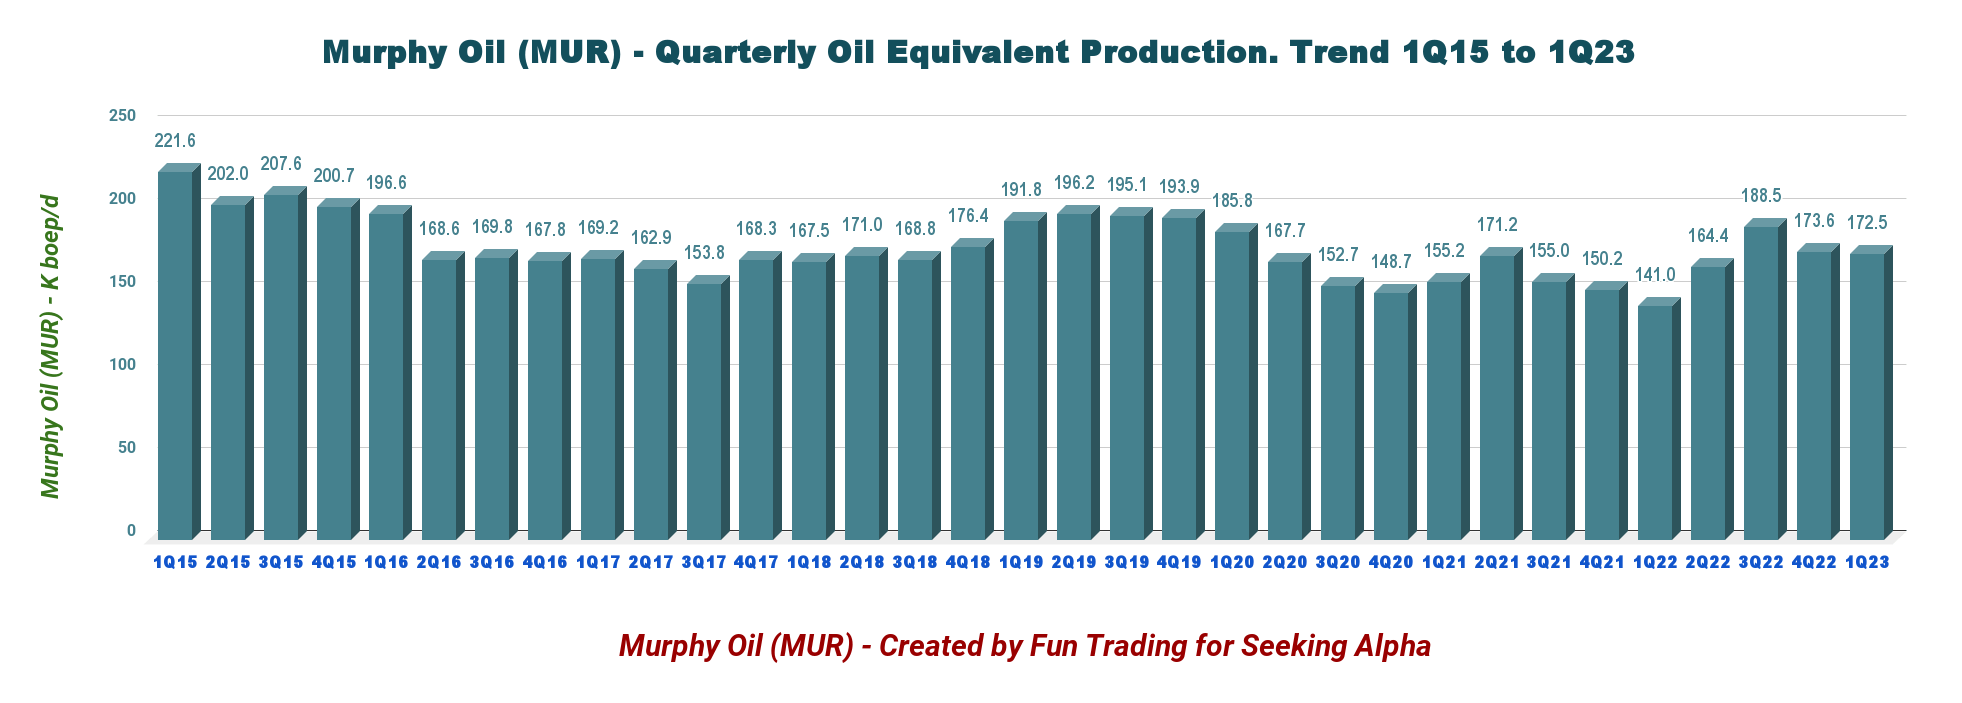
3 - Production was a Total of 172.508k Boep/d in 1Q23 net
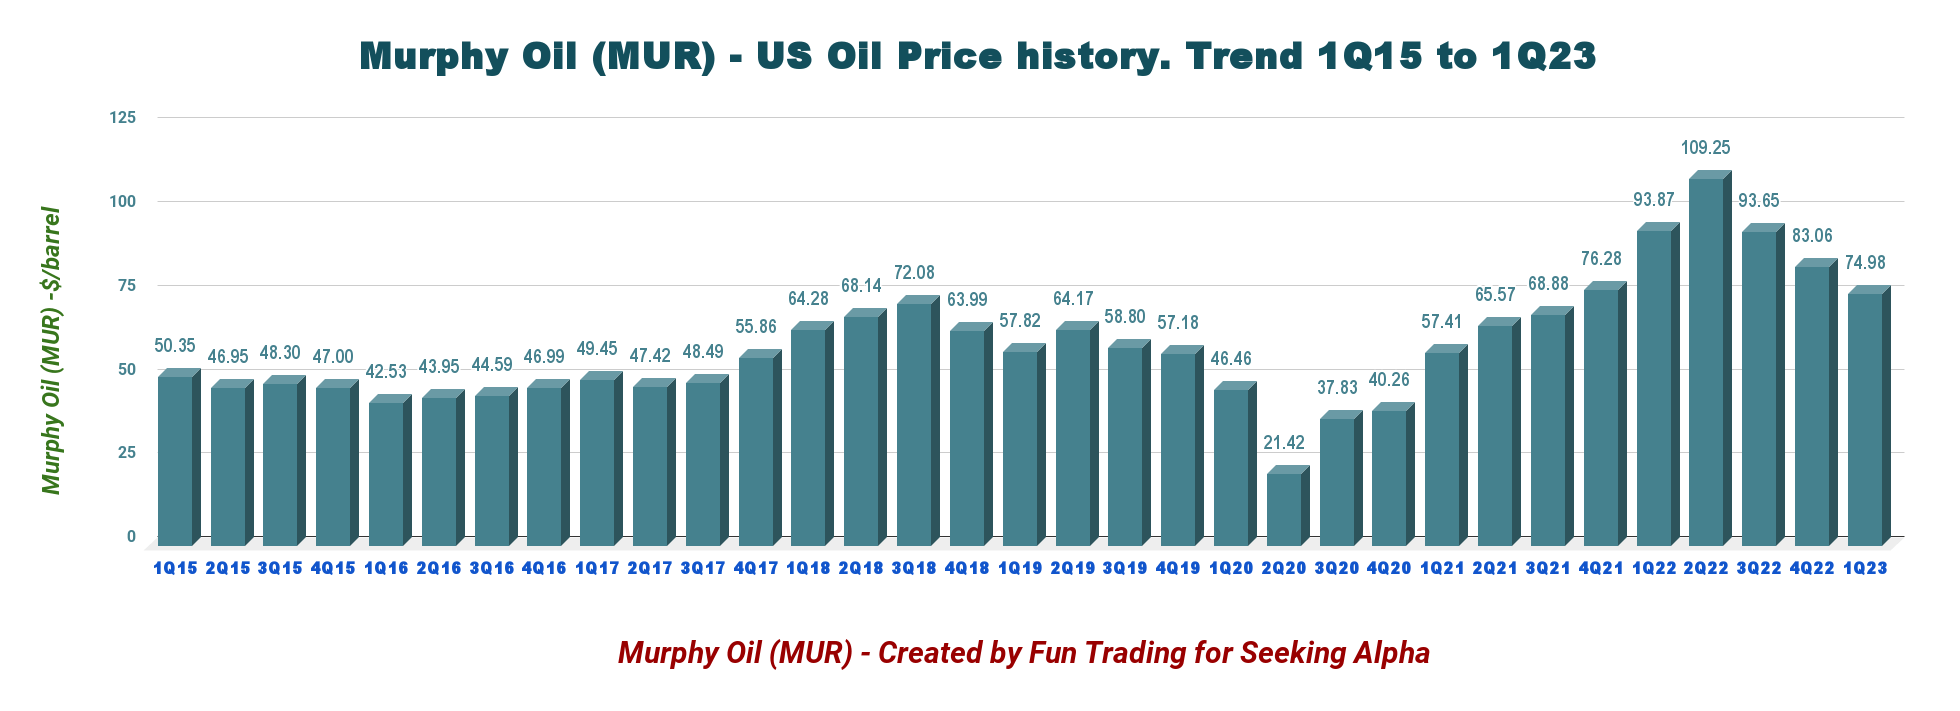
MUR Quarterly Production History (Fun Trading) The company produced 172.508K Boep/d in the first quarter, comprising 60% of liquids. The offshore section, mainly the Gulf of Mexico, represents 52% of the total output 1Q23. MUR 1Q23 Production per Region (Fun Trading) Onshore U.S. oil prices were $74.98 a barrel in 1Q23, down significantly from the $93.87 realized last year. MUR Quarterly Production History (Fun Trading) Below is how the equivalent production is spread between oil, NGL, and natural gas. Liquids represented 61.2% of the total output. Highlights for the first quarter: (press release)
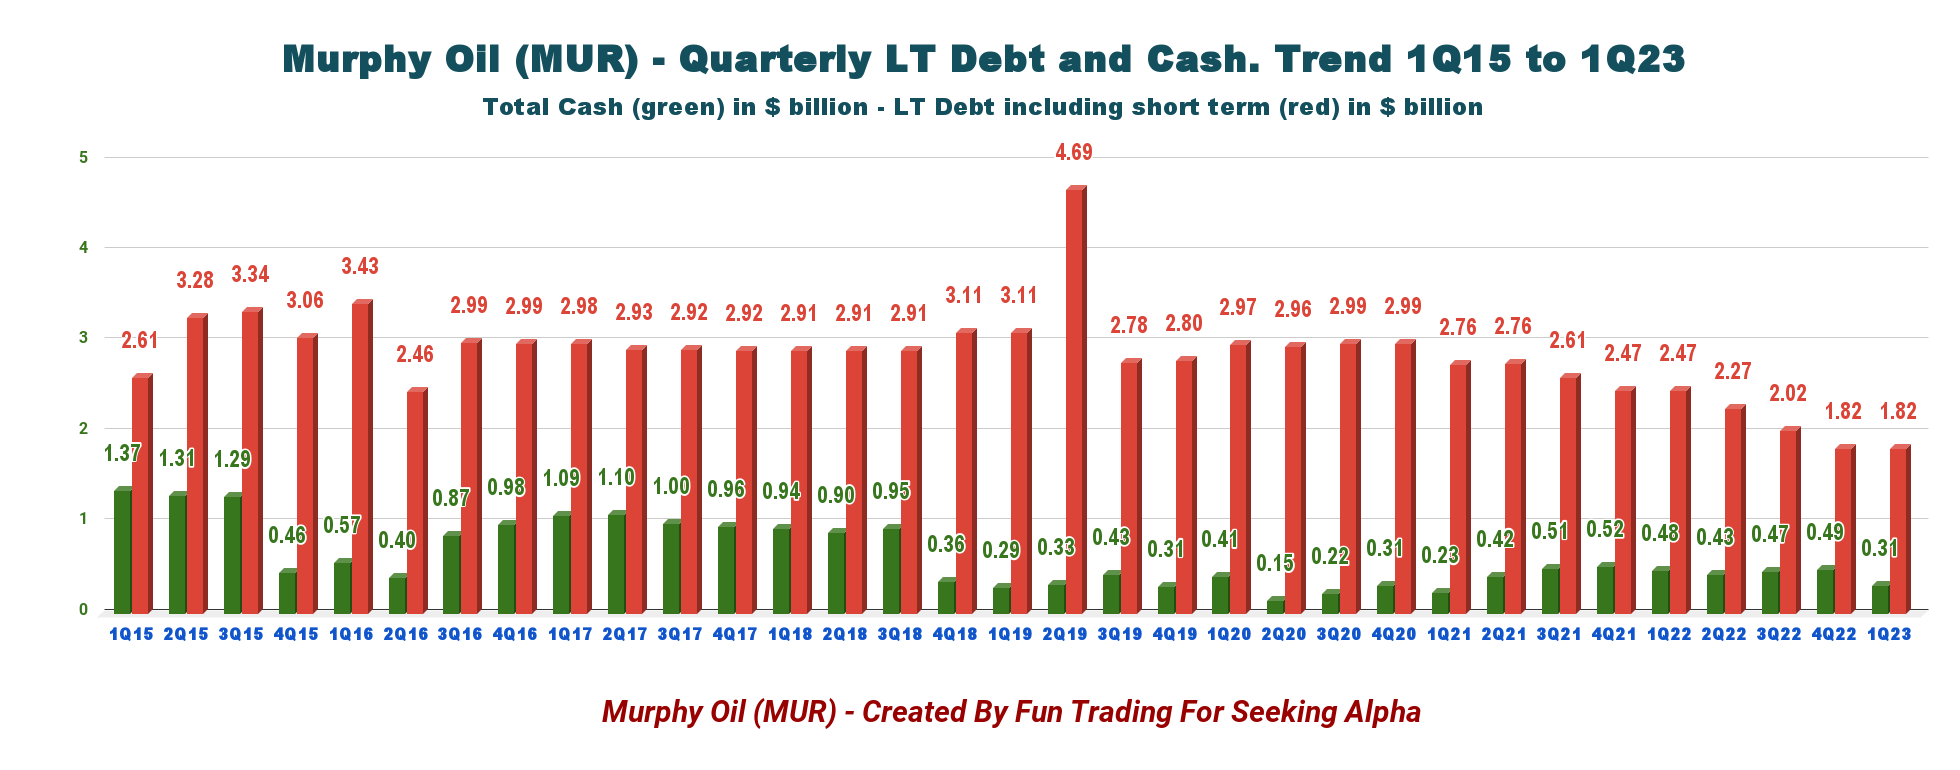
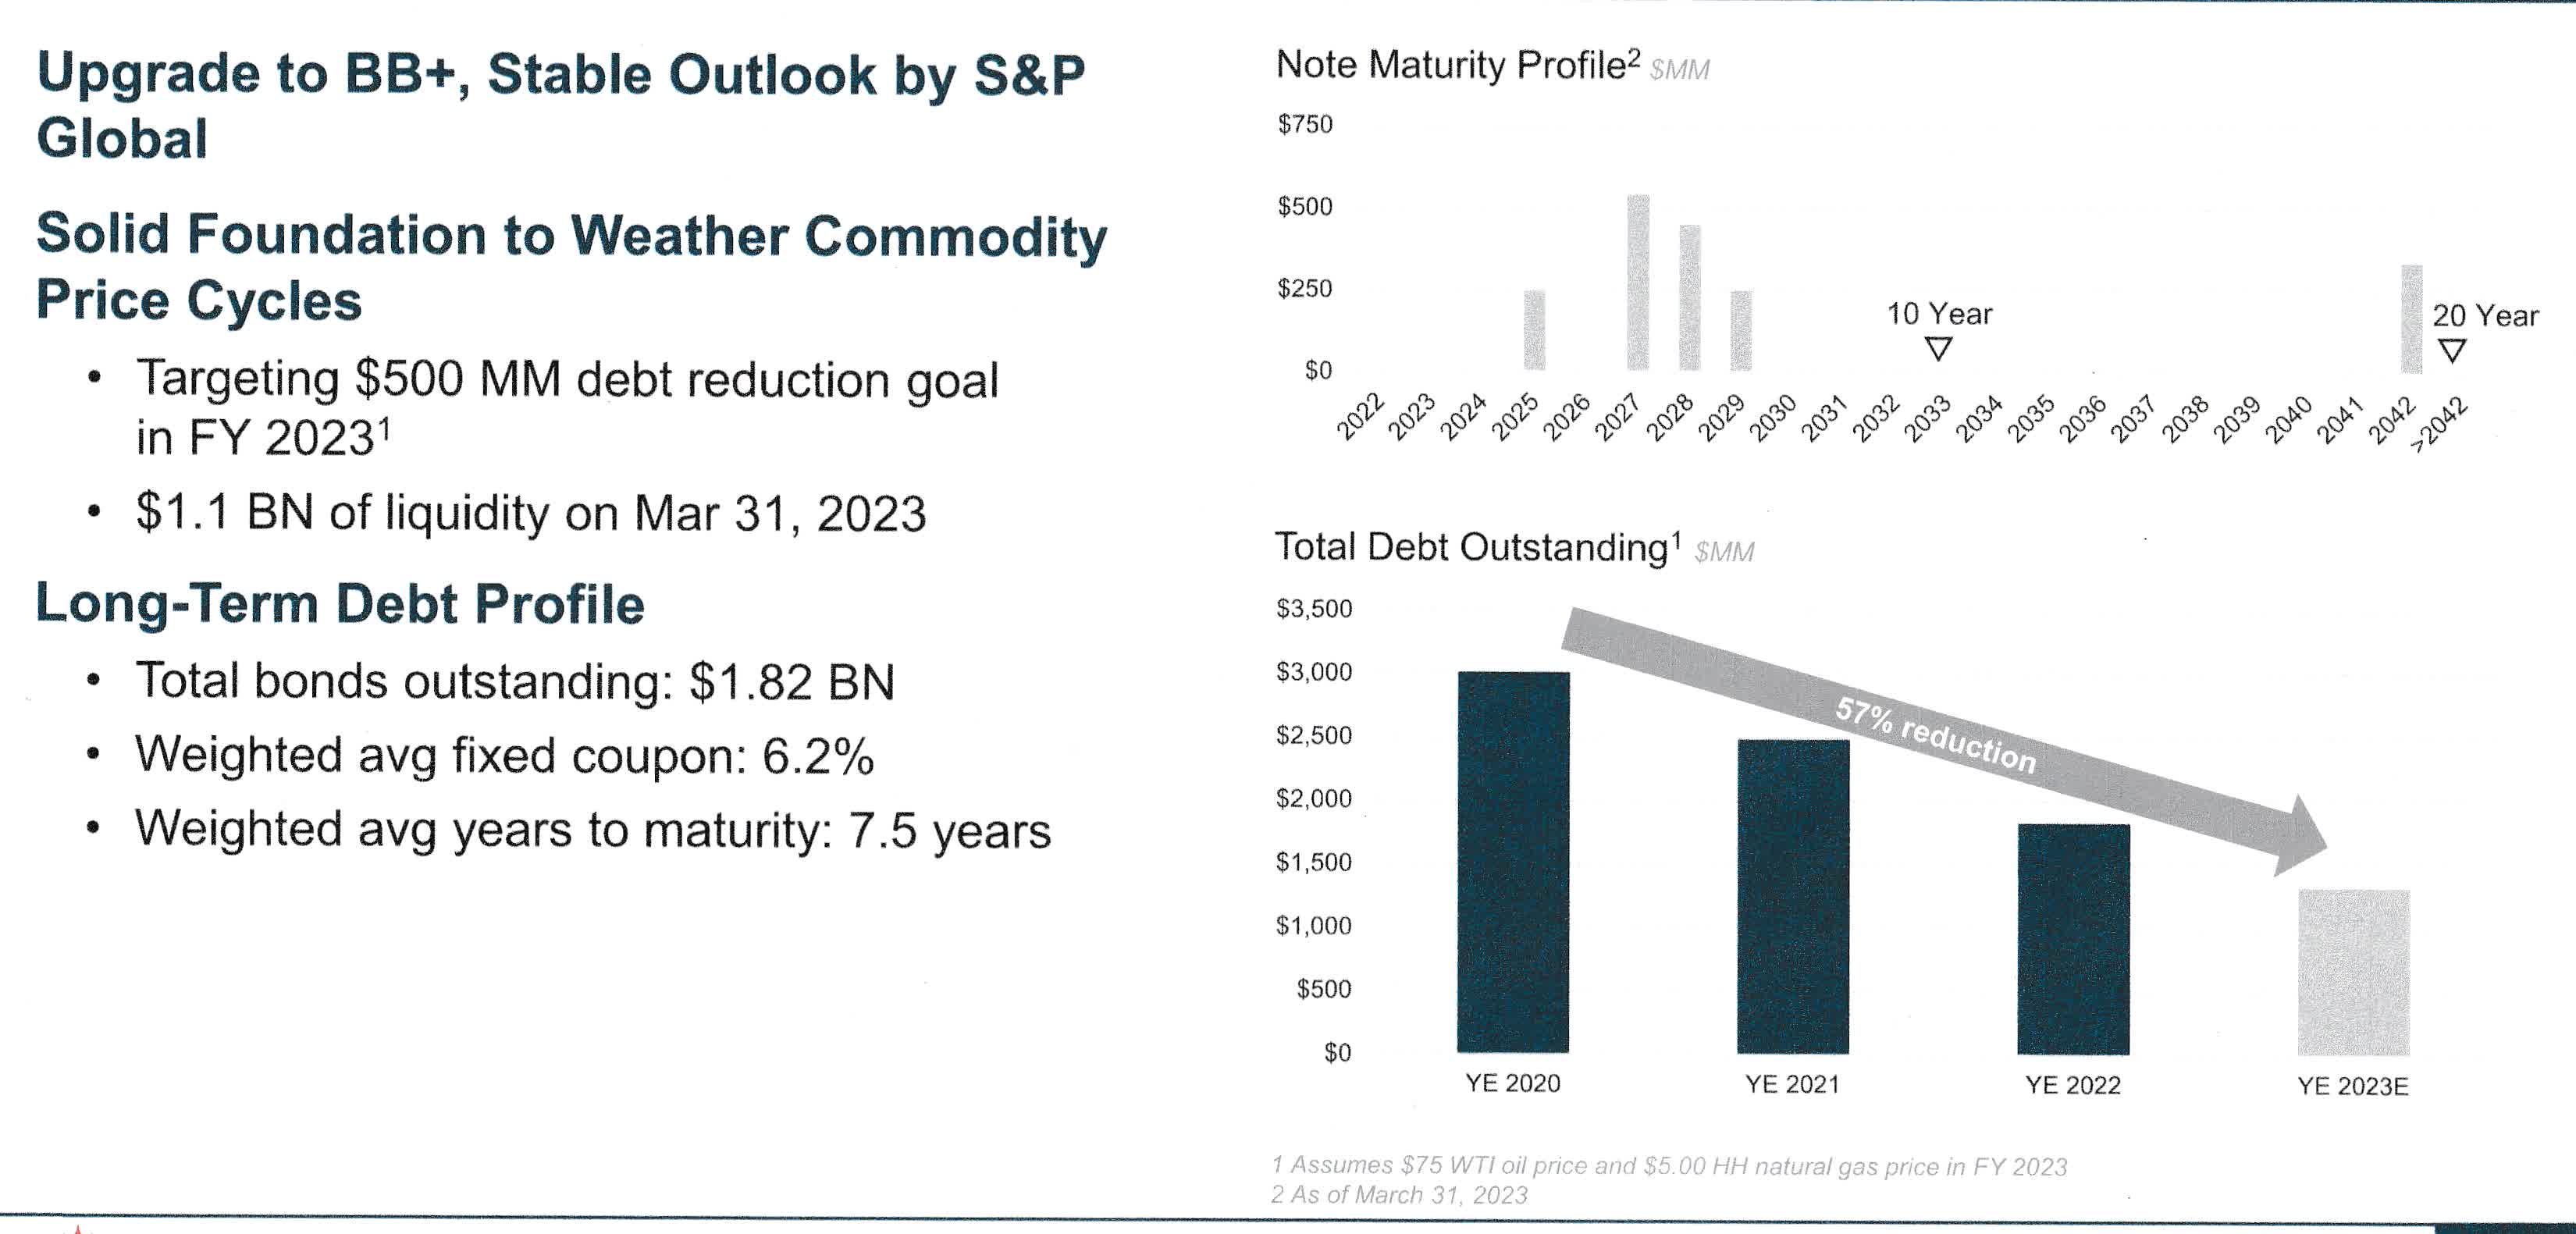
4 - Net Debt - Good progress here.
Murphy Oil had cash and cash equivalents of $312.383 million as of March 31, 2023, compared with $480.59 million as of March 31, 2022.
MUR Quarterly Cash versus Debt History (Fun Trading) Net debt was $1.51 billion at the end of March 2023. The Debt is an unsecured senior credit facility, not subject to semi-annual borrowing base redetermination. Murphy had approximately $1.1 billion of liquidity on March 31, 2023, with no borrowings on the $800 million credit facility. MUR Balance Sheet (MUR Presentation)
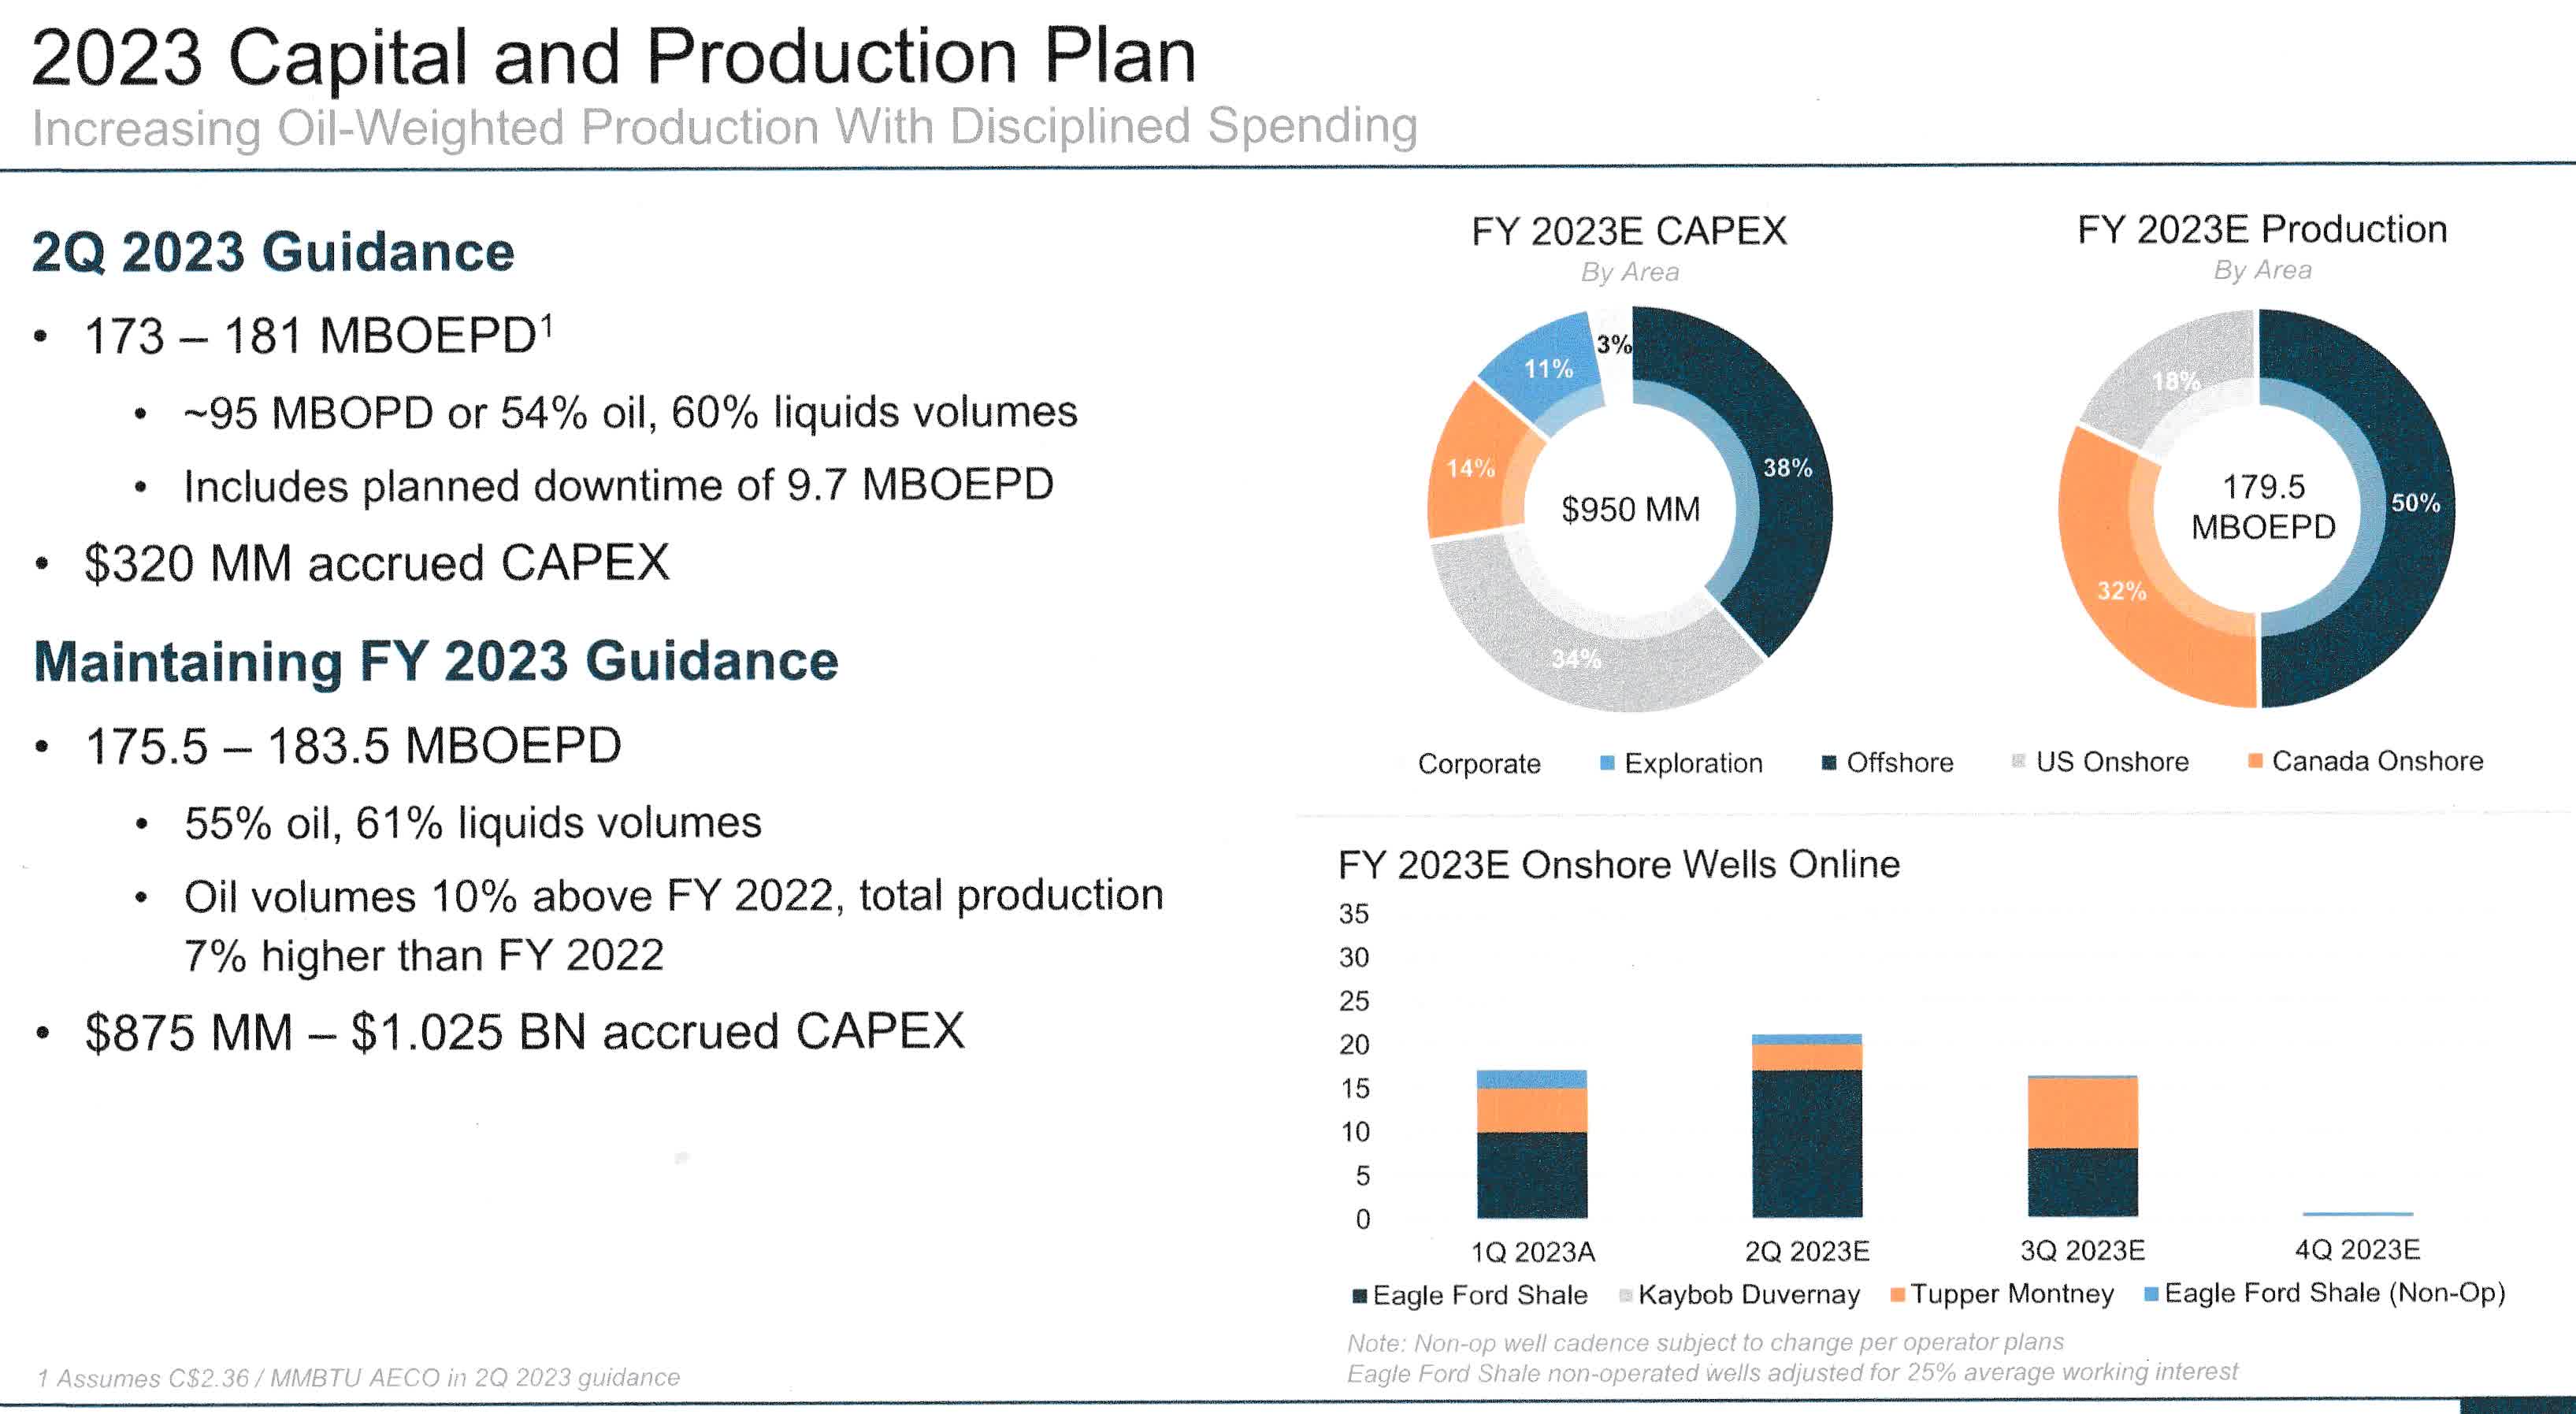
5 - 2Q23 Guidance
MUR expects its production to be 173k-181k Boep/d in 2Q23 , significantly higher than indicated in the preceding quarter.
Full-year CapEx is between ~$950 million.
MUR expects 2023 production volumes between 179.5K Boep/d and 183.5K Boep/d. Murphy Oil targets further debt reduction of $500 million in 2023.
MUR CapEx and Production 2Q23 (MUR Presentation)
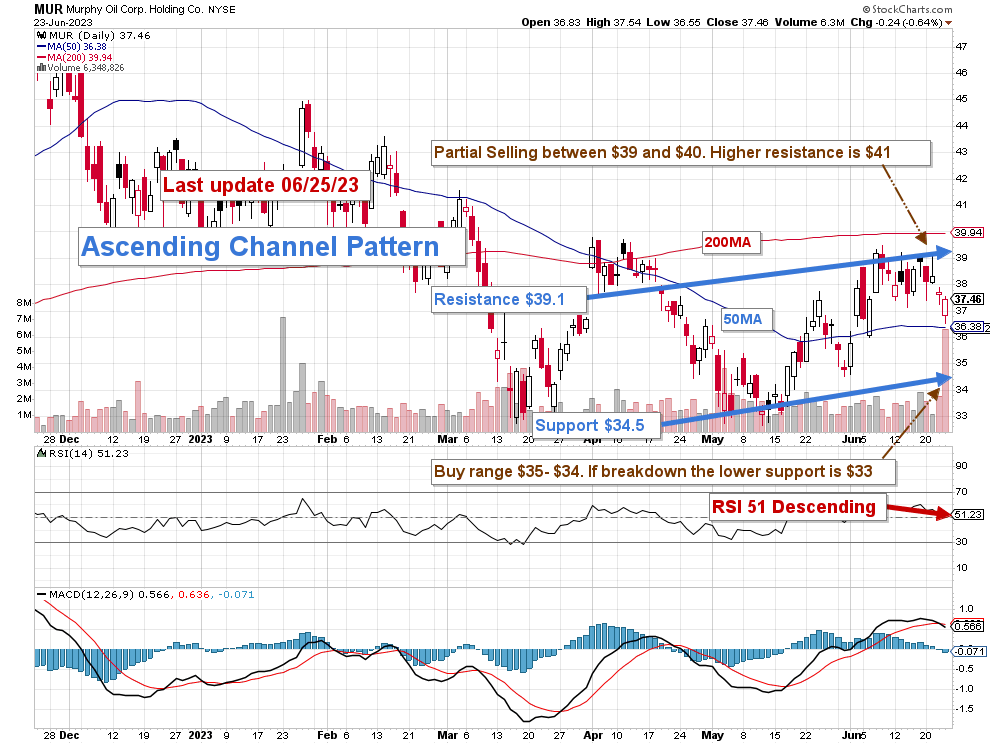
Technical Analysis (Short Term) And Commentary
MUR TA Chart Short-term (Fun Trading StockCharts)
Note: The chart is adjusted for the dividend.
MUR forms an ascending channel pattern with resistance at $39.1 and support at $34.5 . Ascending channel patterns are short-term bullish, but these patterns often form within longer-term downtrends as continuation patterns.
The economy is weakening, and many analysts expect a recession late in 2023 which is not a good sign for oil demand. Furthermore, China expected recovery is faltering.
Several major banks have cut their 2023 gross domestic product ((GDP)) growth forecasts for China after May data showed a post-COVID recovery was faltering in the world's second-largest economy.
As I said in my preceding article, we cannot ignore those early signs, and we must protect our MUR investment by adopting a strategy that takes the "best of both worlds." I encourage it in my marketplace, "The Gold and Oil Corner."
The trading strategy is to sell LIFO about 50% of your position between $39 and $40, with possible higher resistance at $41. Conversely, I suggest accumulating between $34 and $35, with potential lower support at $33.
Warning: The TA chart must be updated frequently to be relevant. It is what I am doing in my stock tracker. The chart above has a possible validity of about a week. Remember, the TA chart is a tool only to help you adopt the right strategy. It is not a way to foresee the future. No one and nothing can.
For further details see:
Murphy Oil: A Small But Solid Domestic E&P Company