MUR - Murphy Oil: Adding Risk By Expanding In West Africa
2023-09-10 04:51:25 ET
Summary
- Murphy Oil Corporation released its second-quarter 2023 results, beating analysts' expectations with adjusted net income of $0.79 per diluted share.
- Revenues for the quarter decreased slightly from the prior year but still exceeded expectations.
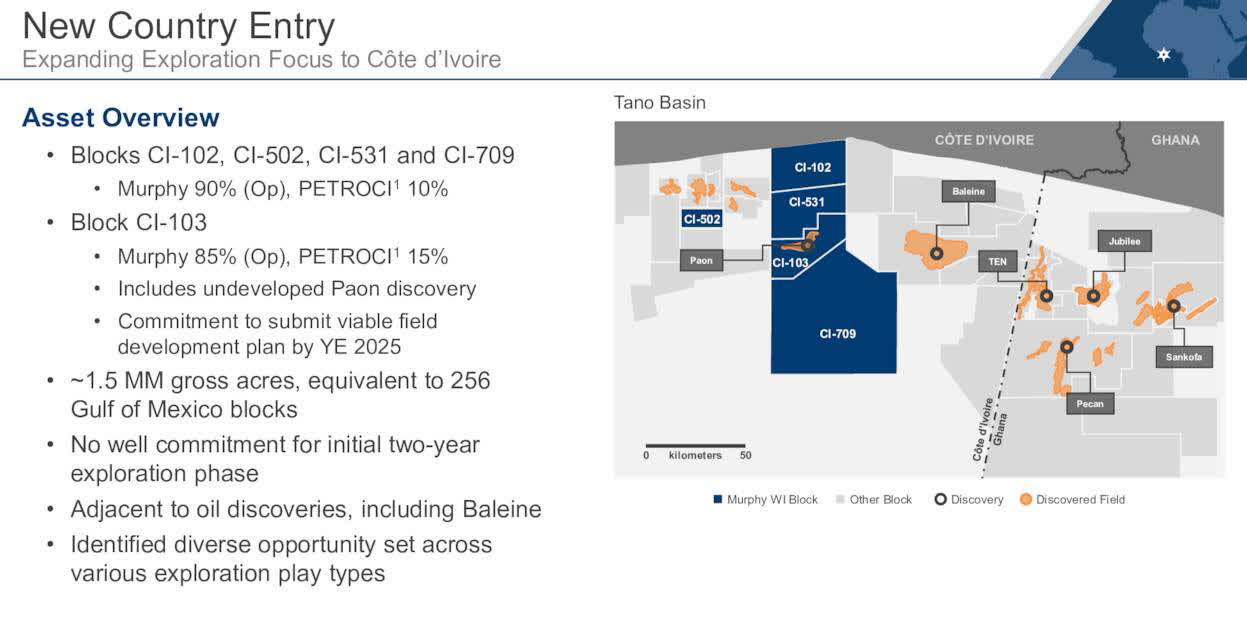
- MUR is expanding in Ivory Coast, West Africa.
- I recommend buying MUR between $45.3 and $44.5, with potential lower support at $42.3.
Introduction
Murphy Oil Corporation ( MUR ) is an independent global oil and natural gas exploration and production company I have followed on Seeking Alpha since October 2017.
The company released its second-quarter 2023 results on August 3, 2023. Company presentation can be accessed by clicking here.
Note: This article updates my preceding article, published on June 26, 2023.
1 - 2Q23 Results Snapshot
The company posted a second-quarter 2023 adjusted net income, excluding discontinued operations and other one-off items, of $0.79 per diluted share, beating analysts' expectations. It compares to $1.93 last year, or a decline of 59.1%.
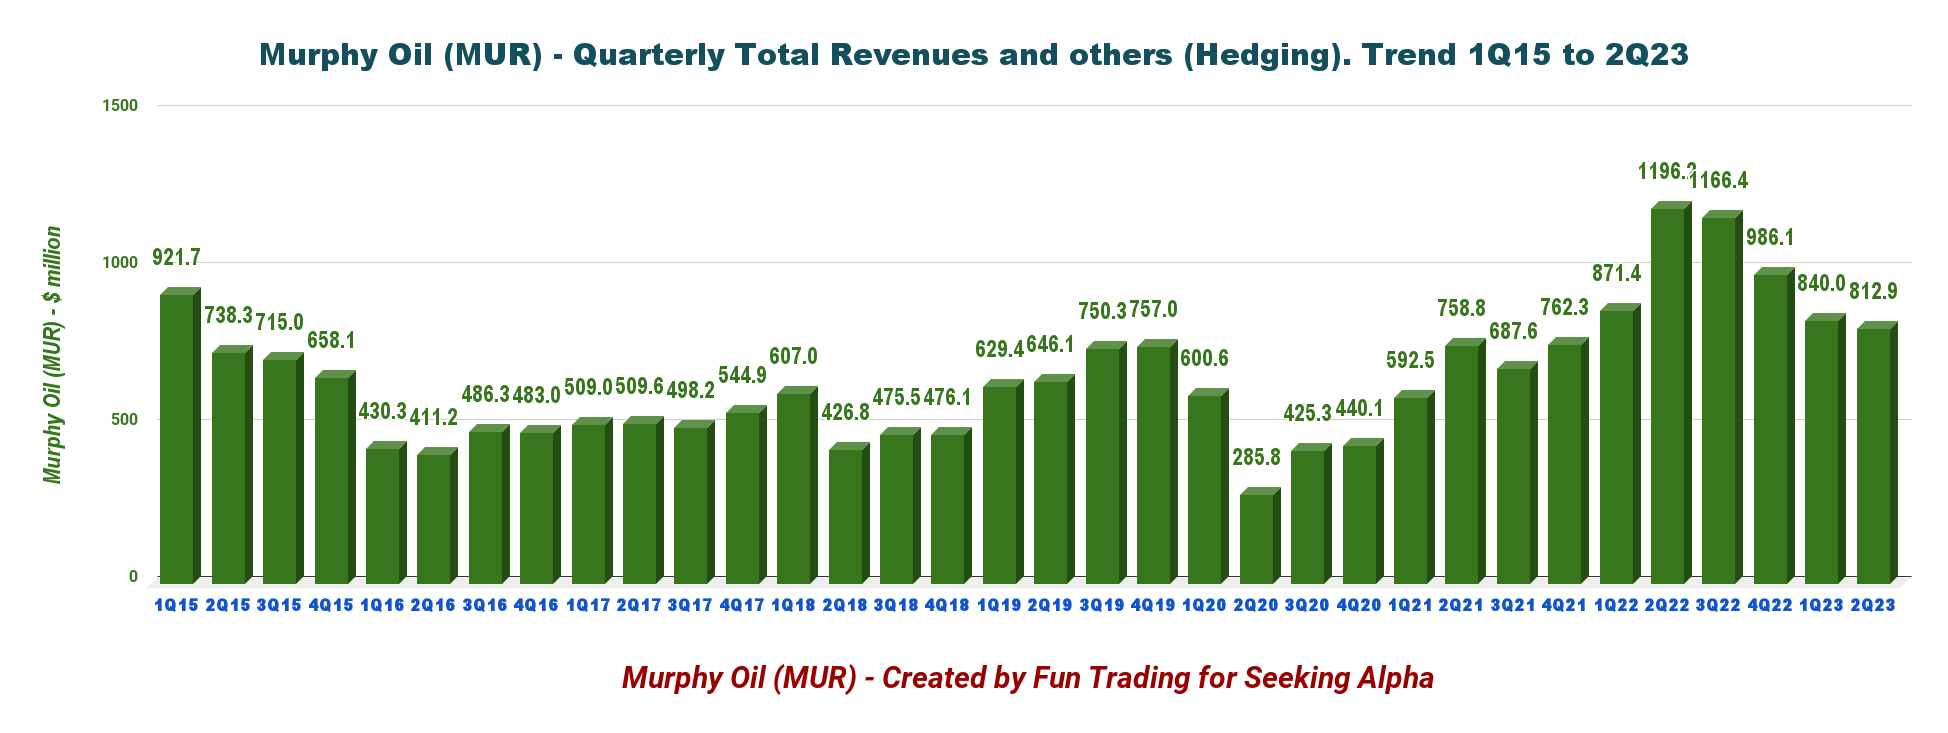
Murphy Oil's revenues of $812.85 million in 2Q23 beat revenue expectations. The revenues decreased slightly from the prior-year quarter's $1,196.24 million.
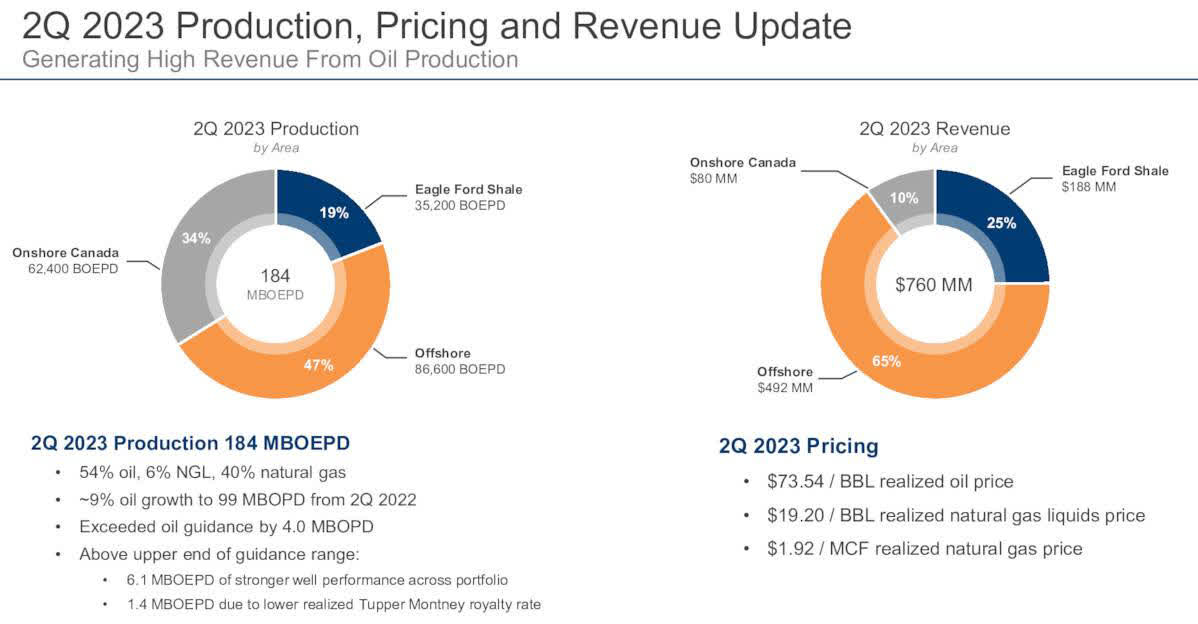
The E&P company produced 184.25K Boepd Net in the second quarter (excluding noncontrolling interest in GOM), comprising 60% of liquids, compared with 164,376 Boepd in the second quarter of 2022.
Murphy Oil's total costs and expenses were $649.7 million in the second quarter, up 18.2% from $549.5 million in the prior year quarter.
MUR's second-quarter production exceeded the upper end of expected production volumes in the 173K-181K Boepd range . Higher second-quarter production was due to a strong performance from Tupper Montney, Eagle Ford Shale, and the Gulf of Mexico.
Murphy Oil declared a quarterly dividend of $0.275 per share in the second quarter of 2023.
2 - Stock Performance And Commentary
MUR is now up 20% on a one-year basis. The stock is following the general trend in this sector, rebounding from a period of consolidation between April and July 2023.
CEO Roger Jenkins said in the conference call:
we recently expanded our exploration focus by signing production sharing contracts to secure working interest as operator in five exploration blocks for new country entry into Cote d'Ivoire.
We'll initially hold 85% to 90% working interest with PETROCI holding the remaining working interest in each block. It's important to note we have no well commitments in the initial two-year exploration phase, which provides us the time to conduct proper geophysical studies over the blocks.
MUR is a US/Canada E&P producer with a very low risk attached, paying a dividend yield of about 2.48%.
Murphy Oil achieved 86.6K Boepd in the Gulf of Mexico with 80% oil .
Recently, Goldman Sachs revised its global oil demand forecast.
Goldman Sachs on Sunday revised up its global oil demand forecast for the year while sticking to its 12-month Brent price projection of $93 per barrel as higher realized inventories offset the demand boost from a less pessimistic growth outlook.
Thus, MUR should be considered a good opportunity for the long term. However, because of the inherent volatility of the oil and gas sector, I recommend trading short-term LIFO (about 40%) and keeping a medium-core long-term position for a much higher target.
Trading LIFO is the most adapted strategy that allows you to profit while waiting for a significant uptrend. It perfectly adapts to companies like MUR with a solid balance sheet and decent dividends.
Murphy Oil - Financial History Including 2Q23 - The Raw Numbers
| Murphy Oil |
| 2Q22 |
| 3Q22 |
| 4Q22 |
| 1Q23 |
| 2Q23 |
| Total oil and gas revenues in $ Million |
| 1,196.24 |
| 1,166.41 |
| 986.12 |
| 839.97 |
| 812.85 |
| Net income in $ Million |
| 350.56 |
| 528.43 |
| 199.40 |
| 191.64 |
| 98.29 |
| EBITDA $ Million |
| 752.77 |
| 985.91 |
| 519.65 |
| 492.39 |
| 372.85 |
| EPS diluted in $/share |
| 2.23 |
| 3.36 |
| 1.26 |
| 1.22 |
| 0.62 |
| Operating cash flow in $ Million |
| 620.91 |
| 704.99 |
| 501.52 |
| 279.78 |
| 469.89 |
| CapEx in $ Million |
| 354.41 |
| 329.28 |
| 185.40 |
| 345.32 |
| 349.43 |
| Free cash flow in $ Million |
| 266.50 |
| 392.33 |
| 316.12 |
| -65.54 |
| 120.46 |
| Total cash $ Billion |
| 0.43 |
| 0.47 |
| 0.49 |
| 0.31 |
| 0.37 |
| Long-term debt (including current) in $ Billion |
| 2.27 |
| 2.02 |
| 1.82 |
| 1.82 |
| 1.82 |
| Dividend per share in $ |
| 0.25 |
| 0.25 |
| 0.275 |
| 0.275 |
| 0.275 |
| Shares outstanding (diluted) in Million |
| 157.46 |
| 157.34 |
| 157.68 |
| 157.39 |
| 157.30 |
| Oil Production |
| 2Q22 |
| 3Q22 |
| 4Q22 |
| 1Q23 |
| 2Q23 |
| Oil Equivalent Production in K Boepd NET |
| 164.4 |
| 188.5 |
| 173.59 |
| 172.51 |
| 184.25 |
| US Onshore Crude oil price ($/b) |
| 110.66 |
| 93.65 |
| 83.06 |
| 74.98 |
| 72.39 |
Source: Murphy Oil press release .
Analysis: Revenues, Earnings Details, Free Cash Flow, Debt, And Oil & Gas Production
1 - Total Revenue was $812.85 Million In 2Q23
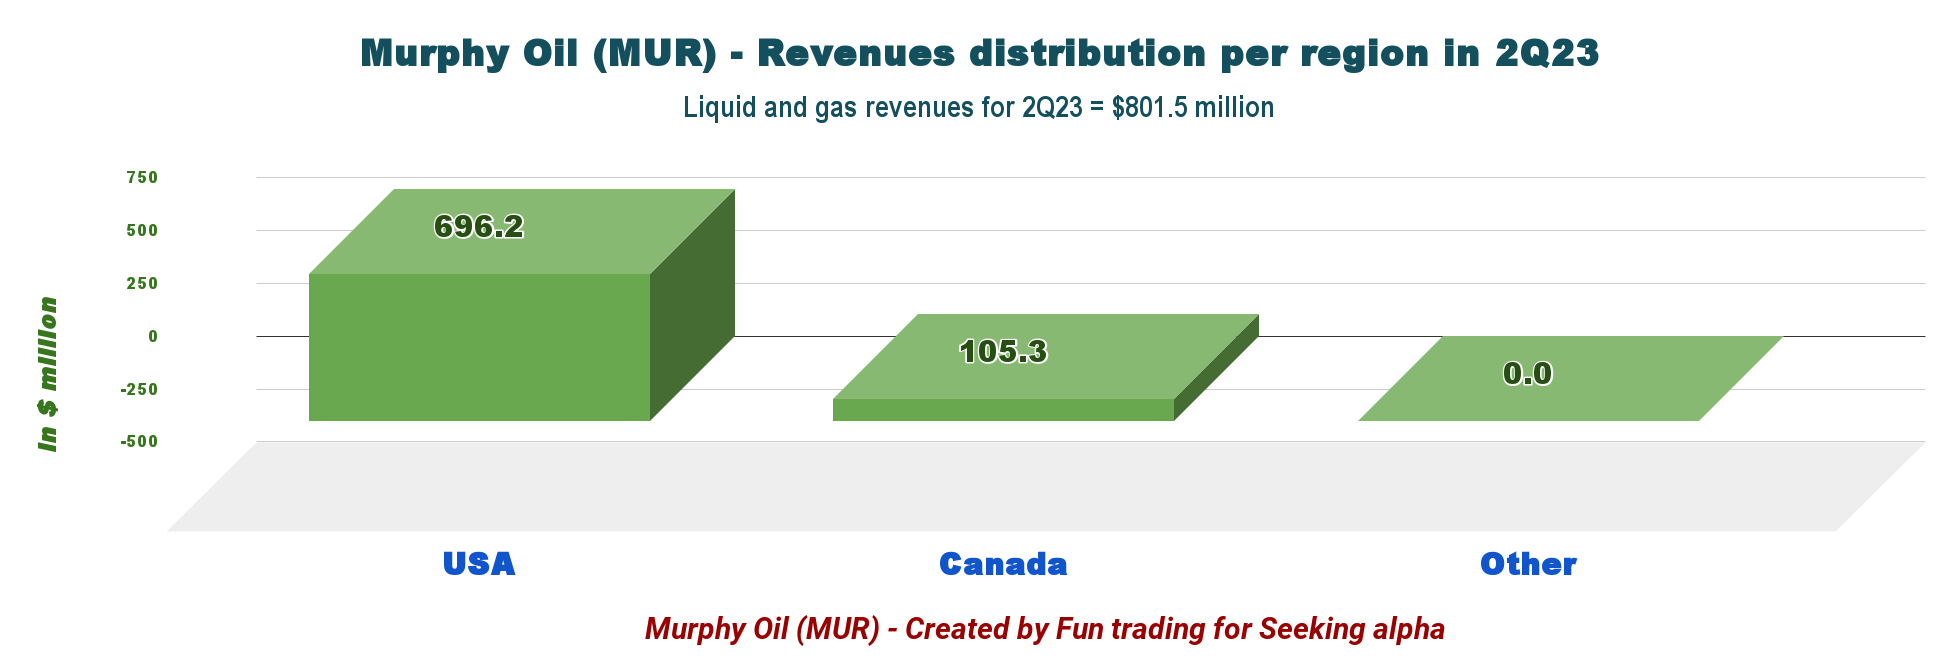
MUR Quarterly Revenues History (Fun Trading) Note: Oil and gas production revenues were $696.2 million in 2Q23. MUR Quarterly Oil and Gas Revenues per Region in 2Q23 (Fun Trading)
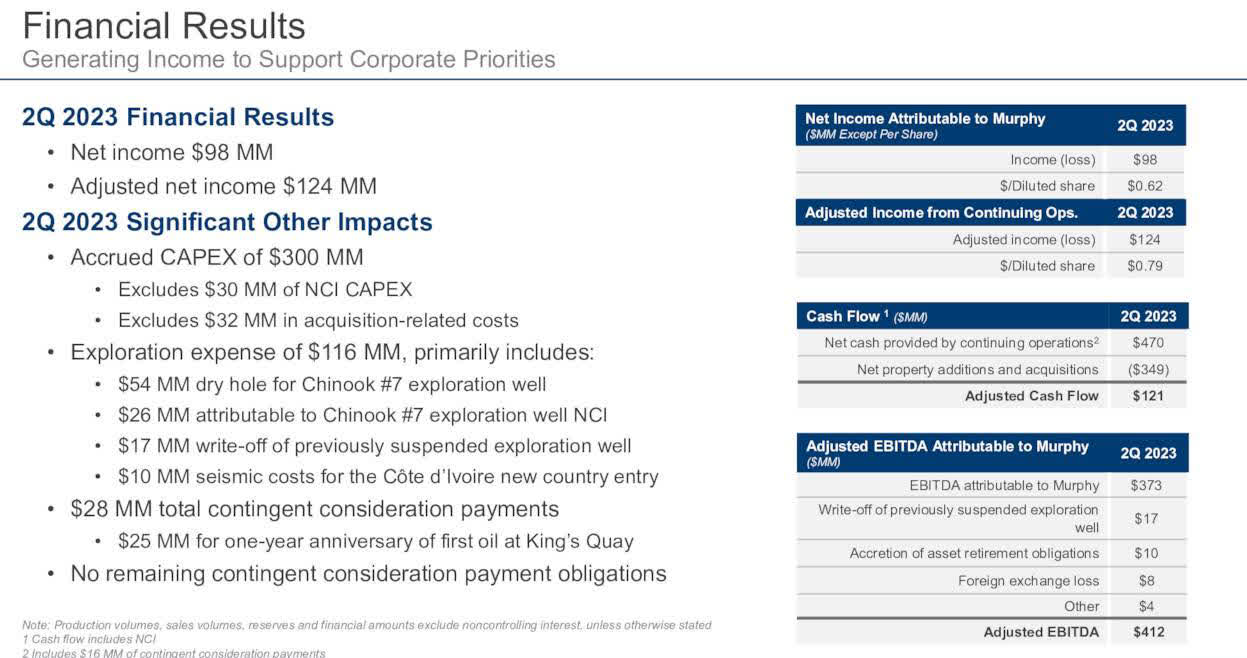
Murphy Oil reported a net income of $98.29 million , or $0.62 per diluted share, for the second quarter of 2023. This compares to $350.56 million or $2.23 per share a year ago.
The net cash provided by continuing operations activities in 2Q23 was $469.89 million , compared with $620.91 million in 2Q22.
MUR 2Q23 Financial Results (MUR Presentation)
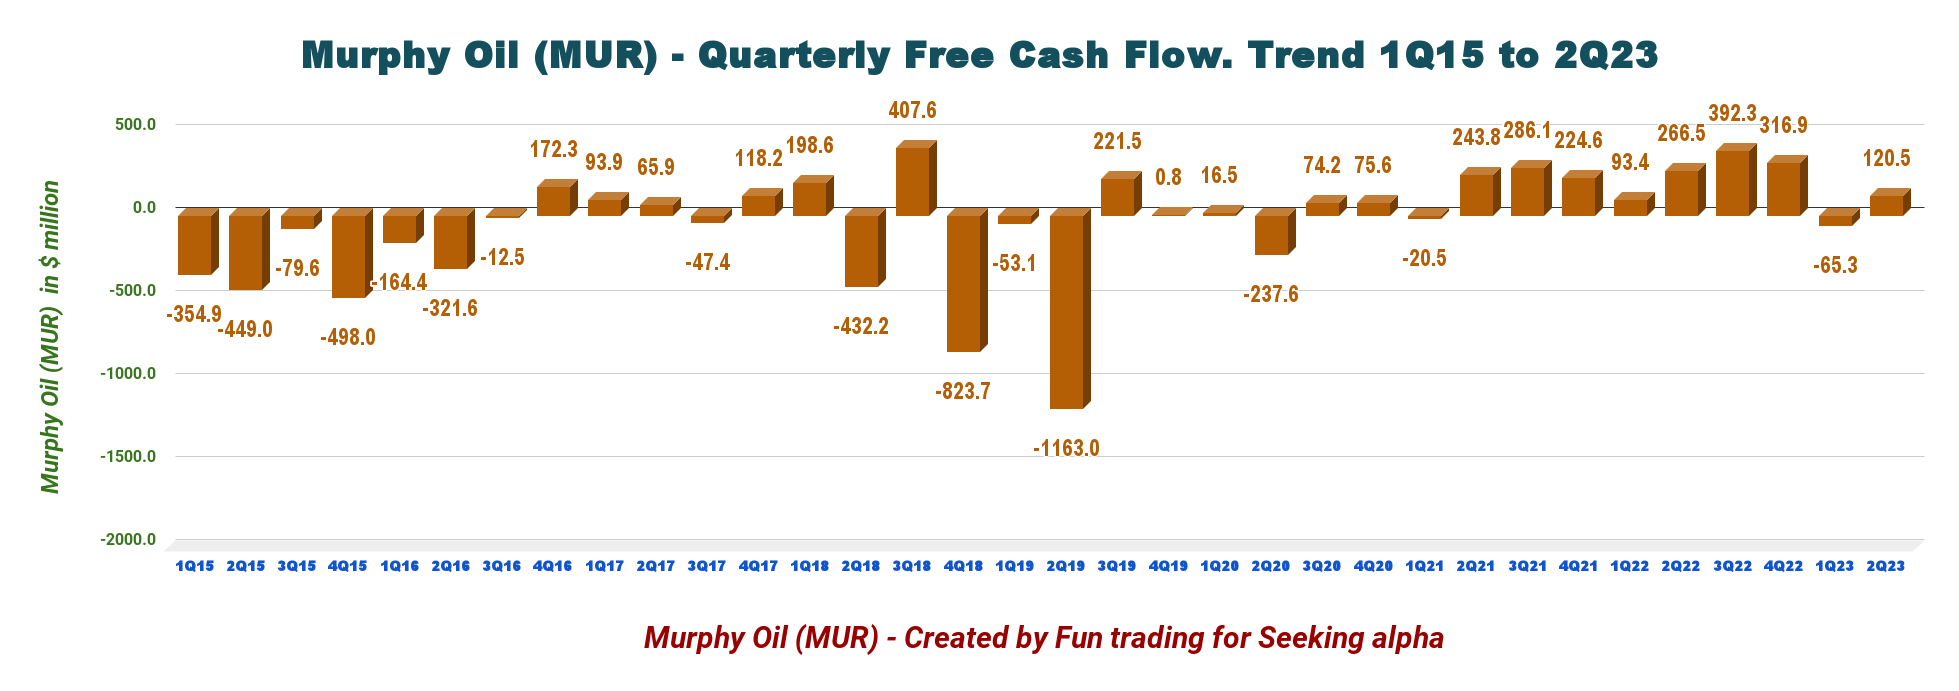
2 - Free Cash Flow was $120.46 Million in 2Q23
MUR Quarterly Free Cash Flow History (Fun Trading) Note: The generic free cash flow is cash from operating activities minus CapEx. The company has a different calculation, including divestiture, which cannot be compared to other E&P.
The generic free cash flow was $120.46 million in 2Q23. The trailing 12-month free cash flow is $746.74 million.
The company now pays a quarterly dividend of $0.275 per share, or a dividend yield of 2.40% .
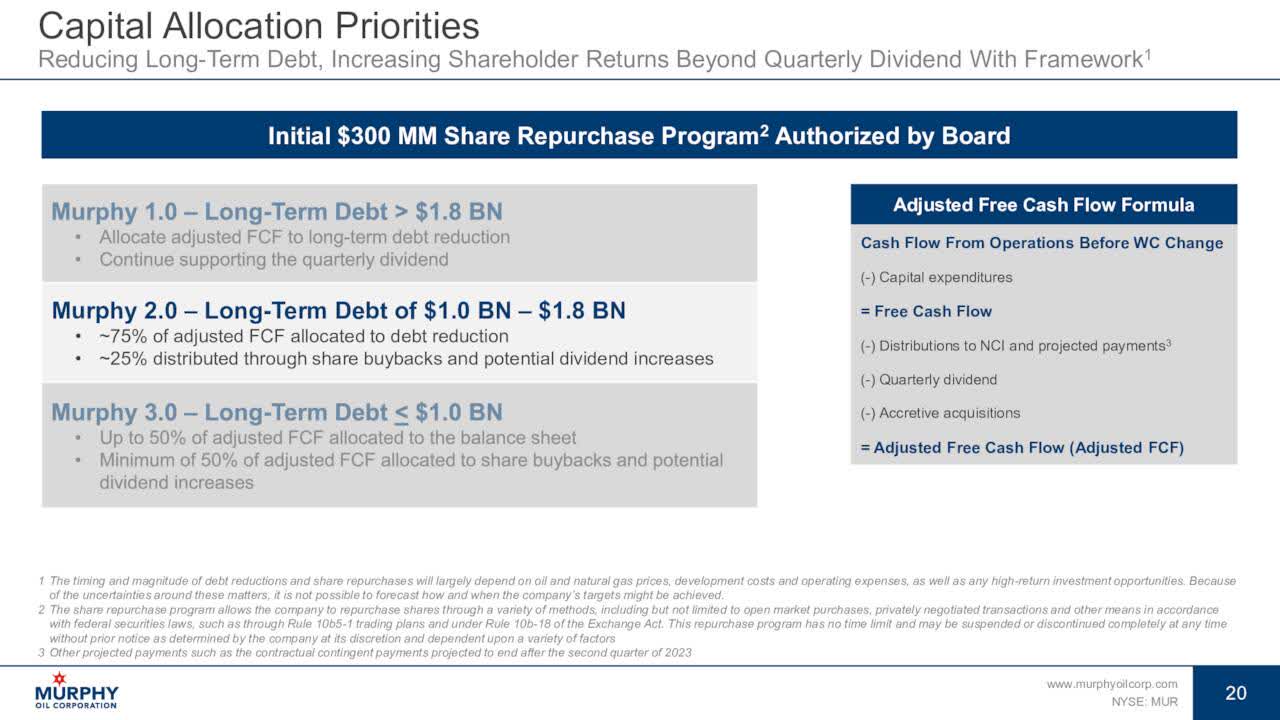
MUR indicated an initial $300 million share repurchase program. I would have preferred more debt cuts instead.
MUR Share Purchase Program (MUR Presentation)
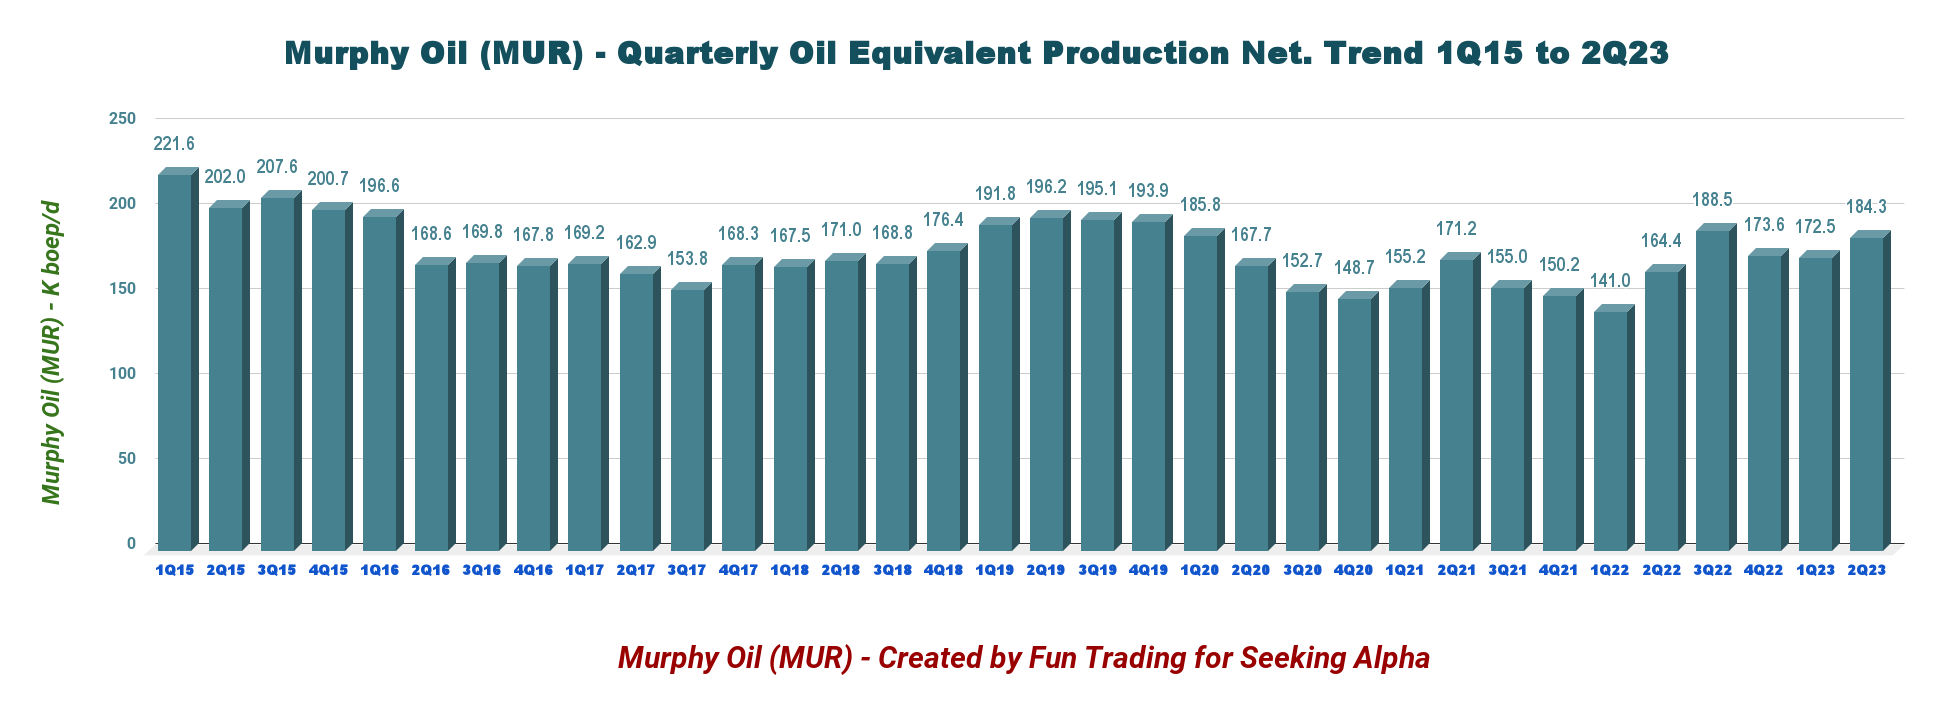
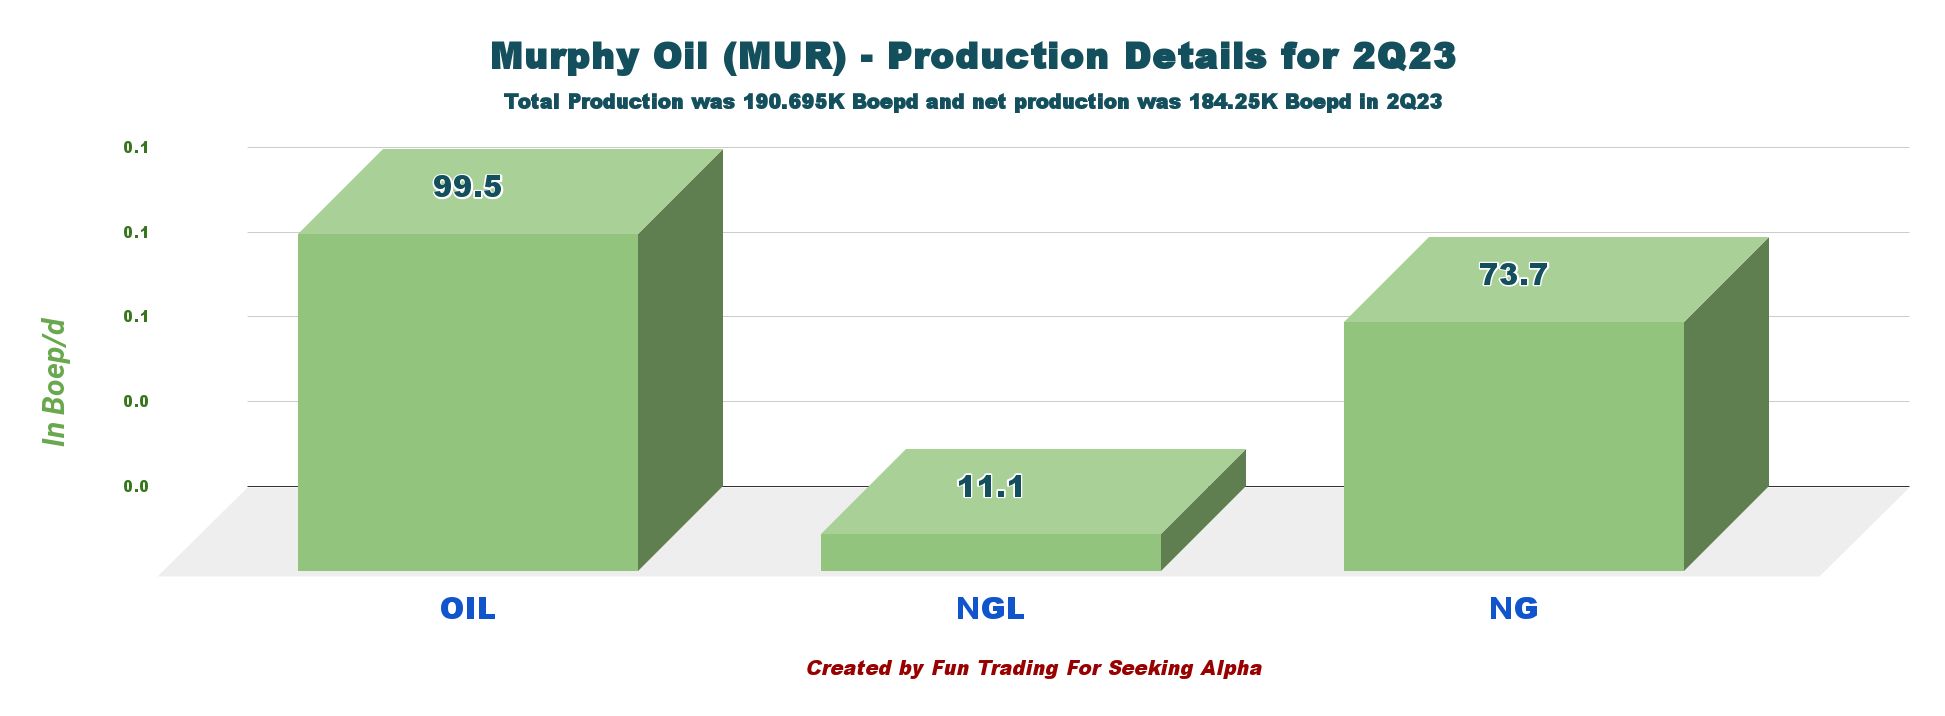
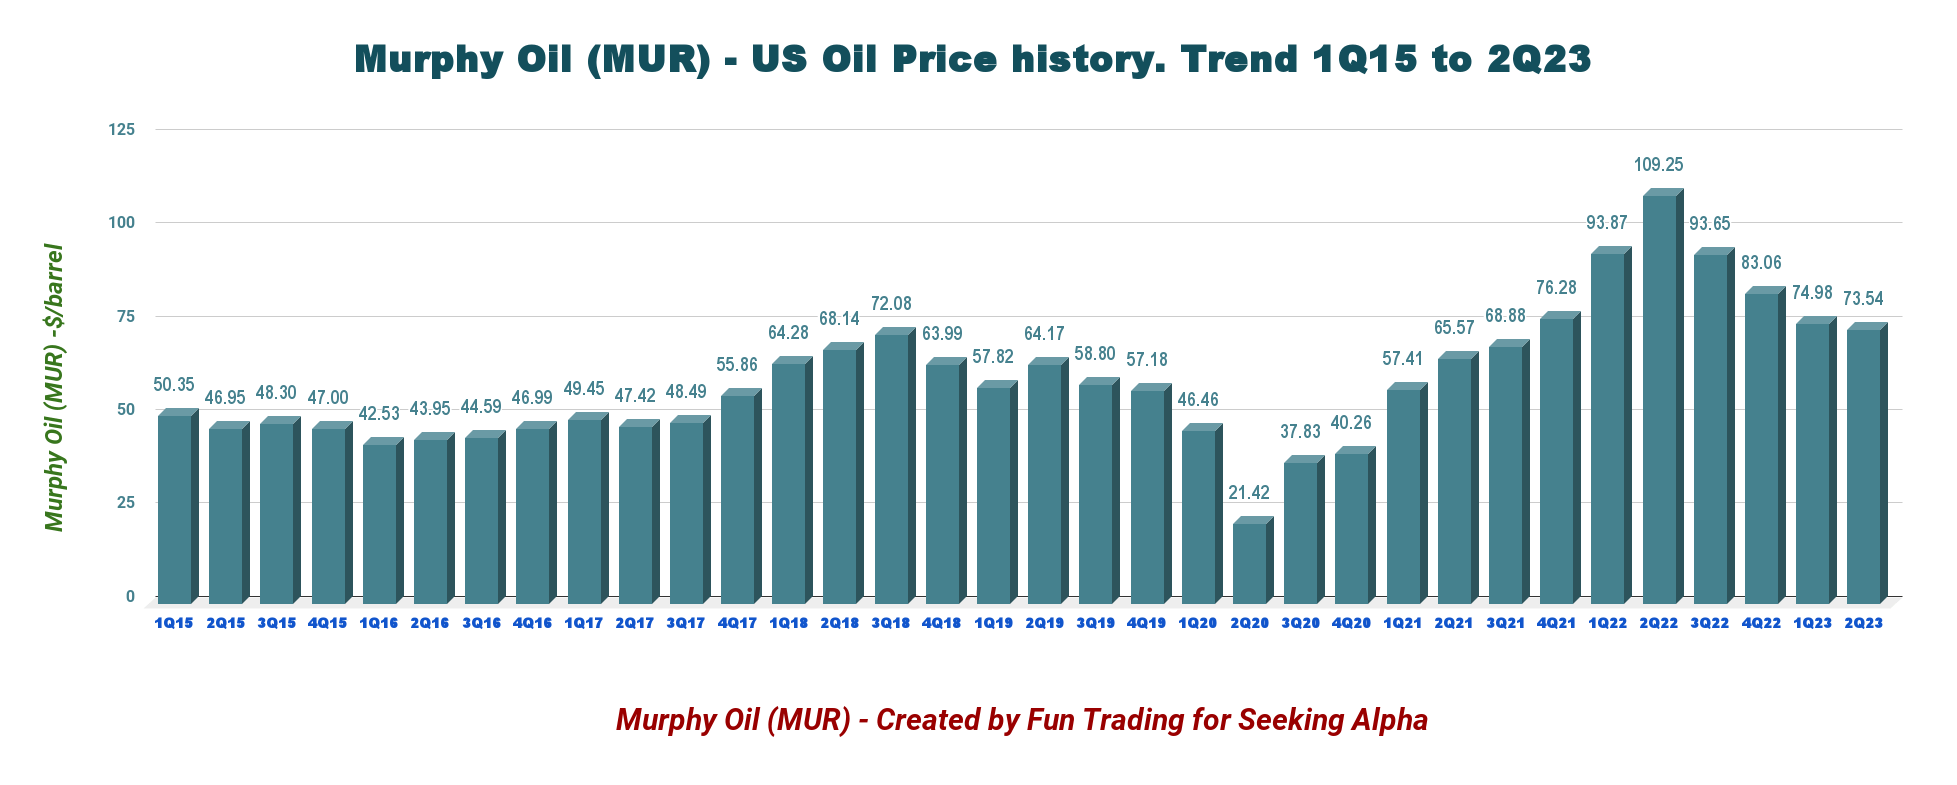
3 - Production was a Total of 184.25k Boepd in 2Q23 net
MUR Quarterly Oil Equivalent Production Net History (Fun Trading) The company produced 184.25K Boepd in the second quarter, comprising 60% of liquids. The offshore section, the Gulf of Mexico, represents 52% of the total output 2Q23. MUR 2Q23 Production per Segment (Fun Trading) Onshore U.S. oil prices were $73.54 a barrel in 2Q23, down significantly from the $109.25 realized last year. NGL price was $19.20 per Barrel and NG $1.92 per Mcf. MUR Quarterly US Oil Price History (Fun Trading) Below is how the equivalent production is spread between oil, NGL, and natural gas. Liquids represented 60% of the total output. MUR Production Pricing and Revenue in 2Q23 (MUR Presentation) Highlights for the Second Quarter: (press release) MUR New Country Entry in West Africa (MUR Presentation) CEO Roger Jenkins said in the conference call: we recently expanded our exploration focus by signing production sharing contracts to secure working interest as operator in five exploration blocks for new country entry into Cote d'Ivoire. We'll initially hold 85% to 90% working interest with PETROCI holding the remaining working interest in each block. It's important to note we have no well commitments in the initial two-year exploration phase, which provides us the time to conduct proper geophysical studies over the blocks.
On the negative side, West Africa presents an important risk due to its instability. I would have preferred an expansion in the USA.
After the Quarter
- Signed a Purchase and Sale Agreement to divest a portion of Kaybob Duvernay and Placid Montney assets for C$150 million (~$112 million) net purchase price
- Published the fifth annual Sustainability Report with enhanced disclosures on improved environmental activities, increased community support, and continuing strong governance oversight
4 - Net Debt - Good progress here.
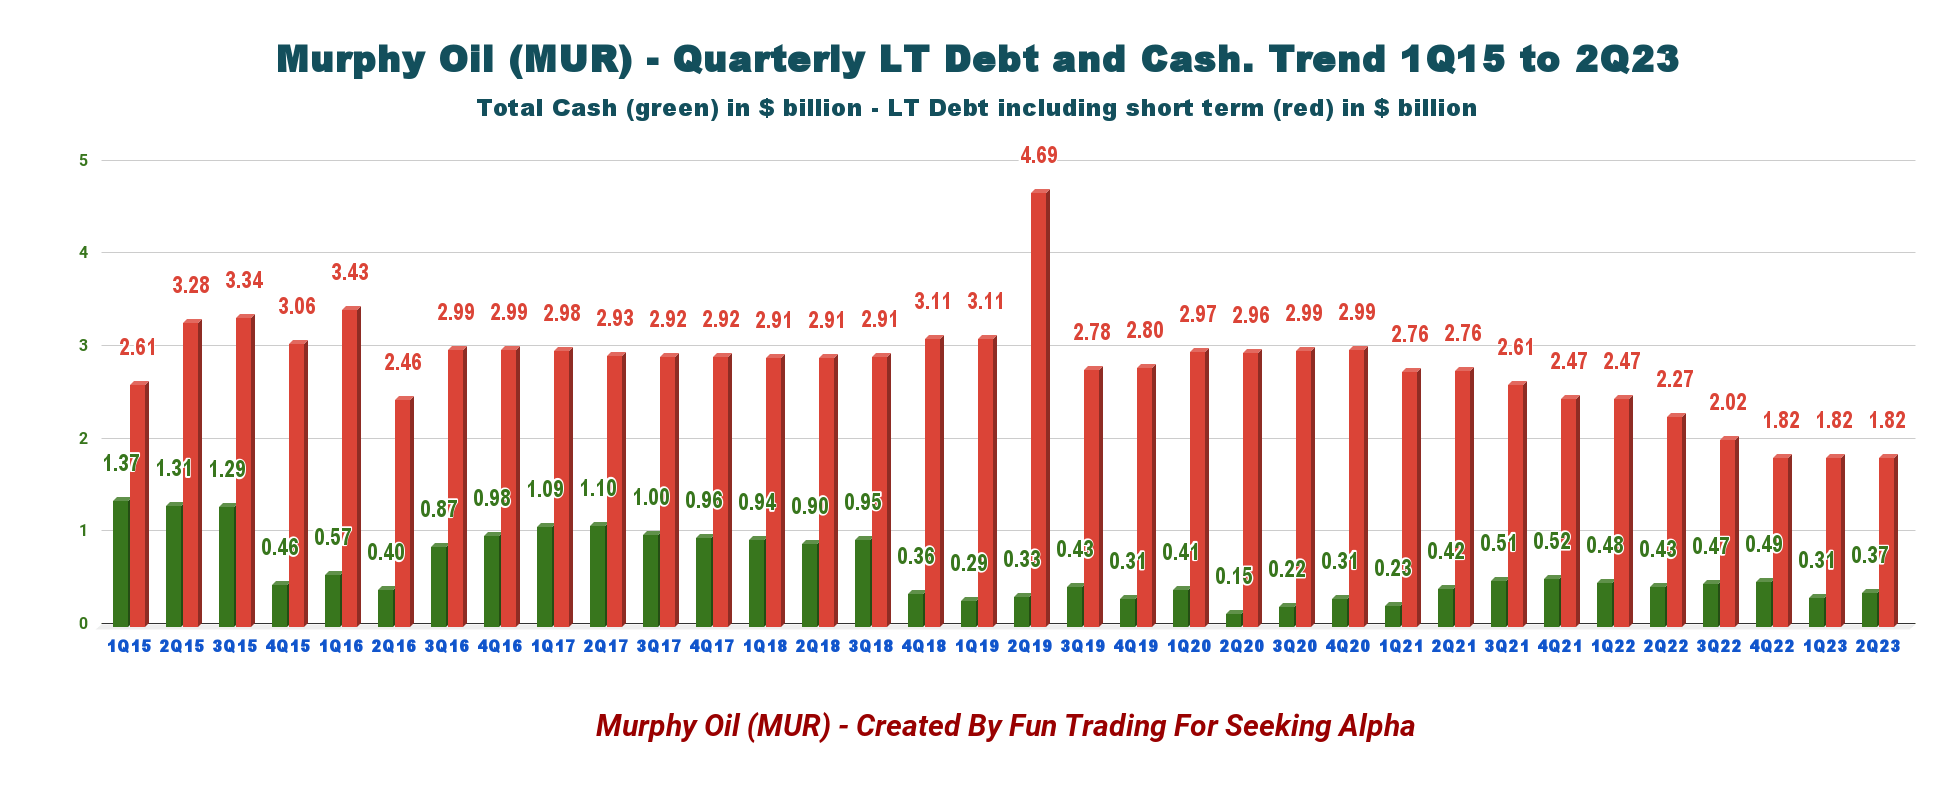
Murphy Oil had cash and cash equivalents of $369.36 million as of June 30, 2023, compared with $432.02 million as of June 30, 2022.
MUR Quarterly Cash versus Debt History (Fun Trading) Net debt was $1.455 billion at the end of June 2023. The Debt is an unsecured senior credit facility, not subject to semi-annual borrowing base redetermination. Murphy had approximately $1.1 billion of liquidity on June 30, 2023, with no borrowings on the $800 million credit facility.
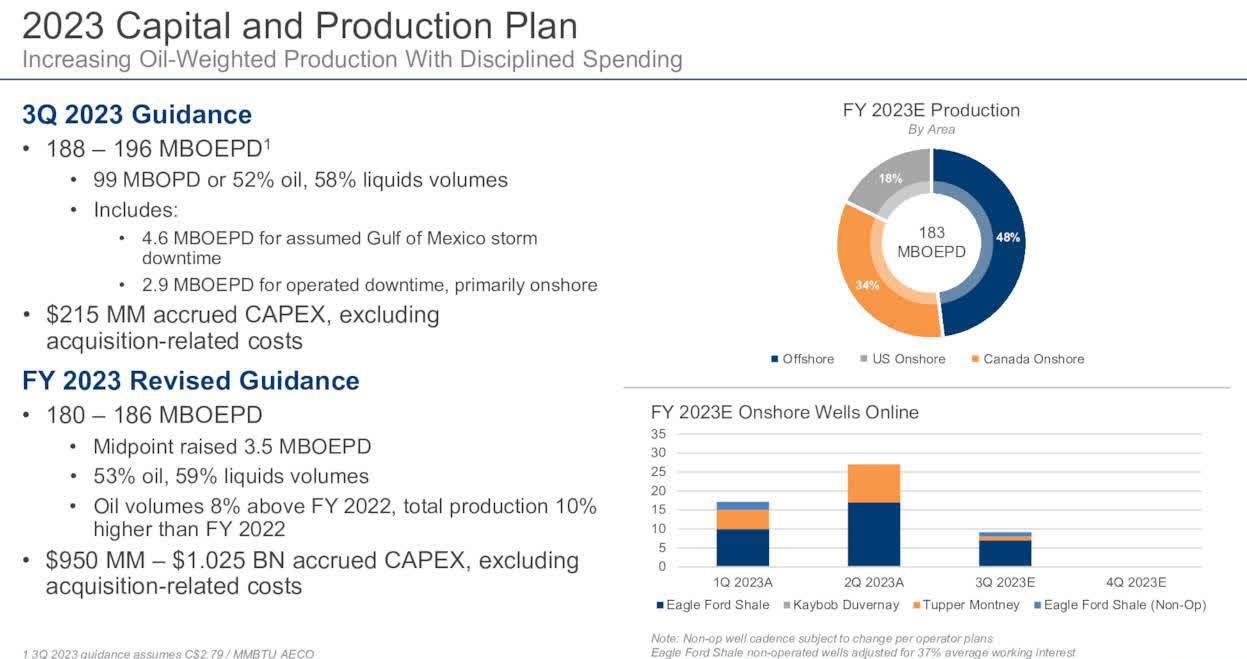
5 - 2Q23 Guidance has been revised up
MUR expects its production to be 173k-181k Boepd in 2Q23 , significantly higher than indicated in the preceding quarter.
Full-year CapEx is between $950 million and $1,025 million.
MUR expects 2023 production volumes between 180K Boepd and 186K Boepd.
3Q23 Production is expected to be 188K-196K Boepd.
MUR 2023 Guidance (MUR Presentation)
Technical Analysis (Short Term) And Commentary
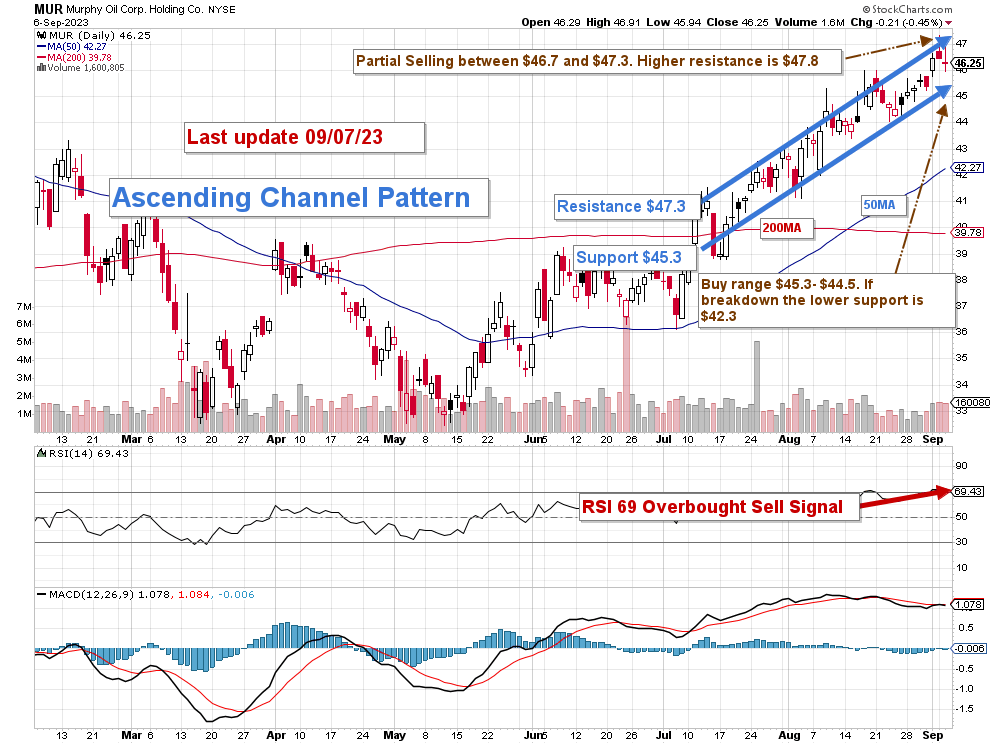
MUR TA Chart Short-term (Fun Trading StockCharts)
Note: The chart is adjusted for the dividend.
MUR forms an ascending channel pattern, with resistance at $47.3 and support at $45.3 .
Ascending channel patterns are short-term bullish, but these patterns often form within longer-term downtrends as continuation patterns. Hence, trade with caution here.
Furthermore, the RSI is now 70 (overbought) , a Sell Signal.
The trading strategy is to sell LIFO about 50% of your position between $46.7 and $47.3, with possible higher resistance at $47.8. Conversely, I suggest accumulating between $45.3 and $44.5, with potential lower support at $42.3.
Warning: The TA chart must be updated frequently to be relevant. It is what I am doing in my stock tracker. The chart above has a possible validity of about a week. Remember, the TA chart is a tool only to help you adopt the right strategy. It is not a way to foresee the future. No one and nothing can.
For further details see:
Murphy Oil: Adding Risk By Expanding In West Africa