VXF - My Current View Of The S&P 500 Index: August 2023 Edition (Technical Analysis)
2023-08-01 11:46:13 ET
Summary
- I plan to change my pension plan allocation to 75% SPDR S&P 500 ETF and 25% Vanguard Extended Market Index Fund.
- My pension plan assets outperformed the S&P 500 index in July, meeting my investment objectives.
- I use a moving average crossover system to determine asset allocation and aim to avoid large drawdowns in my pension assets.
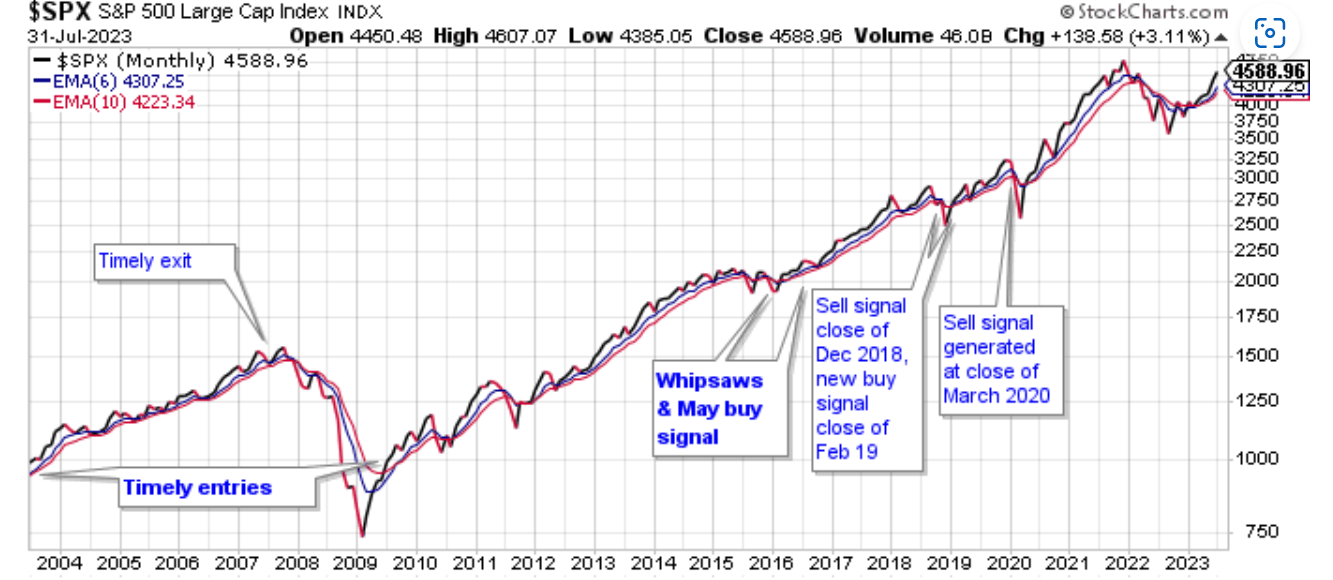
In this month’s article I outline why I will change my allocation of my pension plan assets to be 75% invested in the SPDR S&P 500 ETF ( SPY ) and 25% invested in the Vanguard Extended Market Index Fund ( VXF ). I will have no cash position. First, let me review my pension plan performance in July. The market, as measured by the S&P 500 index, gained 3.11% for the month as can be seen in Chart 1 below. As for my pension plan assets, I just outperformed the index as my investment allocation gained 3.27%. My investment objective of preserving my capital was met as I did make money. I did meet my second investment objective which is beating the S&P 500 index. It was a good month for me. Table 1 below shows my returns and allocations for the month of July and Table 2 below shows my returns for the past 12 months.
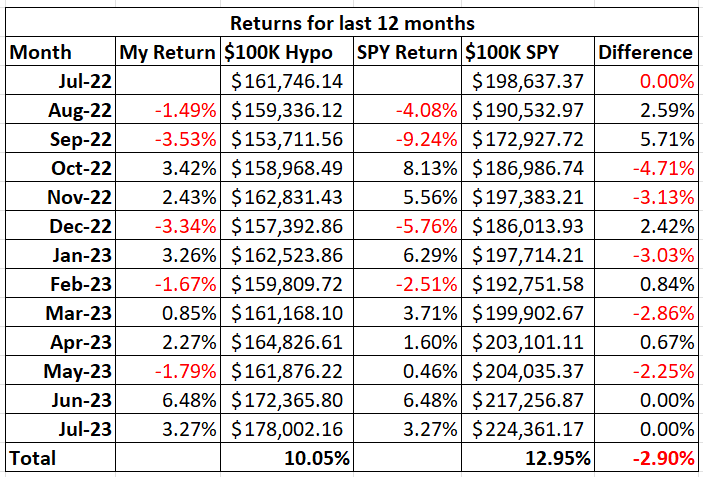
I have made changes to Table 2 below after I received a comment from a reader. Table 2 shows new columns to better (more accurately) reflect my investment results. The third column, $100K Hypo, is what my returns would be if I started my account with $100,000 in my first article of this series and followed the allocation recommendations from my articles. The fifth column, $100K SPY, shows the returns of just investing $100,000 and keeping it all allocated to SPY. The percentage returns in the last row show that my strategy returned 10.05% for the last 12 months and simply investing in SPY would have returned 12.95% for the last 12 months. Therefore, I have underperformed SPY for the last 12 months by 2.90%.
Table 1 – Investment Returns for July
Author
Table 2 – Investment Returns Last 12 Months
To review the purpose of this series of articles, my retirement account only allows me to buy the following four ETFs: iShares Core U.S. Aggregate Bond ETF ( AGG ), SPDR S&P 500 ETF ( SPY ), Vanguard Extended Market Index Fund ( VXF ), and iShares MSCI EAFE ETF ( EFA ). I can also have my money in cash. The question is how to decide where and when to allocate money to these various ETFs.
I use my moving average crossover system combined with relative strength charts to determine how to allocate my pension plan assets. My moving average crossover system uses the 6 month and the 10- month exponential moving averages to identify which of the four ETFs are in position to be bought. If the 6-month moving average is above the 10-month moving average, then the ETF is a buy. I call this setup being in bullish alignment. When the 6-month moving average is below the 10-month moving average the setup is referred to as a bearish alignment. When a bearish alignment happens, I don’t want to hold that asset. See Chart 1 below for a long-term look at the S&P 500 index using my moving average crossover system.
Chart 1 – Monthly SP 500 Index with 6/10 Moving Averages
You can see that the moving average crossover system provided some excellent long term buy and sell signals that would have allowed investors to capture long duration moves in the index; while avoiding costly drawdowns. Avoiding these costly drawdowns allows me to meet the objective of capital reservation.
I employ this strategy because I do not want to experience a large drawdown with my pension assets. During the 2008 - 2009 market crash many people didn't even look at their retirement statements because they were afraid of what they would find. I submit that if those people would have used a market strategy like what I outline in this series of articles, they would have been able to avoid much of the decline during the bear market and consequently would have had less emotional stress during that time.
The following charts show the status of the ETFs that I am allowed to buy in my retirement account.
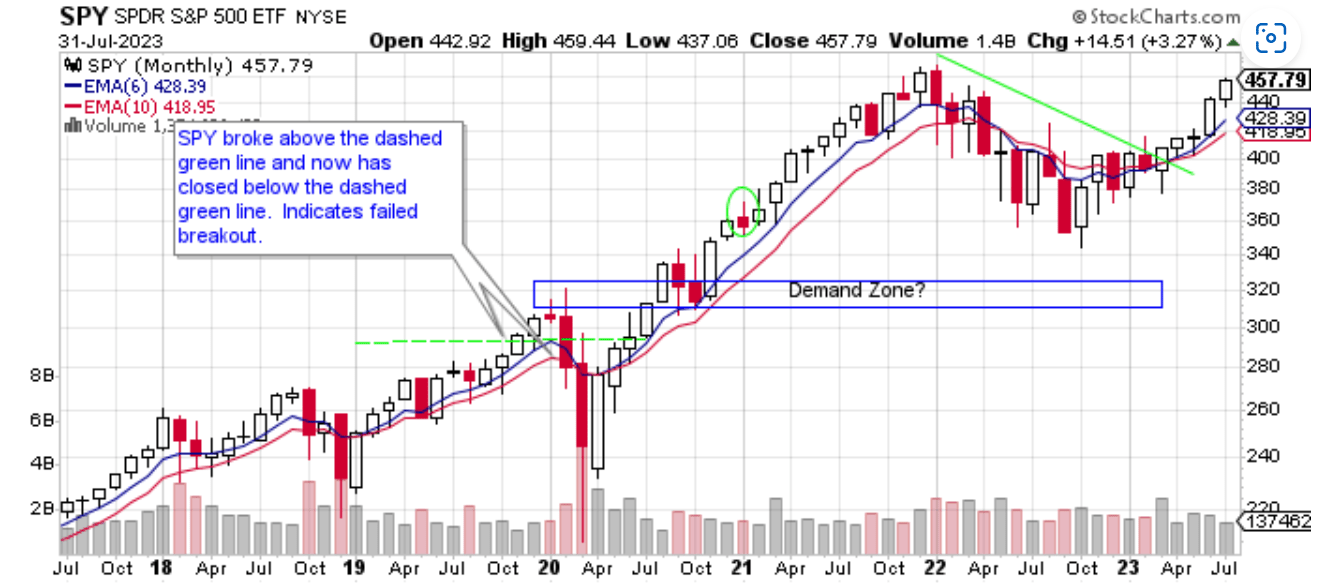
Chart 2 – Monthly SPY with 6/10 Moving Averages
Chart 2 shows that SPY gained 3.27% in July which is another nice gain. SPY had a bullish candle, remains in bullish alignment, and has risen for five consecutive months. Large cap US equities are doing well and for that reason I will maintain a large position in SPY for the month of August. I will allocate 75% of my funds to SPY. The rest will go to VXF which is outlined next.
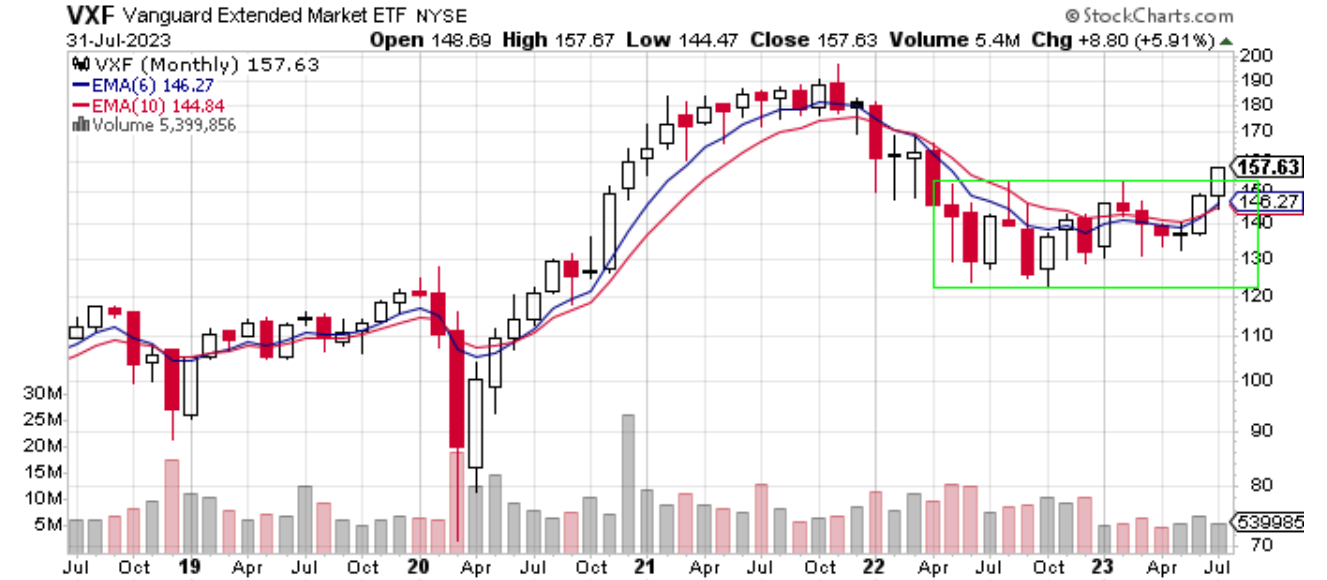
Chart 3 – Monthly VXF with 6/10 Moving Averages
Chart 3 shows that VXF gained 5.91% in July and was the biggest gainer of the ETFs that I follow for this series of articles. Congratulations to those of you who hold VXF. VXF had a nice bullish candle on lower volume. VXF broke out of this consolidation zone showing that market breadth is starting to improve. VXF is now in bullish alignment as well. I wrote last month , that I would consider allocating money to VXF if it broke out of that green box or consolidation zone. VXF met the challenge so I will allocate 25% of my funds to it for August.
Chart 4 – Monthly VXF:SPY Relative Strength
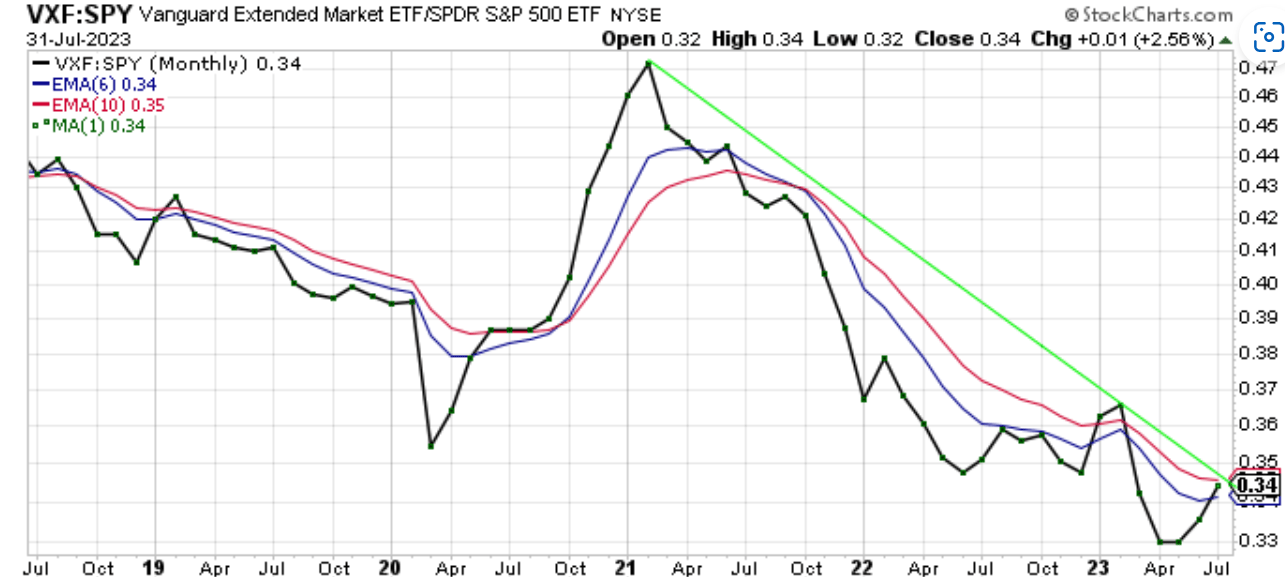
The VXF:SPY ratio again gained ground in July as VXF outperformed SPY by 2.56%. The VXF:SPY ratio has improved. It closed above the 6-month moving average and both moving averages appear to be flattening out. The next step is for them to turn higher. I like what I am seeing with this ratio and combined with what I see in Chart 3 I feel comfortable allocating 25% of my funds to VXF.
Chart 5 – Monthly EFA with 6/10 Moving Averages
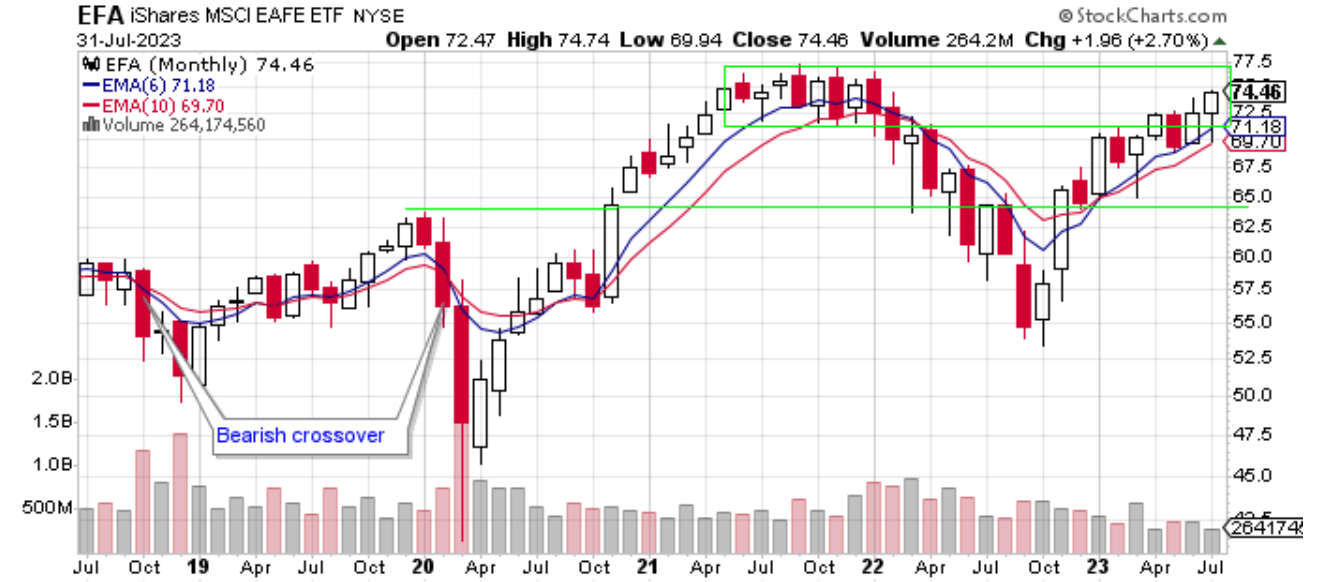
Chart 5 shows EFA gained 2.70% in July and remains in bullish alignment. It is now back inside that area of supply or distribution outlined by the green box. It will be interesting to see how prices act at this level this time. EFA is still trending higher which means good things are probable in my opinion. EFA will not be part of my investment allocation in August.
Chart 6 - Monthly EFA:SPY Relative Strength
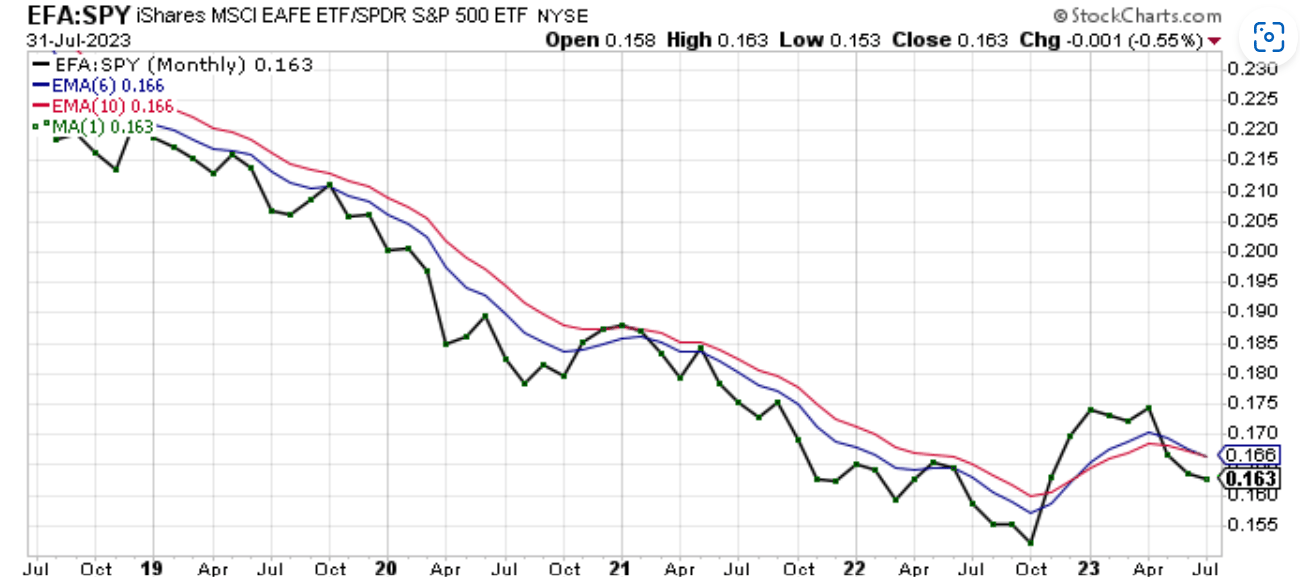
Chart 6 shows that the EFA:SPY ratio lost 0.55% in July. The ratio trades below both moving averages and is not in a position of strength. There is no reason to be in EFA versus SPY at this time.
Chart 7 – Monthly EFA:VXF Relative Strength
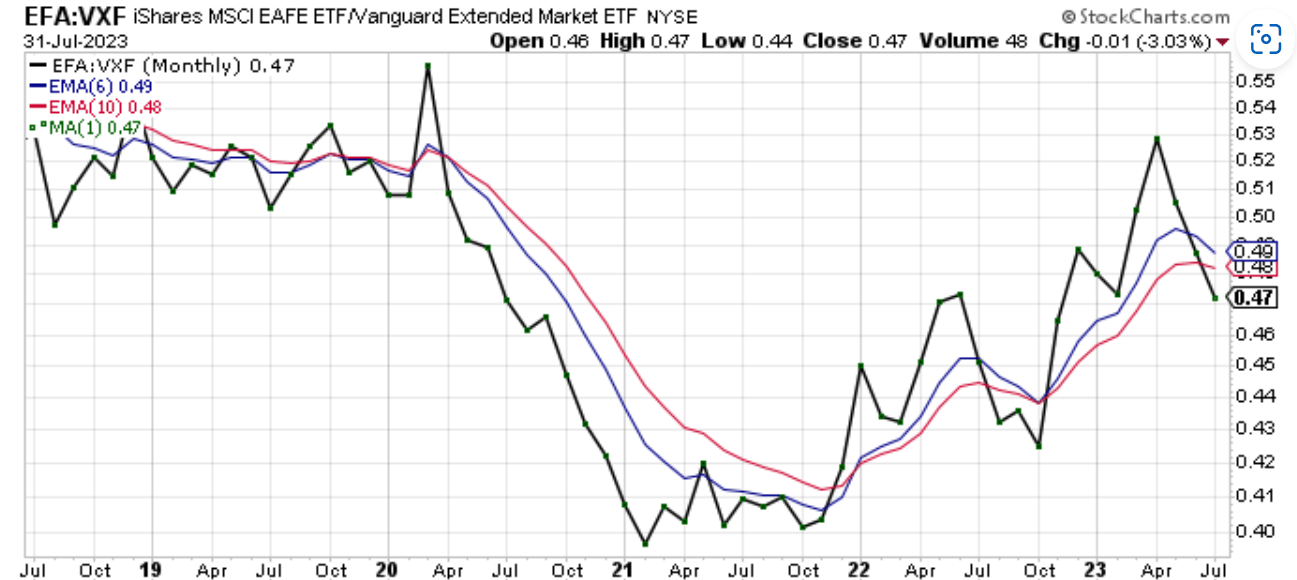
Chart 7 shows that EFA underperformed VXF in July by 3.03%. The ratio is below both moving averages and those moving averages are turning lower. This says that EFA is an inferior investment to VXF at this time.
Chart 8 – Monthly AGG with 6/10 Moving Averages
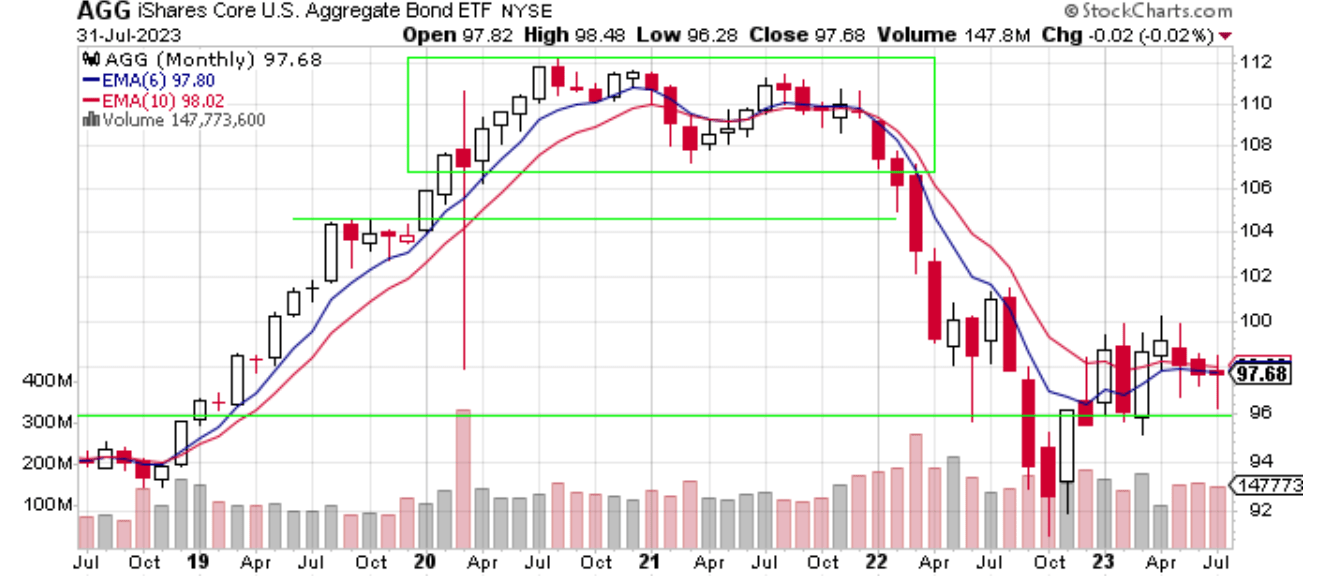
Chart 8 shows that AGG lost 0.02% in July. AGG remains inside this area of consolidation going back to May 2022. AGG trades below both moving averages. That does not bode well for AGG moving forward. Perhaps AGG will test the $93 level. I will have no exposure to AGG in August.
Chart 9 – Monthly AGG:SPY Relative Strength
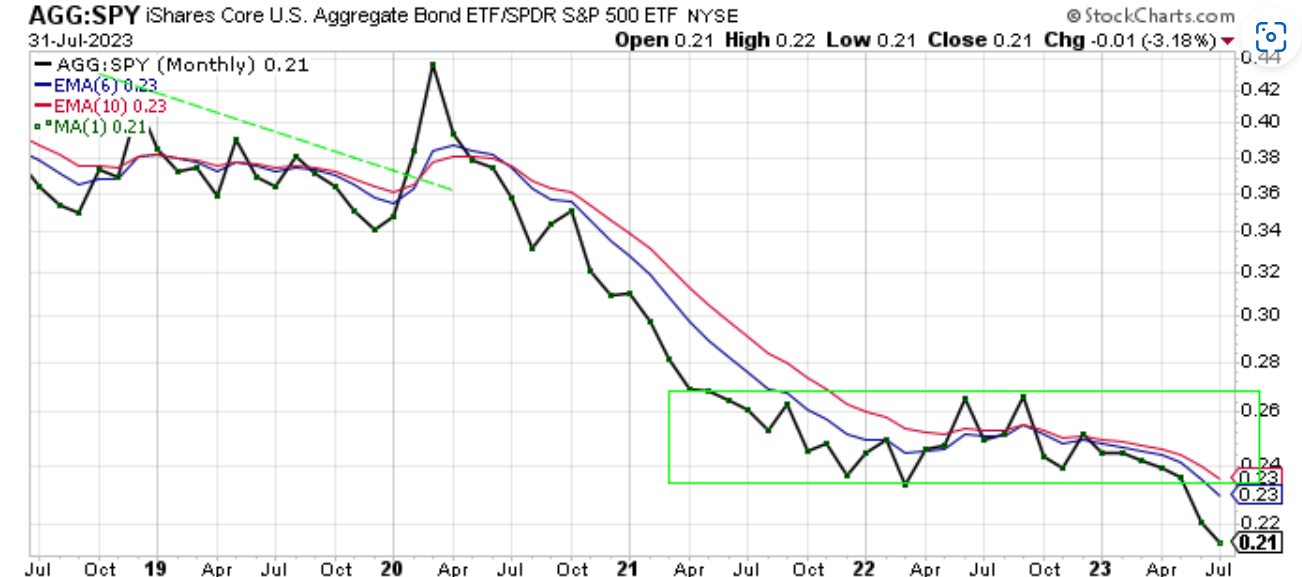
The AGG:SPY ratio in Chart 9 lost 3.18% as AGG underperformed SPY in July. The ratio is now trading below the area of consolidation.
In summary, July was bullish for me and equity investors. Only AGG didn’t record a gain in July. SPY, EFA, and VXF are in bullish alignment. SPY remains strong as it approaches its previous all-time high. Because of its strength I am maintaining 75% of my funds to SPY. I like what I see out of VXF. It is in bullish alignment, breaking out of a base, and the VXF:SPY ratio is heading higher. Because of these three factors, I am allocating 25% of my funds to VXF in August. I’ll see how things progress and I’ll be prepared to change course next month if necessary.
For further details see:
My Current View Of The S&P 500 Index: August 2023 Edition (Technical Analysis)