VXF - My Current View Of The S&P 500 Index: January 2024 Edition (Technical Analysis)
2023-12-30 06:10:54 ET
Summary
- I maintain a 100% allocation to the SPDR S&P 500 ETF in my pension plan.
- I outperformed the S&P 500 index in December and met my investment objectives.
- My strategy of using moving average crossover and relative strength charts guides my allocation decisions.
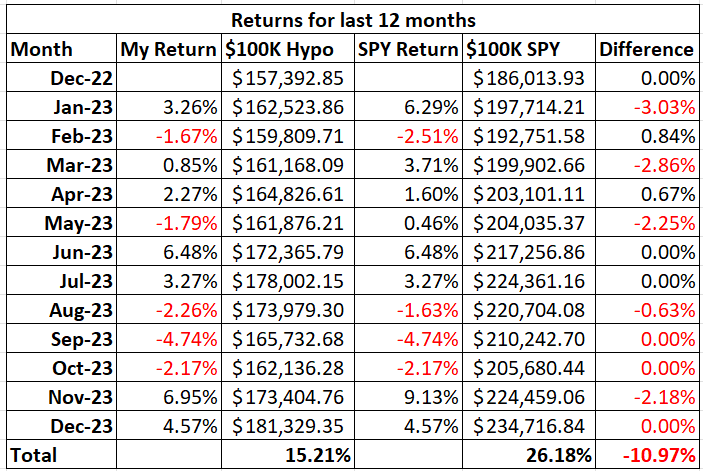
In this month's article, I outline why I will maintain my position of having 100% of my pension plan assets invested in the SPDR S&P 500 ETF ( SPY ). I will not have a cash position. First, let me review my pension plan performance in December. The market, as measured by the S&P 500 index, gained 4.42% for the month, as can be seen in Chart 1 below. As for my pension plan assets, I outperformed the index as my investment allocation gained 4.57%. My investment objective of preserving my capital was met, as I did make money. I did meet my second investment objective, which is beating the S&P 500 index. Table 1 below shows the returns and my allocations for the month of December, and Table 2 below shows my returns for the past 12 months.
I have made changes to Table 2 below after I received a comment from a reader. Table 2 shows new columns to better (more accurately) reflect my investment results. The third column, $100K Hypo, is what my returns would be if I started my account with $100,000 in my first article of this series and followed the allocation recommendations from my articles. The fifth column, $100K SPY, shows the returns of just investing $100,000 and keeping it all allocated to SPY. The percentage returns in the last row show that my strategy returned 15.21% for the last 12 months, and simply investing in SPY would have returned an even 26.18% for the last 12 months. Therefore, I have underperformed SPY for the last 12 months by almost 11%. As I've stated before, beating the market is harder than it seems.
Table 1 - Investment Returns for December
Author
Table 2 - Investment Returns Last 12 Months
To review the purpose of this series of articles, my retirement account only allows me to buy the following four ETFs: iShares Core U.S. Aggregate Bond ETF ( AGG ), SPDR S&P 500 ETF ((SPY)), Vanguard Extended Market Index Fund ( VXF ), and iShares MSCI EAFE ETF ( EFA ). I can also have my money in cash. The question is how to decide where and when to allocate money to these various ETFs.
I use my moving average crossover system combined with relative strength charts to determine how to allocate my pension plan assets. My moving average crossover system uses the 6 month and the 10- month exponential moving averages to identify which of the four ETFs are in position to be bought. If the 6-month moving average is above the 10-month moving average, then the ETF is a buy. I call this setup being in bullish alignment. When the 6-month moving average is below the 10-month moving average, the setup is referred to as a bearish alignment. When a bearish alignment happens, I don't want to hold that asset. See Chart 1 below for a long-term look at the S&P 500 index using my moving average crossover system.
Chart 1 - Monthly SP 500 Index with 6/10 Moving Averages
You can see that the moving average crossover system provided some excellent long term buy and sell signals that would have allowed investors to capture long duration moves in the index; while avoiding costly drawdowns. Avoiding these costly drawdowns allows me to meet the objective of capital reservation.
I employ this strategy because I do not want to experience a large drawdown with my pension assets. During the 2008–2009 market crash, many people didn't even look at their retirement statements because they were afraid of what they would find. I submit that if those people would have used a market strategy like what I outline in this series of articles, they would have been able to avoid much of the decline during the bear market and consequently would have had less emotional stress during that time.
The following charts show the status of the ETFs that I am allowed to buy in my retirement account.
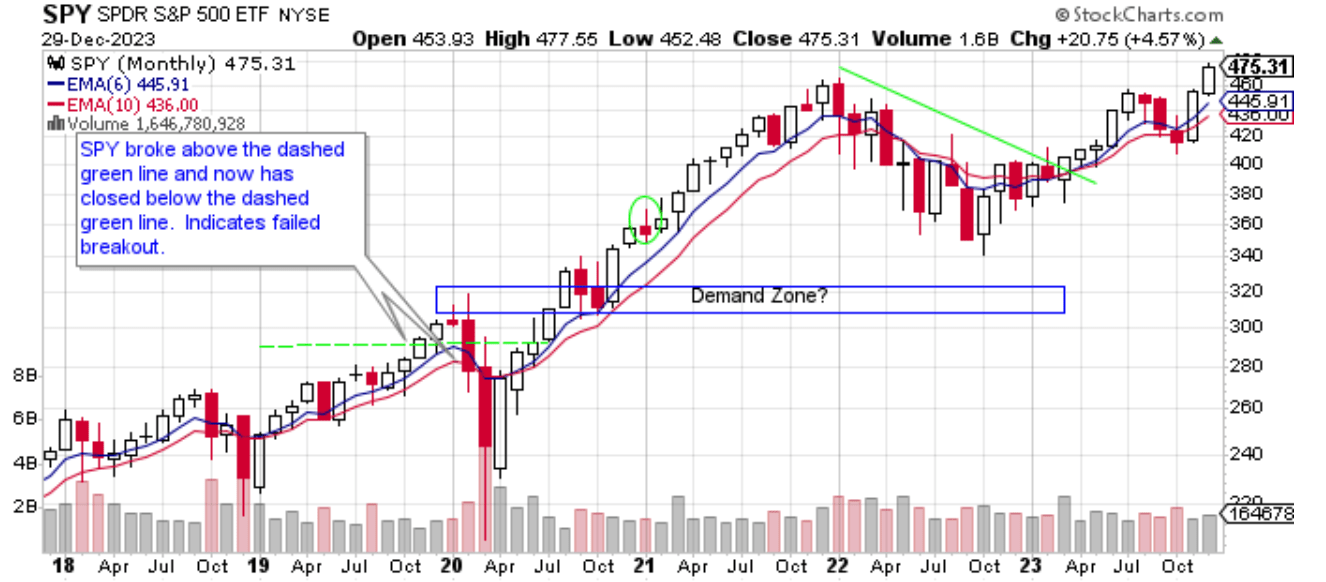
Chart 2 - Monthly SPY with 6/10 Moving Averages
Chart 2 shows that SPY gained 4.57% in December. SPY had another bullish candle and closed at a new high. Volume was higher than last month. SPY remains in bullish alignment and the area between the two moving averages is widening, which is bullish. I like what I see in SPY, and I will maintain my 100% allocation to SPY to start the new year. The odds favor positive outcomes in the months ahead.
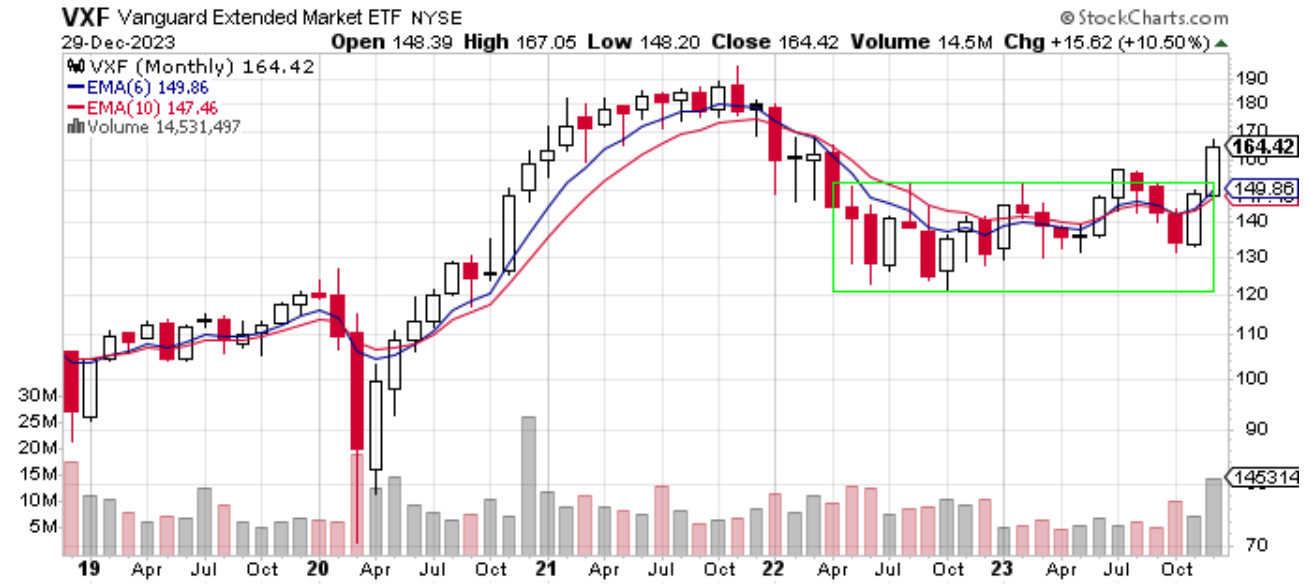
Chart 3 - Monthly VXF with 6/10 Moving Averages
Chart 3 shows that VXF closed 10.50% percent higher in December. In the past two months, VXF has risen 22.89%. That is quite a move. With December's candle, it appears that VXF has broken out of its recent area of consolidation. It did so on high volume as well. Also, noteworthy is that VXF is in bullish alignment. It looks like VXF is on its way to challenging its previous high, made in November 2021.
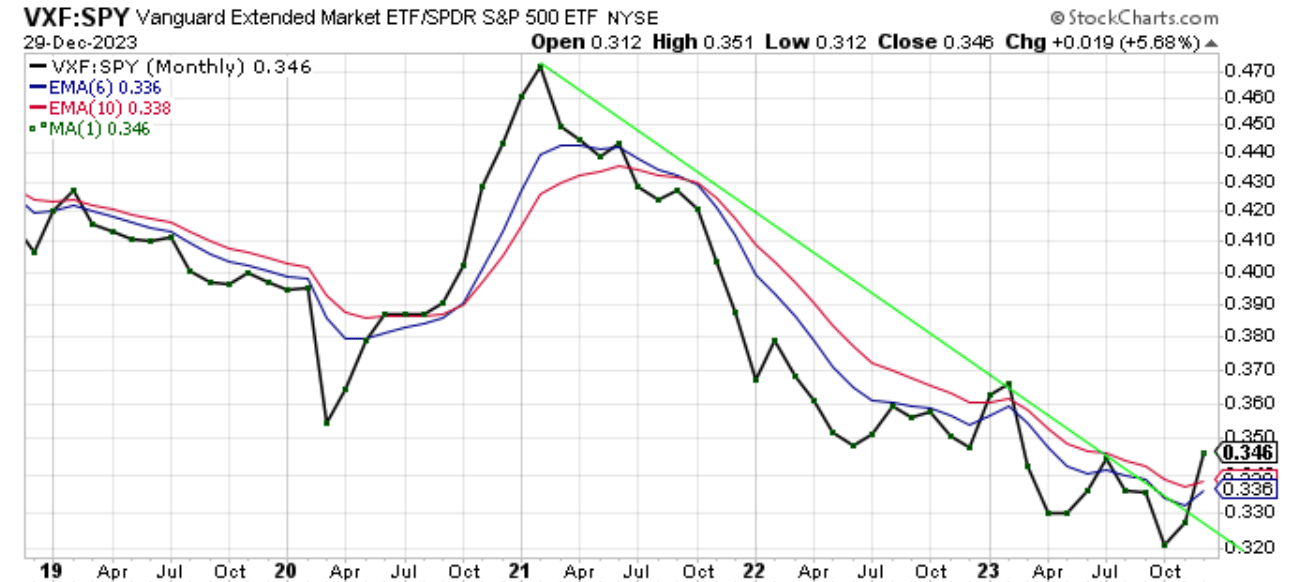
Chart 4 - Monthly VXF:SPY Relative Strength
The VXF:SPY ratio gained 5.68% in December, as shown in Chart 4. The ratio crossed above both of its moving averages, yet the moving averages themselves are not in bullish alignment. This always presents a conundrum to me. It looks like I should be in VXF as it has done well recently and the VXF:SPY ratio closed above the 10-month moving average. I've often said that I must respect such a move on the price chart of the ETF itself. I mentioned this in last month's article. Yet, I want to stay disciplined and wait for the two moving averages to crossover. If they cross over, this would indicate that a sustained move could take place with VXF leading SPY for some time. If that is true, there will be plenty of time for me to benefit from the outperformance. I'll keep an eye on this chart moving forward.
Chart 5 - Monthly EFA with 6/10 Moving Averages
Chart 5 shows EFA rose 5.35% in December. EFA's chart looks like SPY's chart. Both ETFs had strong bullish candles with higher volume than last month's volume. Also, both are in bullish alignment. Things look bullish for EFA.
Chart 6 - Monthly EFA:SPY Relative Strength
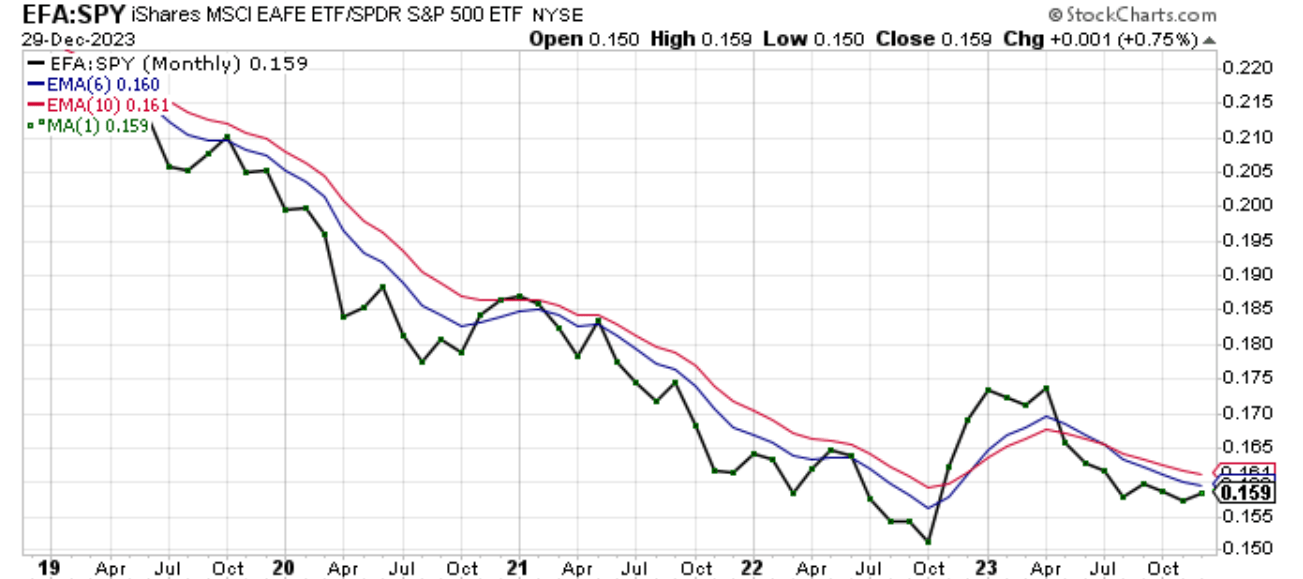
Chart 6 shows that the EFA:SPY ratio gained 0.75% in December. The ratio trades below both moving averages and is not in a position of strength. The ratio is in bearish alignment. On the positive side of things, the ratio may be putting in a higher low. Still, there is no reason to be in EFA versus SPY.
Chart 7 - Monthly EFA:VXF Relative Strength
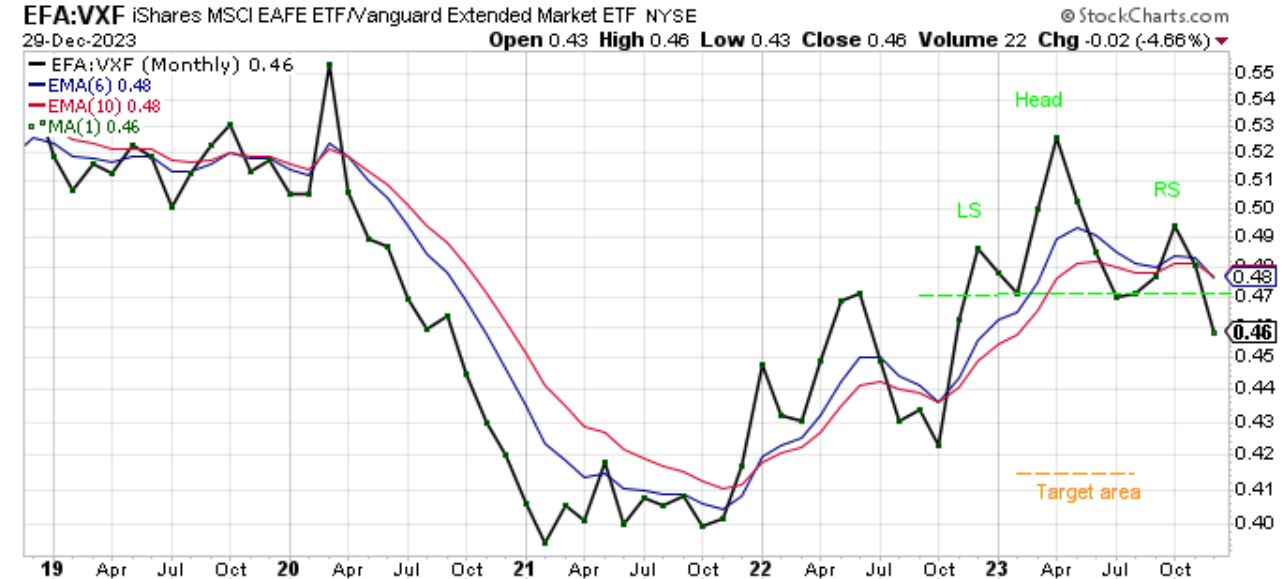
Chart 7 shows that EFA underperformed VXF in December by 4.66%. The ratio is in bearish alignment. I also find it interesting that a head and shoulders pattern has formed in the ratio. The left shoulder formed in the 4th quarter of 2022. The head peaked in April 2023 and the right shoulder peaked in October. The neckline of the pattern is shown by the dashed green line. The distance between the neckline and the peak of the head is the expected distance of the decline in the ratio once it breaks its neckline, as it did in December. The expected decline target area is where the dashed orange line is on the chart. Somewhere in 0.41 to 0.42 level. This is not a prediction on my part, just something I am keeping an eye on. With all that said, there is no reason to be invested in EFA over VXF.
Chart 8 - Monthly AGG with 6/10 Moving Averages
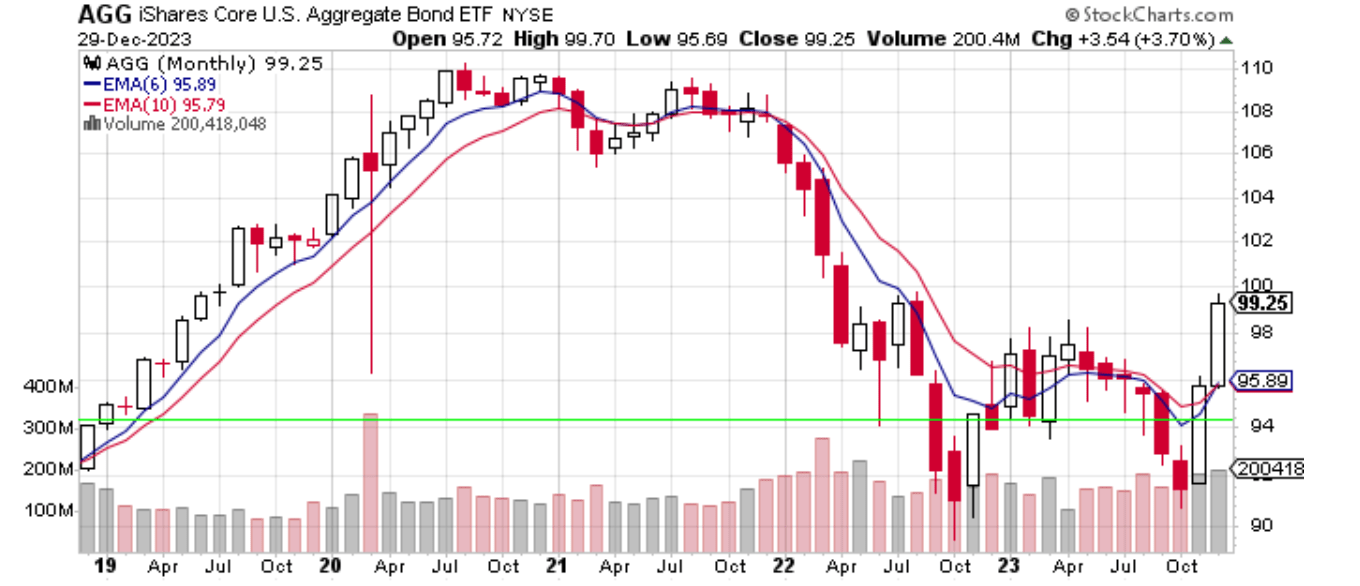
Chart 8 shows that AGG did well. It gained 3.70% in December. It too had a nice bullish candle on higher volume. AGG is now in bullish alignment. Another bullish sign is that AGG exceeded the April high and therefore has made a change in trend. AGG now has a higher high after a higher low. The higher low was made in October, as its low was higher than the previous low made in October 2022. After a long decline that started in August 2020, AGG is now trending higher on the monthly chart.
Chart 9 - Monthly AGG:SPY Relative Strength
Despite all the glowing comments about AGG in the previous section, the AGG:SPY ratio in Chart 9 lost 0.83% as AGG underperformed SPY in December. The ratio is in bearish alignment and is trading below the area of consolidation as shown by the green box. Investors still prefer equities to bonds.
In summary, stocks and bonds rallied in December. I achieved both of my investment objectives for the month. I still must do better regarding beating the SP 500 index. I underperformed that index in 2023. SPY is at a new high and still looks bullish. VXF is off to the races, having gained over 20% in the last two months. EFA also had a strong month. Lastly, AGG appears to have turned the corner as it has now made a trend change on the monthly chart. SPY is still the best ETF for me, and I will maintain my 100% allocation in SPY for January. Happy New Year, everyone.
For further details see:
My Current View Of The S&P 500 Index: January 2024 Edition (Technical Analysis)