VXF - My Current View Of The S&P 500 Index: July 2023 Edition (Technical Analysis)
2023-07-01 08:56:00 ET
Summary
- My pension plan assets, which are 100% invested in the SPDR S&P 500 ETF, outperformed the S&P 500 index in June, gaining 6.48% compared to the index's 6.47% gain. However, over the past 12 months, my strategy underperformed the S&P 500 by 8.80%.
- I use a moving average crossover system and relative strength charts to determine how to allocate pension plan assets among four ETFs.
- For July, I plan to maintain 100% allocation in the SPDR S&P 500 ETF due to its bullish alignment and strong performance in June. I will not invest in the other 3 ETFs due to various factors such as bearish alignment, trading inside areas of consolidation, and underperformance.
In this month’s article I outline why I will maintain the allocation of my pension plan assets which are 100% invested in the SPDR S&P 500 ETF ( SPY ). I will have no cash position. First, let me review my pension plan performance in June. The market, as measured by the S&P 500 index, gained 6.47% for the month, as can be seen in Chart 1 below. As for my pension plan assets, I just outperformed the index as my investment allocation gained 6.48%. My investment objective of preserving my capital was met, as I did make money. I did meet my second investment objective, which is beating the S&P 500 index. It was a good month for me. Table 1 below shows my returns and allocations for the month of June, and Table 2 below shows my returns for the past 12 months.
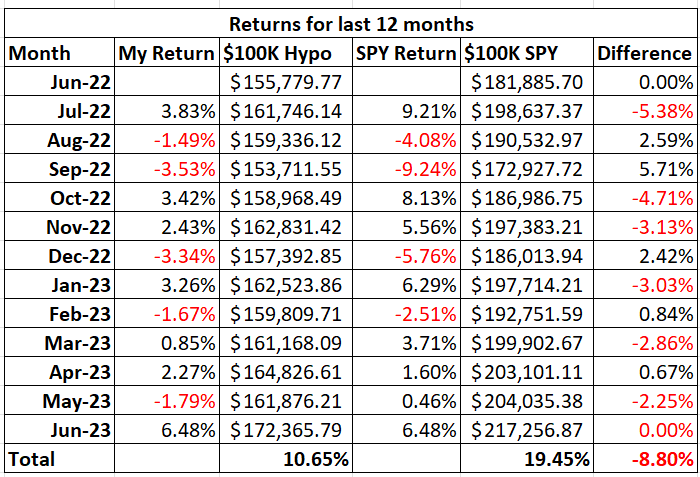
I have made changes to Table 2 below after I received a comment from a reader. Table 2 shows new columns to better (more accurately) reflect my investment results. The third column, $100K Hypo, is what my returns would be if I started my account with $100,000 in my first article of this series and followed the allocation recommendations from my articles. The fifth column, $100K SPY, shows the returns of just investing $100,000 and keeping it all allocated to SPY. The percentage returns in the last row show that my strategy returned 10.65% for the last 12 months, and simply investing in SPY would have returned 19.45% for the last 12 months. Therefore, I have underperformed SPY for the last 12 months by 8.80%.
Table 1 – Investment Returns For June
Author
Table 2 – Investment Returns Last 12 Months
To review the purpose of this series of articles, my retirement account only allows me to buy the following four ETFs: iShares Core U.S. Aggregate Bond ETF ( AGG ), SPDR S&P 500 ETF ( SPY ), Vanguard Extended Market Index Fund ( VXF ), and iShares MSCI EAFE ETF ( EFA ). I can also have my money in cash. The question is how to decide where and when to allocate money to these various ETFs.
I use my moving average crossover system combined with relative strength charts to determine how to allocate my pension plan assets. My moving average crossover system uses the 6 month and the 10- month exponential moving averages to identify which of the four ETFs are in position to be bought. If the 6-month moving average is above the 10-month moving average, then the ETF is a buy. I call this setup being in bullish alignment. When the 6-month moving average is below the 10-month moving average, the setup is referred to as a bearish alignment. When a bearish alignment happens, I don’t want to hold that asset. See Chart 1 below for a long-term look at the S&P 500 index using my moving average crossover system.
Chart 1 – Monthly SP 500 Index With 6/10 Moving Averages
You can see that the moving average crossover system provided some excellent long term buy and sell signals that would have allowed investors to capture long duration moves in the index; while avoiding costly drawdowns. Avoiding these costly drawdowns allows me to meet the objective of capital reservation.
I employ this strategy because I do not want to experience a large drawdown with my pension assets. During the 2008 - 2009 market crash, many people didn't even look at their retirement statements because they were afraid of what they would find. I submit that if those people would have used a market strategy like what I outline in this series of articles, they would have been able to avoid much of the decline during the bear market and consequently would have had less emotional stress during that time.
The following charts show the status of the ETFs that I am allowed to buy in my retirement account.
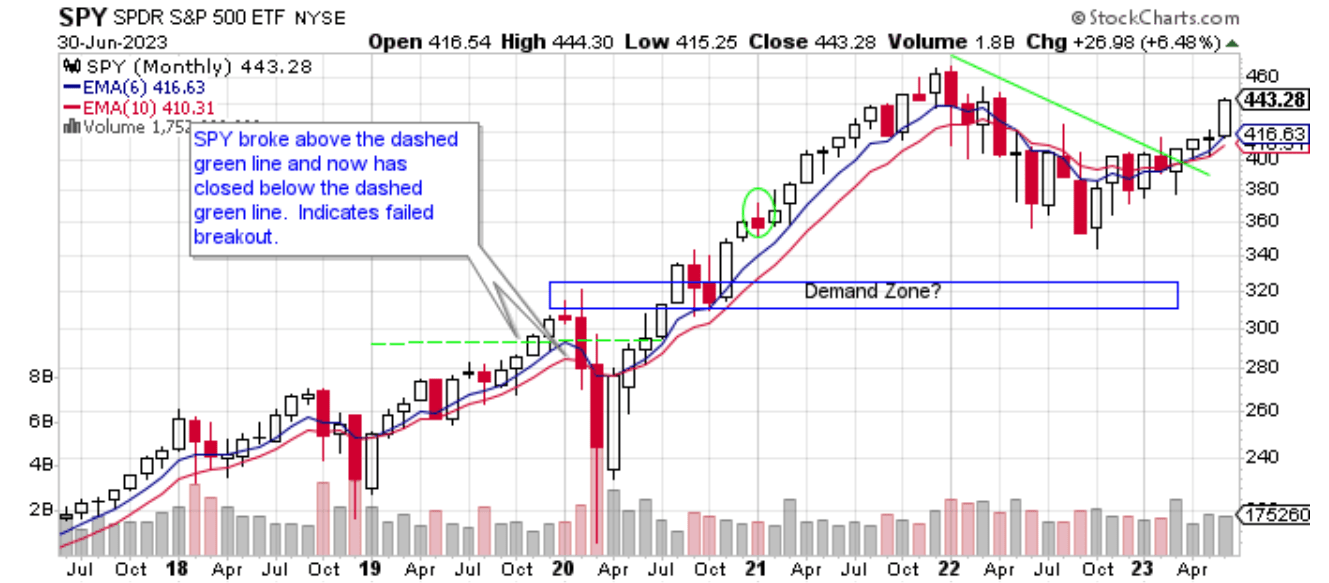
Chart 2 – Monthly SPY With 6/10 Moving Averages
Chart 2 shows that SPY gained 6.48% in June, which is a nice gain. The market maxim “sell in May and go away” did not apply last month. SPY had a very bullish candle, remains in bullish alignment, and has risen for four consecutive months. Large cap US equities are doing well and for that reason I will maintain my position of being 100% invested in SPY for the month of July.
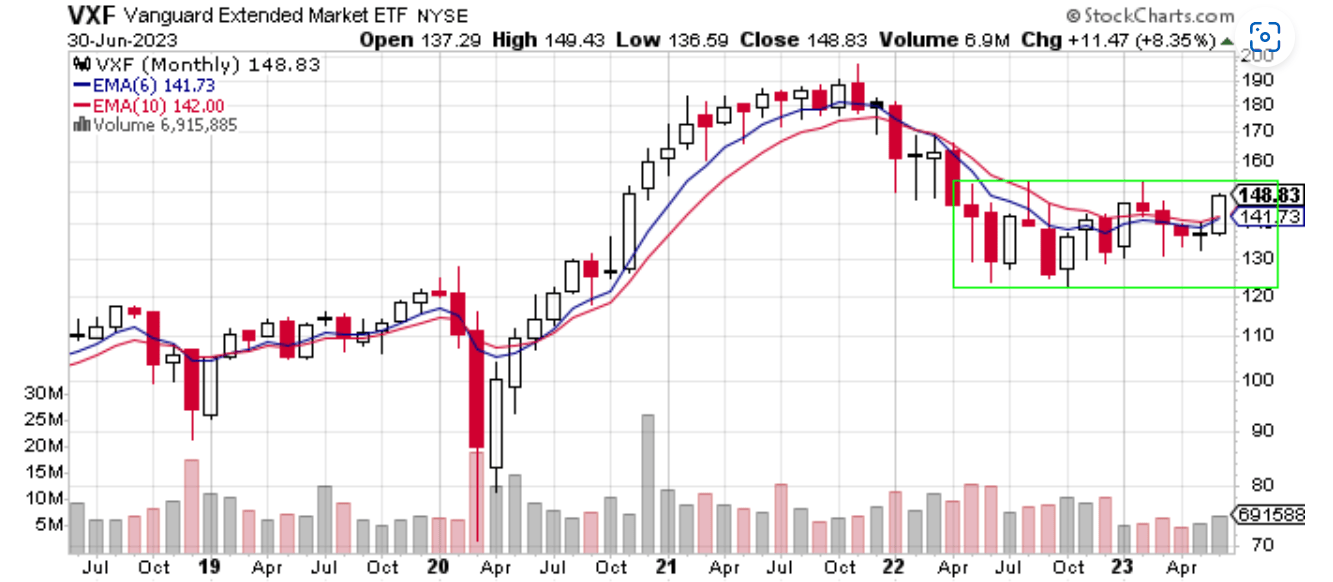
Chart 3 – Monthly VXF With 6/10 Moving Averages
Chart 3 shows that VXF gained 8.35% in June. This is the biggest gain of the ETFs that are in this article. Congratulations to those of you who hold VXF. VXF had a nice bullish candle on higher volume, which is bullish. VXF remains inside the area of consolidation, outlined by the green box, and is also not in bullish alignment yet. Due to those two conditions, VXF is not an investment candidate for me. I would like to see VXF break out above the green box, and then I would consider allocating some money into this position.
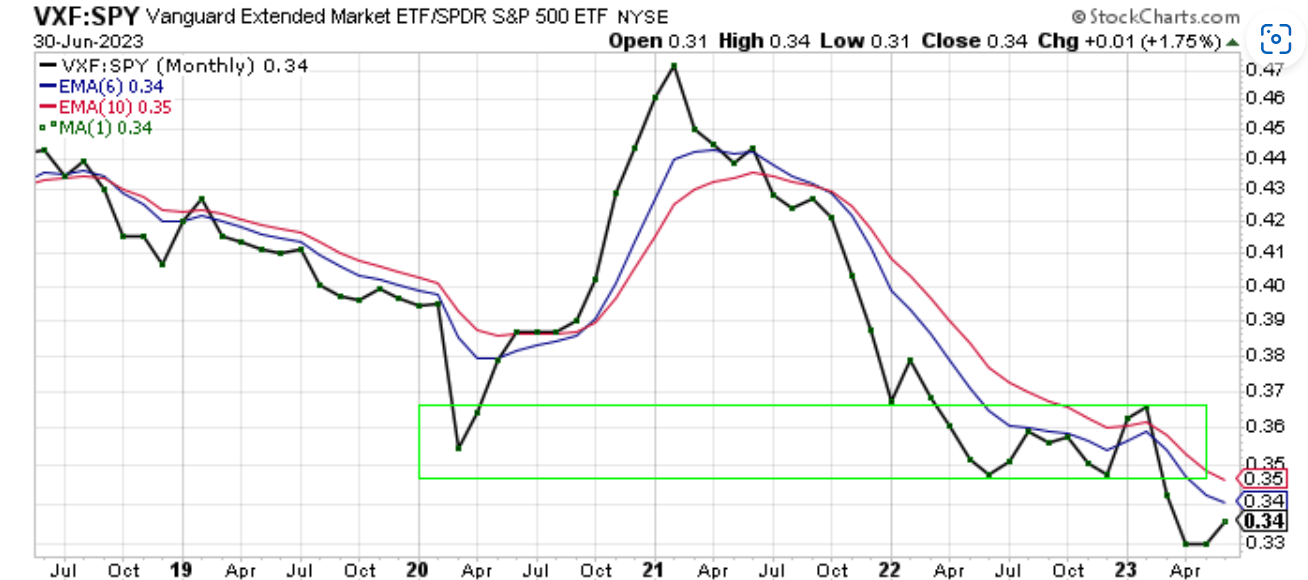
Chart 4 – Monthly VXF:SPY Relative Strength
The VXF:SPY ratio gained ground in June, as VXF outperformed SPY by 1.75%. The VXF:SPY ratio remains in bearish alignment, trading below both moving averages. I see no need to be in VXF in July.
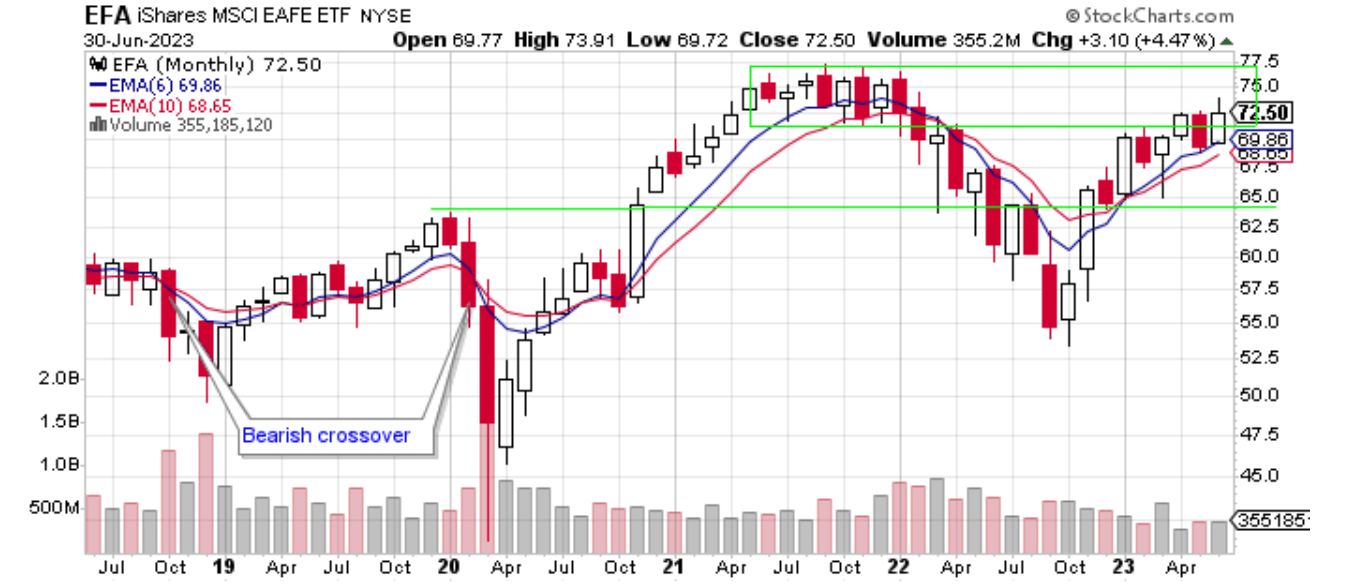
Chart 5 – Monthly EFA With 6/10 Moving Averages
Chart 5 shows EFA gained 4.47% in June and remains in bullish alignment. Last month, I wrote that the bearish engulfing candle on higher volume in May could be worrisome for EFA investors. That concern proved to be false. EFA bounced off its blue 6-month EMA and had a nice bullish candle. It is now back inside that area of supply or distribution. It will be interesting to see how price acts at this level this time. EFA is still trending higher, which means good things are probable in my opinion. EFA will not be part of my investment allocation in July.
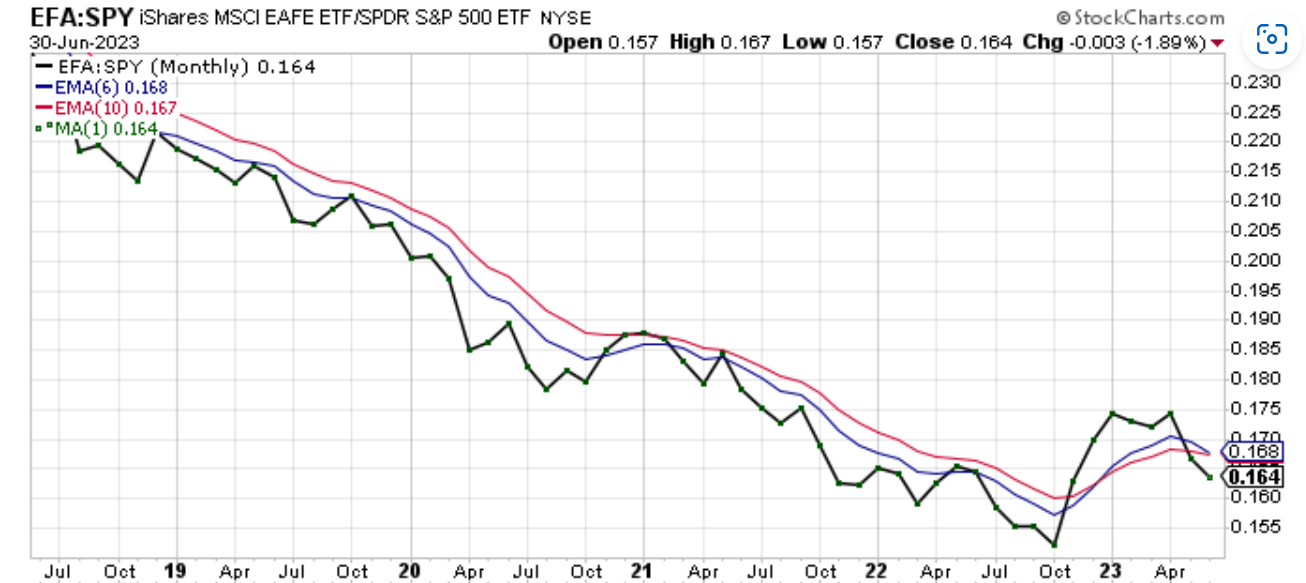
Monthly EFA:SPY Relative Strength
Chart 6 shows that the EFA:SPY ratio lost 1.89% in June. The ratio is trading below both moving averages and is not in a position of strength. Getting out of EFA last month proved to be a good decision.
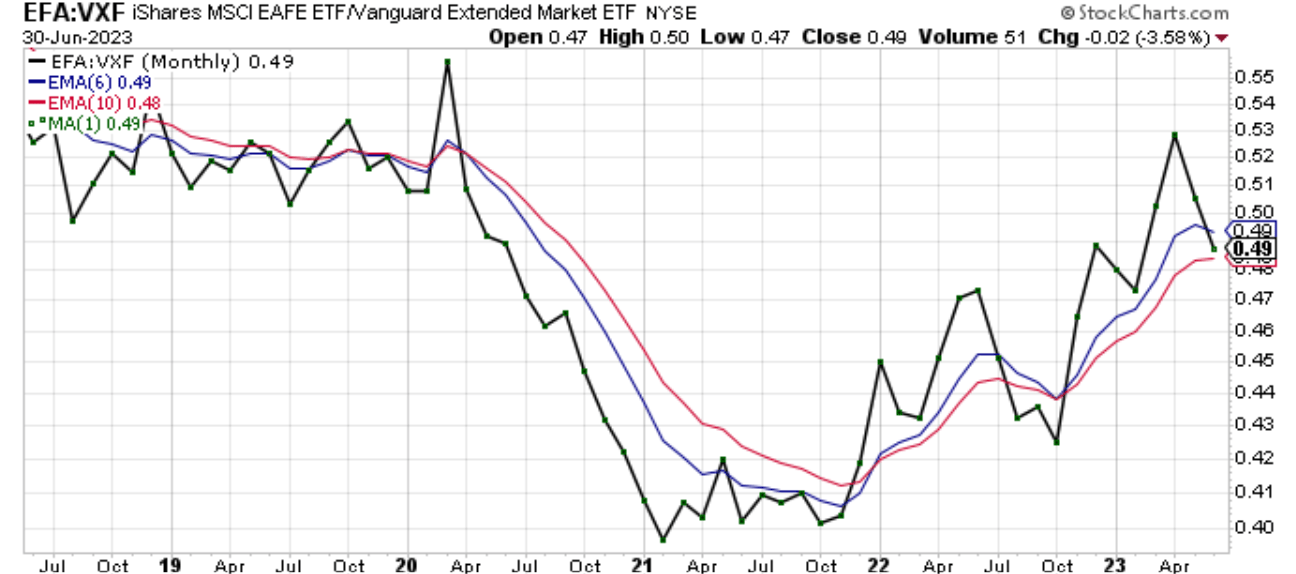
Chart 7 – Monthly EFA:VXF Relative Strength
Chart 7 shows that EFA underperformed VXF in June by 3.58%. The ratio no longer remains in bullish alignment, as price is now below the blue 6-month EMA. You can see that the trend has been up since early 2021. We’ll see if this uptrend continues.
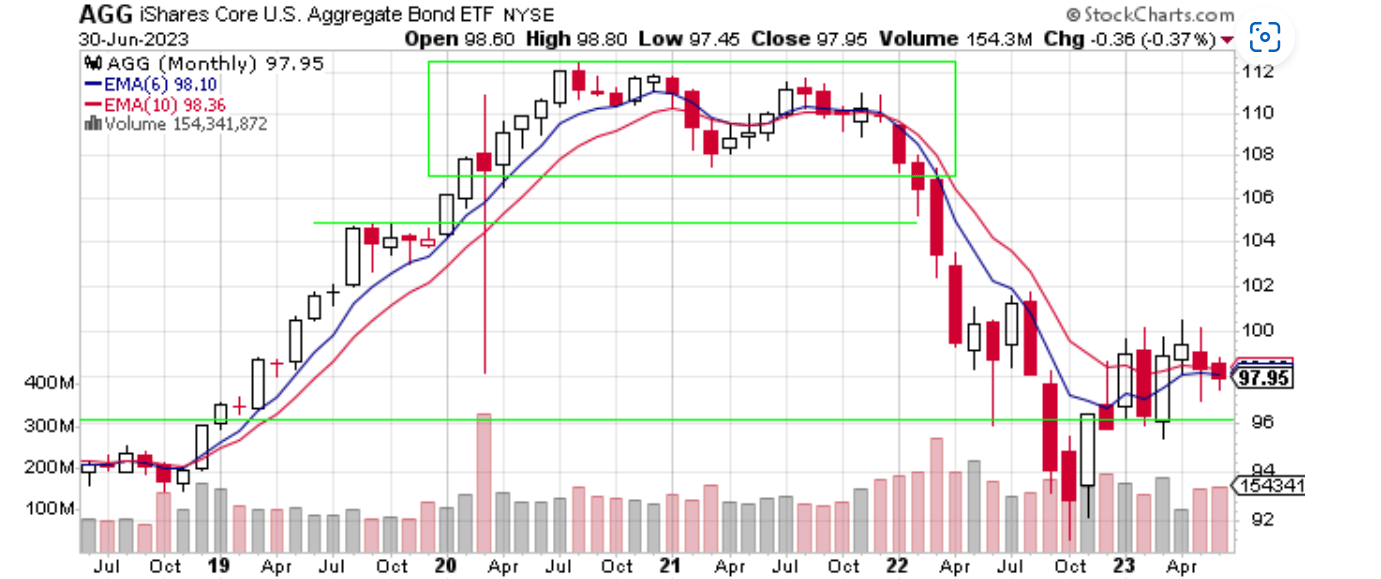
Chart 8 – Monthly AGG With 6/10 Moving Averages
Chart 8 shows that AGG lost 0.37% in June. AGG remains inside this area of consolidation. AGG is also trading below both moving averages. That does not bode well for AGG moving forward. Perhaps AGG will test the $93 level. I will have no exposure to AGG in July.
Chart 9 – Monthly AGG:SPY Relative Strength
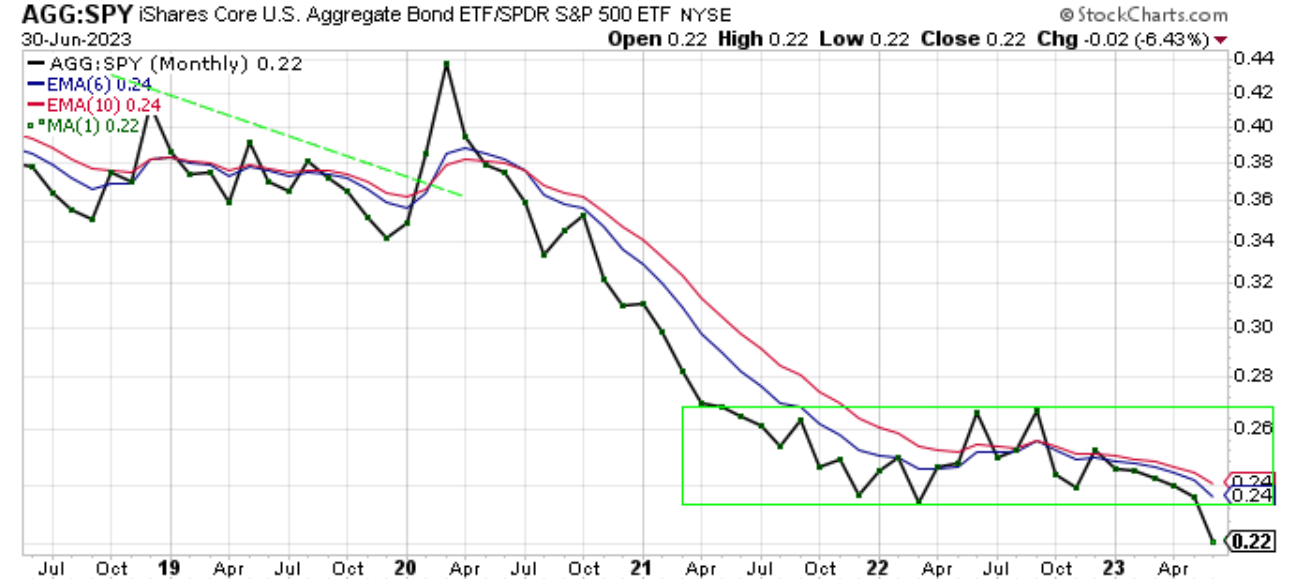
The AGG:SPY ratio in Chart 9 lost 6.43% as AGG underperformed SPY in June. The ratio is now trading below the area of consolidation.
In summary, June was bullish for me and equity investors. Only AGG didn’t record a gain in June. SPY and EFA remain in bullish alignment. VXF and AGG are trading inside areas of consolidation. SPY is still trending higher, and I will continue to follow that trend. I will have 100% of my pension assets allocated to SPY in July. I’ll see how things progress, and I’ll be prepared to change course next month if necessary.
For further details see:
My Current View Of The S&P 500 Index: July 2023 Edition (Technical Analysis)