VXF - My Current View Of The S&P 500 Index: October 2023 Edition (Technical Analysis)
2023-09-30 10:19:03 ET
Summary
- The author's pension plan assets outperformed the S&P 500 index in September, but did not meet the objective of preserving capital.
- I use a moving average crossover system to determine how to allocate my pension plan assets.
- All ETFs that I follow for this article lost money in September, but I will maintain my 100% allocation to SPY.
In this month's article, I outline why I will keep 100% of my pension plan assets invested in the SPDR S&P 500 ETF ( SPY ). I will have no cash position. First, let me review my pension plan performance in September. The market, as measured by the S&P 500 index, lost 4.87% for the month, as can be seen in Chart 1 below. As for my pension plan assets, I outperformed the index as my investment allocation lost 4.74%. My investment objective of preserving my capital was not met, as I did not make money. I did meet my second investment objective, which is beating the S&P 500 index. Table 1 below shows my returns and allocations for the month of September, and Table 2 below shows my returns for the past 12 months.
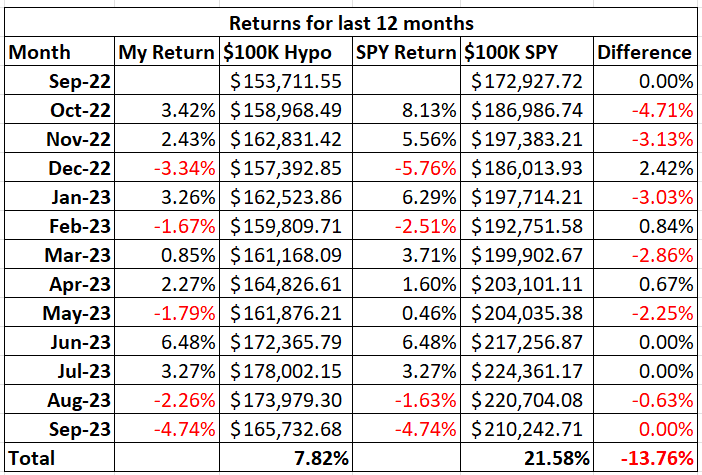
I have made changes to Table 2 below after I received a comment from a reader. Table 2 shows new columns to better (more accurately) reflect my investment results. The third column, $100K Hypo, is what my returns would be if I started my account with $100,000 in my first article of this series and followed the allocation recommendations from my articles. The fifth column, $100K SPY, shows the returns of just investing $100,000 and keeping it all allocated to SPY. The percentage returns in the last row show that my strategy returned 9.19% for the last 12 months, and simply investing in SPY would have returned 7.82% for the last 12 months. Therefore, I have underperformed SPY for the last 12 months by 13.76%.
Table 1 - Investment Returns for September
Author
Table 2 - Investment Returns Last 12 Months
To review the purpose of this series of articles, my retirement account only allows me to buy the following four ETFs: iShares Core U.S. Aggregate Bond ETF ( AGG ), SPDR S&P 500 ETF ( SPY ), Vanguard Extended Market Index Fund ( VXF ), and iShares MSCI EAFE ETF ( EFA ). I can also have my money in cash. The question is how to decide where and when to allocate money to these various ETFs.
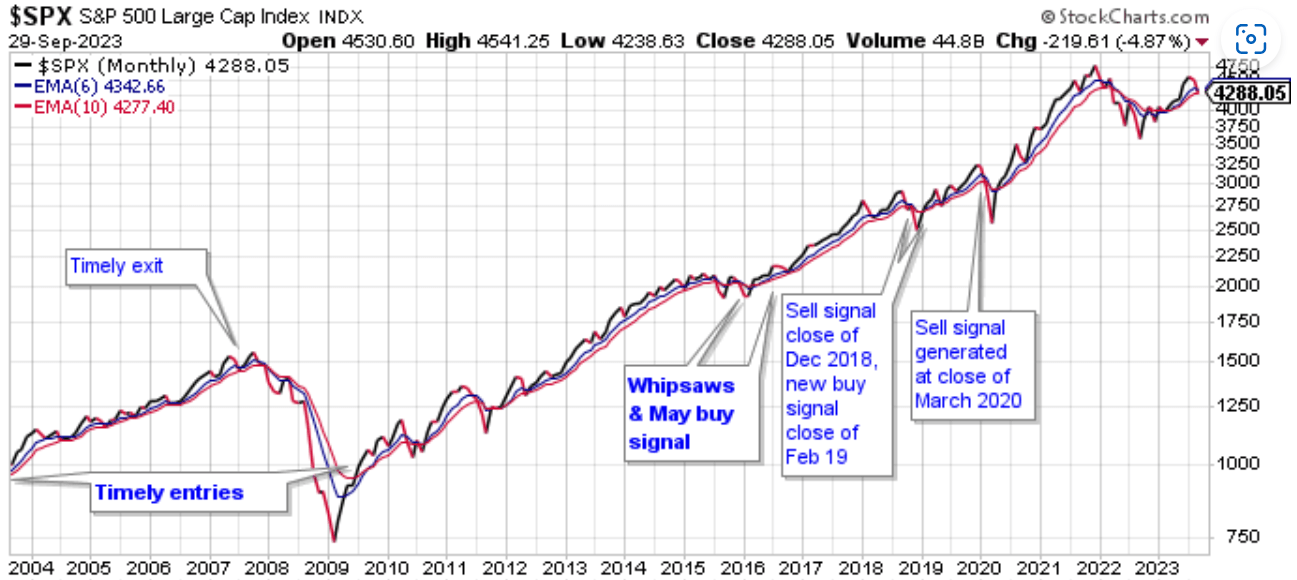
I use my moving average crossover system combined with relative strength charts to determine how to allocate my pension plan assets. My moving average crossover system uses the 6 month and the 10- month exponential moving averages to identify which of the four ETFs are in position to be bought. If the 6-month moving average is above the 10-month moving average, then the ETF is a buy. I call this setup being in bullish alignment. When the 6-month moving average is below the 10-month moving average, the setup is referred to as a bearish alignment. When a bearish alignment happens, I don't want to hold that asset. See Chart 1 below for a long-term look at the S&P 500 index using my moving average crossover system.
Chart 1 - Monthly SP 500 Index with 6/10 Moving Averages
You can see that the moving average crossover system provided some excellent long term buy and sell signals that would have allowed investors to capture long duration moves in the index; while avoiding costly drawdowns. Avoiding these costly drawdowns allows me to meet the objective of capital reservation.
I employ this strategy because I do not want to experience a large drawdown with my pension assets. During the 2008 - 2009 market crash, many people didn't even look at their retirement statements because they were afraid of what they would find. I submit that if those people had used a market strategy like what I outline in this series of articles, they would have been able to avoid much of the decline during the bear market and consequently would have had less emotional stress during that time.
The following charts show the status of the ETFs that I am allowed to buy in my retirement account.
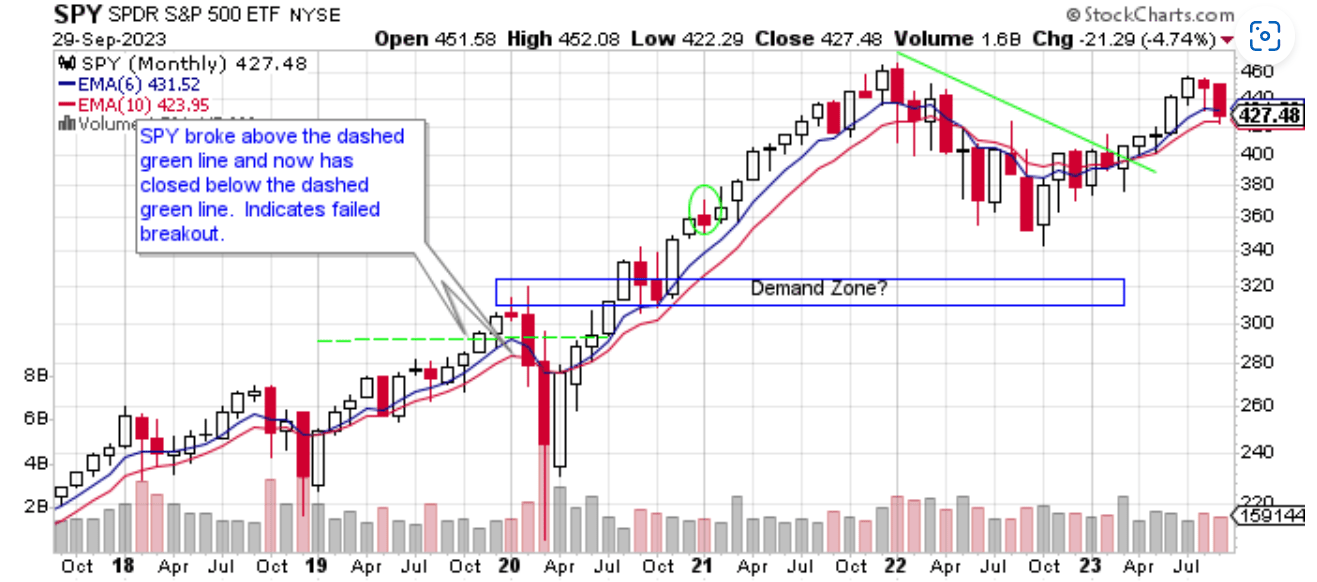
Chart 2 - Monthly SPY with 6/10 Moving Averages
Chart 2 shows that SPY lost 4.74% in September. It was an ugly bearish candle. SPY closed below the blue 6-month moving average while bouncing off the red 10-month moving average. If you're bullish on SPY, you like the fact that the volume for the month was lower than the previous month. You also like that SPY tested the red 10-month moving average and then closed above that moving average. SPY is in a tenuous spot. It is between the two moving averages, and both moving averages are now starting to roll over. It will be interesting to see how SPY responds in October. I am cautiously optimistic and will maintain my allocation to SPY in October.
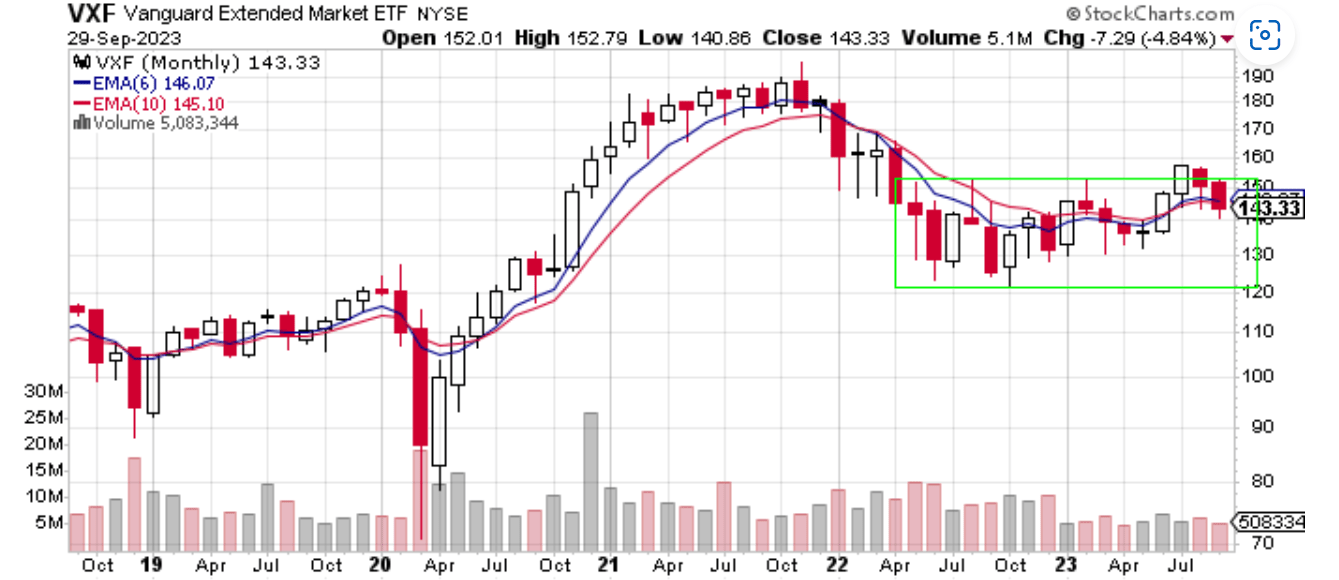
Chart 3 - Monthly VXF with 6/10 Moving Averages
Chart 3 shows that VXF lost 4.84% in September. Of all the ETFs that I follow for this article, it lost the most. With its poor performance in September, VXF is now below both of its moving averages. VXF is now back inside the green consolidation box. It appears that VXF has completed a false breakout, which is when VXF broke above the green box back in August and then quickly returned inside of the breakout area. This is considered a bearish condition.
Chart 4 - Monthly VXF:SPY Relative Strength
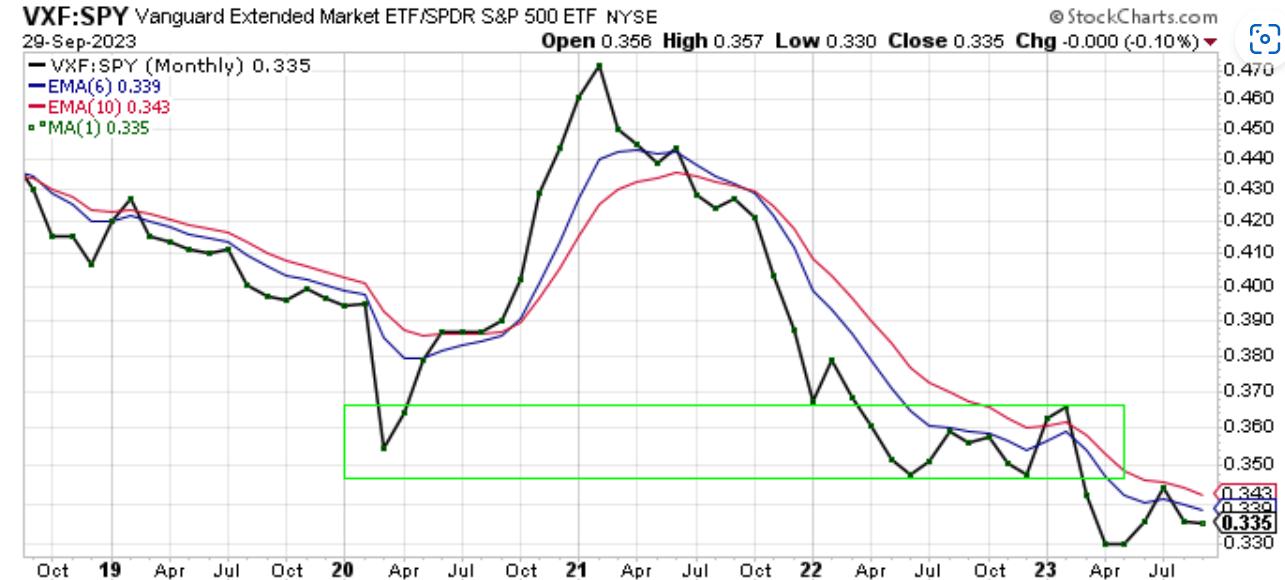
The VXF:SPY ratio lost 0.10% in September, as shown in Chart 4. The ratio is in bearish alignment, telling me that there is no need to allocate money to VXF over SPY at this time.
Chart 5 - Monthly EFA with 6/10 Moving Averages
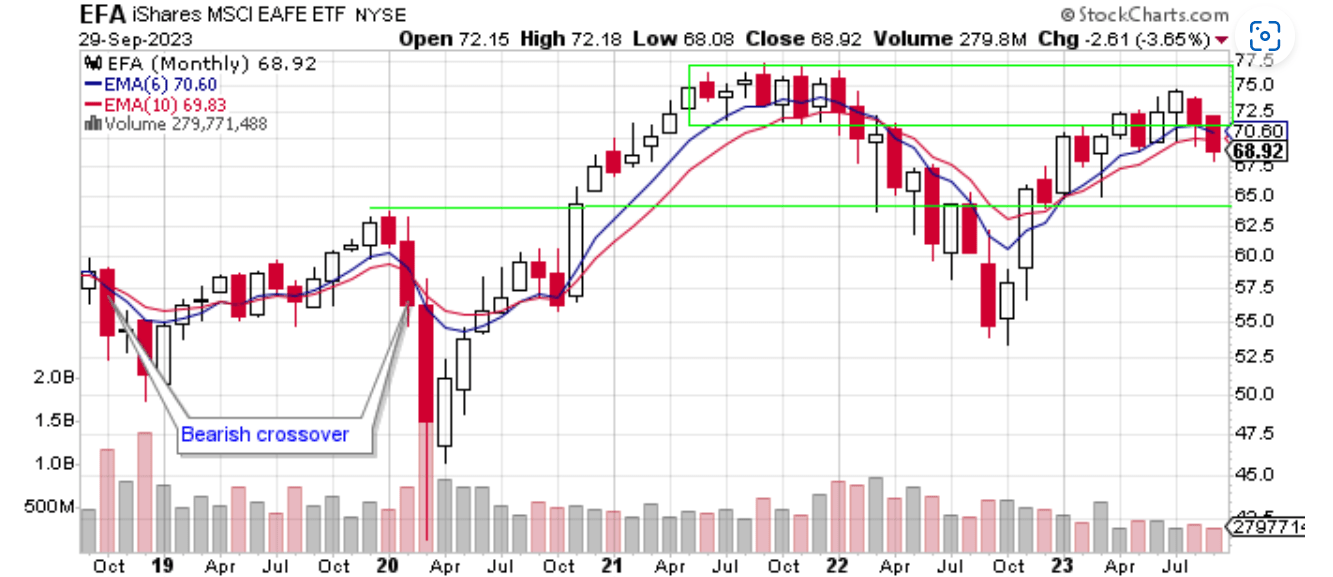
Chart 5 shows EFA lost 3.65% in September. The candle was a pure bearish candle. EFA closed below both of its moving averages, and the blue 6-month moving average is now rolling over. This is not a bullish look. EFA will not be part of my investment allocation in October.
Chart 6 - Monthly EFA:SPY Relative Strength
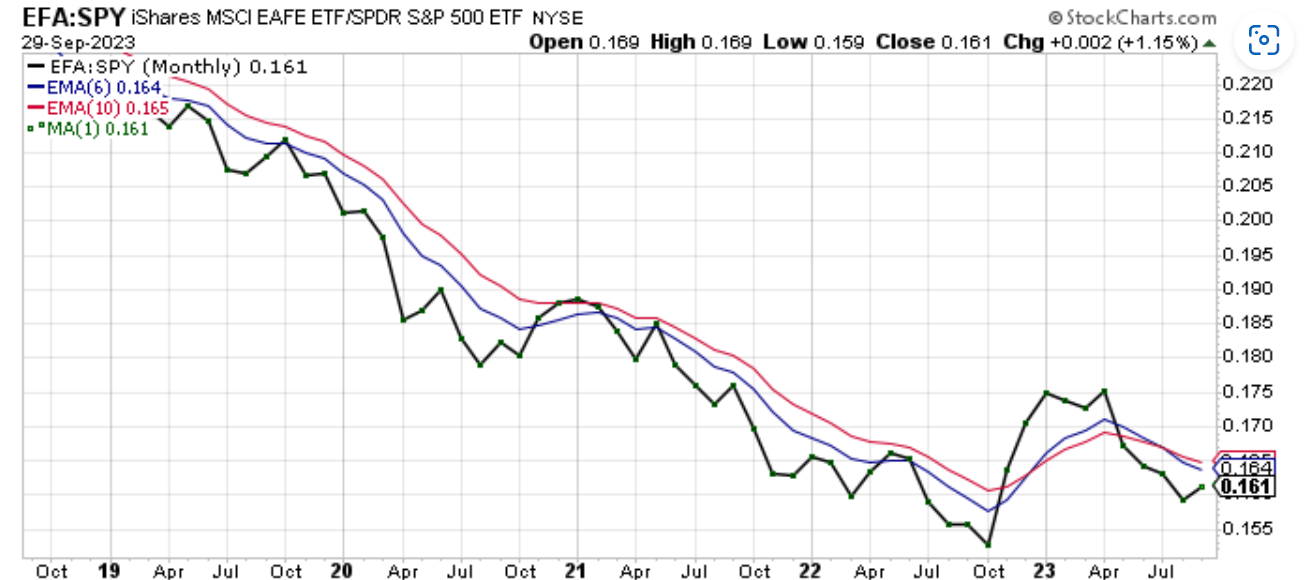
Chart 6 shows that the EFA:SPY ratio gained 1.15% in September. The ratio trades below both moving averages and is not in a position of strength. The ratio is in bearish alignment. On the positive side of things, the ratio may be putting in a higher low. Still, there is no reason to be in EFA versus SPY.
Chart 7 - Monthly EFA:VXF Relative Strength
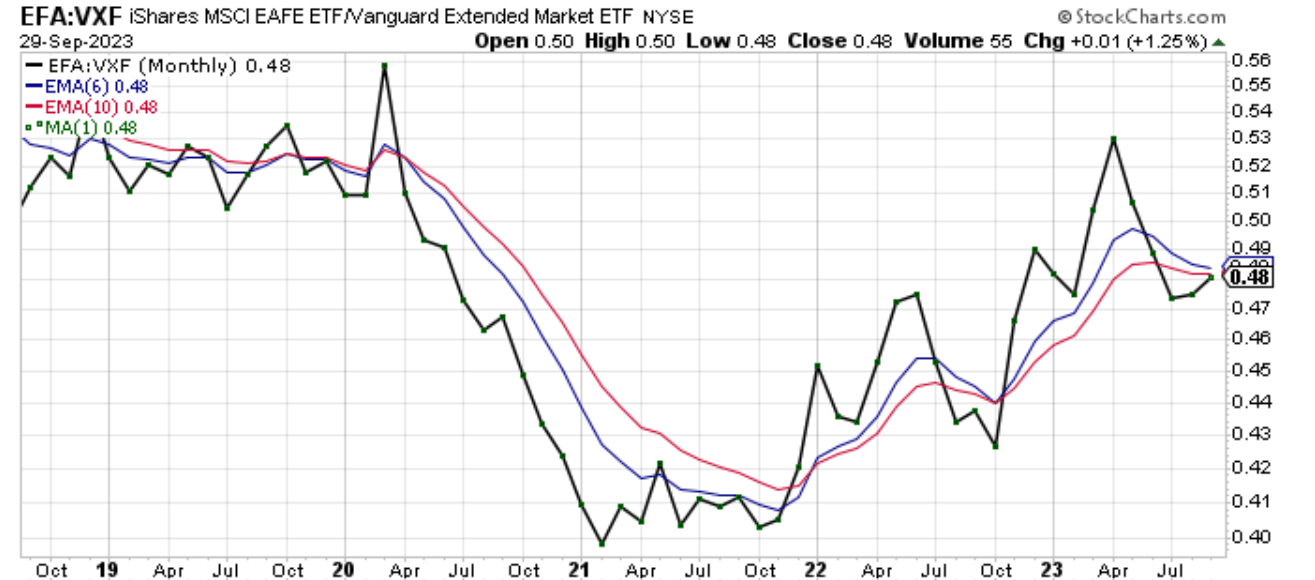
Chart 7 shows that EFA outperformed VXF in September by 1.25%. The ratio is below both moving averages, and those moving averages are sloping downward. This says that EFA is an inferior investment to VXF now. On the positive side, the chart shows an upward trend in the ratio.
Chart 8 - Monthly AGG with 6/10 Moving Averages
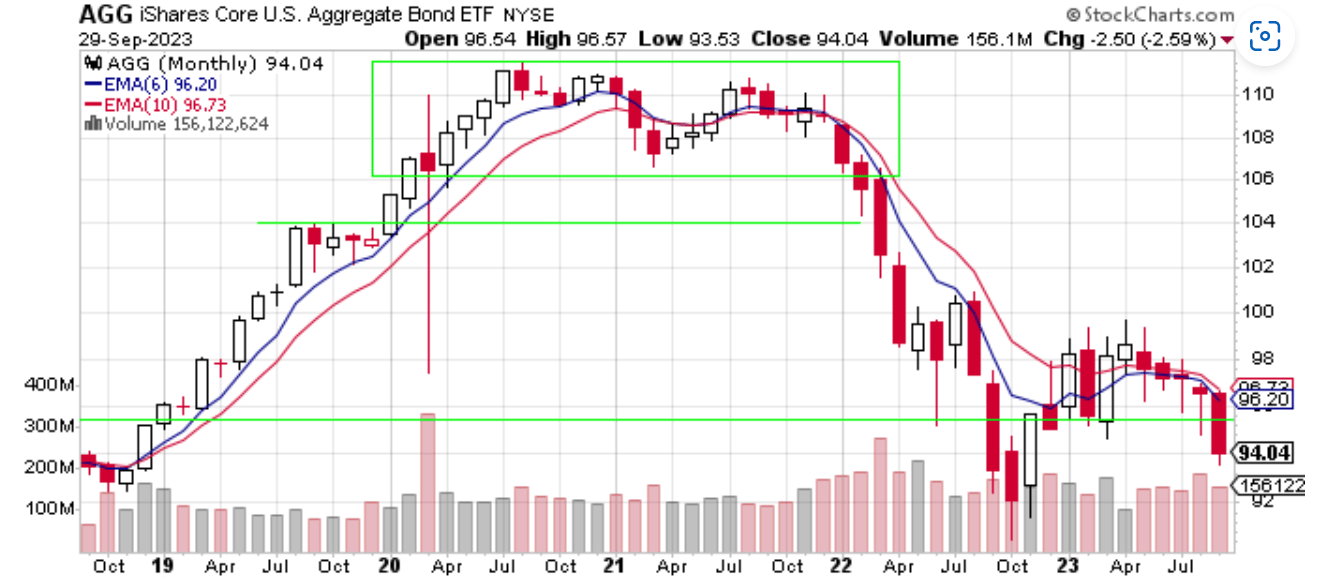
Chart 8 shows that AGG lost 2.59% in September. Every ETF in this article lost money in September. AGG is now below the area of consolidation going back to May 2022. AGG trades below both moving averages and is in bearish alignment. That does not bode well for AGG moving forward. Perhaps AGG will test the October lows of $91.50 level. I will have no exposure to AGG in October.
Chart 9 - Monthly AGG:SPY Relative Strength
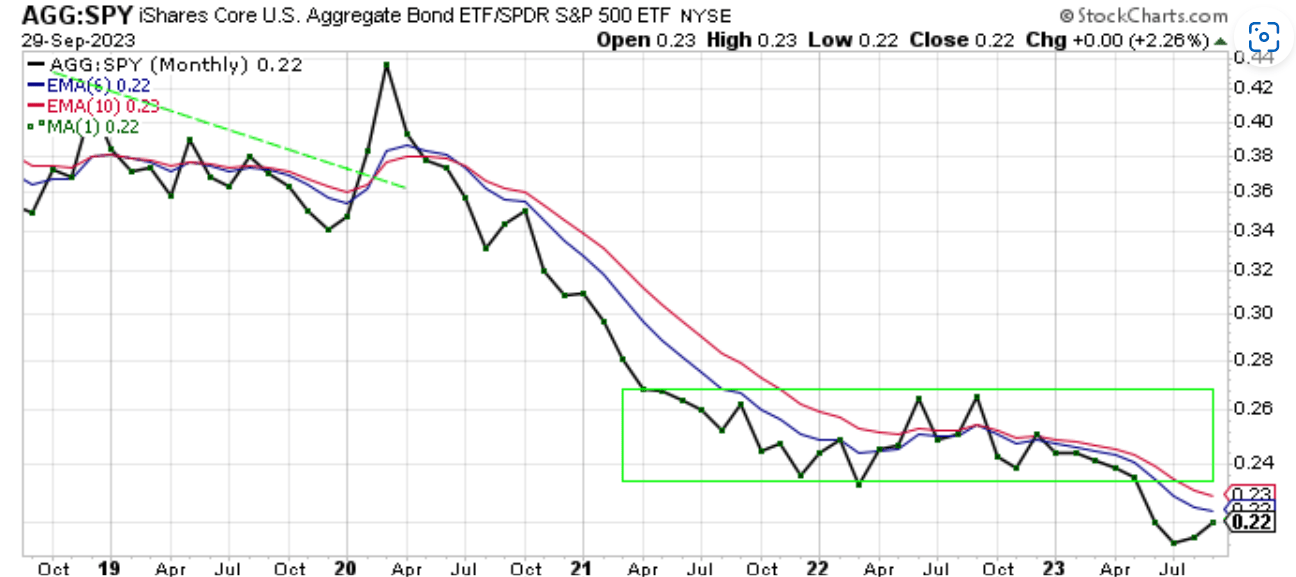
The AGG:SPY ratio in Chart 9 gained 2.26% as AGG outperformed SPY in September. The ratio is now trading below the area of consolidation, as shown by the green box.
In summary, September was a bad month for me and equity investors in general. I lost money for the month, yet I outperformed the major index. Every ETF that I follow for this article lost money in September. SPY remains above its 10-month moving average, while EFA, VXF, and AGG closed below their 10-month moving averages. SPY remains above its 10-month moving average, so I am staying with my 100% allocation to SPY.
For further details see:
My Current View Of The S&P 500 Index: October 2023 Edition (Technical Analysis)