VXF - My Current View Of The S&P 500 Index: September 2023 Edition
2023-09-01 11:50:23 ET
Summary
- The author plans to change their pension plan allocation to be 100% invested in the SPDR S&P 500 ETF (SPY).
- The author's investment performance in August underperformed the S&P 500 index, failing to meet their investment objectives.
- The author uses a moving average crossover system to determine allocation and will allocate 100% to SPY in September.
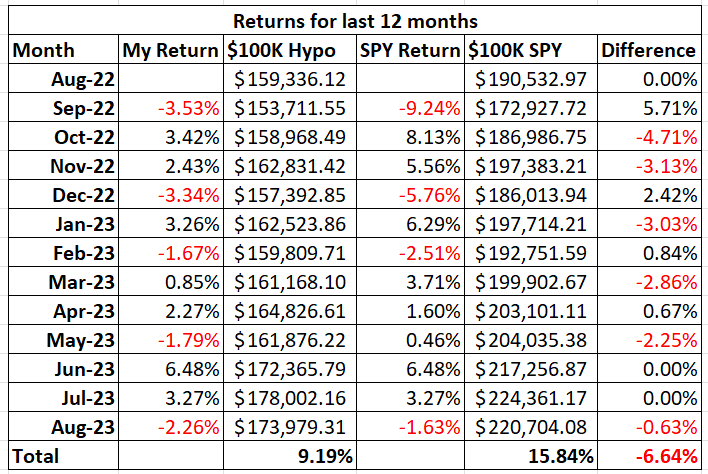
In this month’s article, I outline why I will change my allocation of my pension plan assets to be 100% invested in the SPDR S&P 500 ETF ( SPY ). I will have no cash position. First, let me review my pension plan performance in August. The market, as measured by the S&P 500 index, lost 1.77% for the month, as can be seen in Chart 1 below. As for my pension plan assets, I underperformed the index as my investment allocation lost 2.26%. My investment objective of preserving my capital was not met, as I did not make money. I did not meet my second investment objective, which is beating the S&P 500 index. It was not a good month for me. Table 1 below shows my returns and allocations for the month of August, and Table 2 below shows my returns for the past 12 months.
I have made changes to Table 2 below after I received a comment from a reader. Table 2 shows new columns to better (more accurately) reflect my investment results. The third column, $100K Hypo, is what my returns would be if I started my account with $100,000 in my first article of this series and followed the allocation recommendations from my articles. The fifth column, $100K SPY, shows the returns of just investing $100,000 and keeping it all allocated to SPY. The percentage returns in the last row show that my strategy returned 9.19% for the last 12 months, and simply investing in SPY would have returned 15.84% for the last 12 months. Therefore, I have underperformed SPY for the last 12 months by 6.64%.
Table 1 – Investment Returns for August
Author
Table 2 – Investment Returns Last 12 Months
To review the purpose of this series of articles, my retirement account only allows me to buy the following four ETFs: iShares Core U.S. Aggregate Bond ETF ( AGG ), SPDR S&P 500 ETF ( SPY ), Vanguard Extended Market Index Fund ( VXF ), and iShares MSCI EAFE ETF ( EFA ). I can also have my money in cash. The question is how to decide where and when to allocate money to these various ETFs.
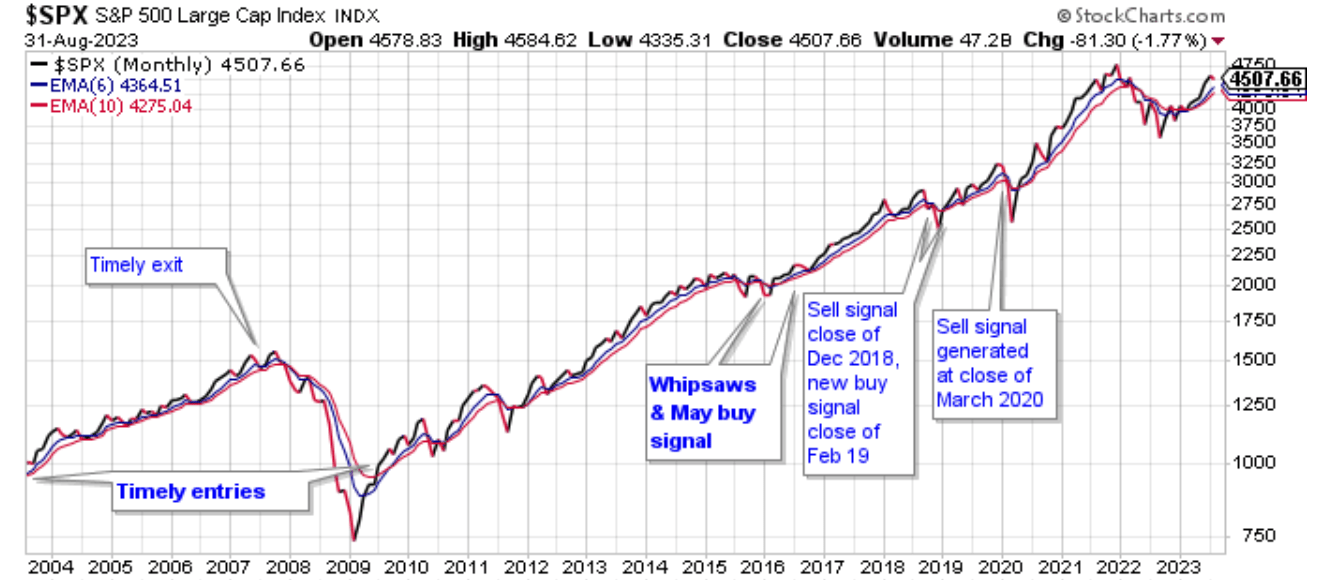
I use my moving average crossover system combined with relative strength charts to determine how to allocate my pension plan assets. My moving average crossover system uses the 6 month and the 10- month exponential moving averages to identify which of the four ETFs are in position to be bought. If the 6-month moving average is above the 10-month moving average, then the ETF is a buy. I call this setup being in bullish alignment. When the 6-month moving average is below the 10-month moving average, the setup is referred to as a bearish alignment. When a bearish alignment happens, I don’t want to hold that asset. See Chart 1 below for a long-term look at the S&P 500 index using my moving average crossover system.
Chart 1 – Monthly SP 500 Index with 6/10 Moving Averages
You can see that the moving average crossover system provided some excellent long term buy and sell signals that would have allowed investors to capture long duration moves in the index; while avoiding costly drawdowns. Avoiding these costly drawdowns allows me to meet the objective of capital reservation.
I employ this strategy because I do not want to experience a large drawdown with my pension assets. During the 2008 - 2009 market crash, many people didn't even look at their retirement statements because they were afraid of what they would find. I submit that if those people would have used a market strategy like what I outline in this series of articles, they would have been able to avoid much of the decline during the bear market and consequently would have had less emotional stress during that time.
The following charts show the status of the ETFs that I am allowed to buy in my retirement account.
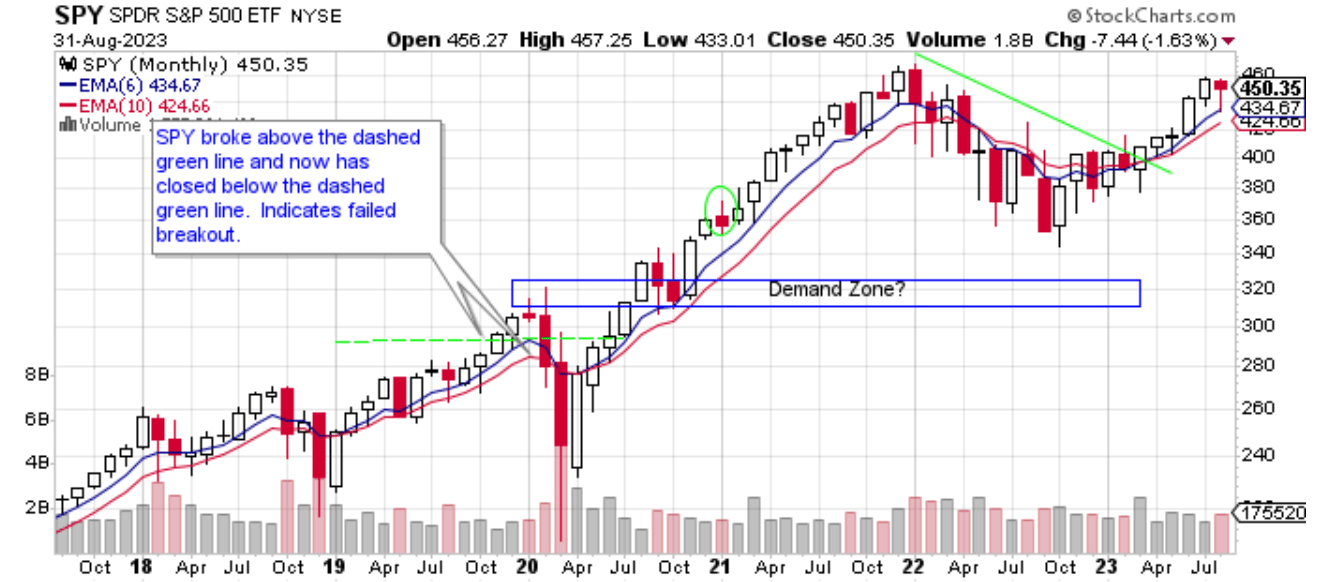
Chart 2 – Monthly SPY with 6/10 Moving Averages
Chart 2 shows that SPY lost 1.63% in August, ending its multi-month winning streak. SPY finished the month with a hanging man candle; so named because the candle resembles the look of a man that is hanging. This is considered a bearish candle, especially since it comes after a multi-month rally. SPY remains in bullish alignment and bounced off its blue 6-month moving average, giving the bulls some hope. I will allocate 100% of my pension fund assets to SPY in September because SPY is in bullish alignment and SPY is outperforming all other ETFs in this article.
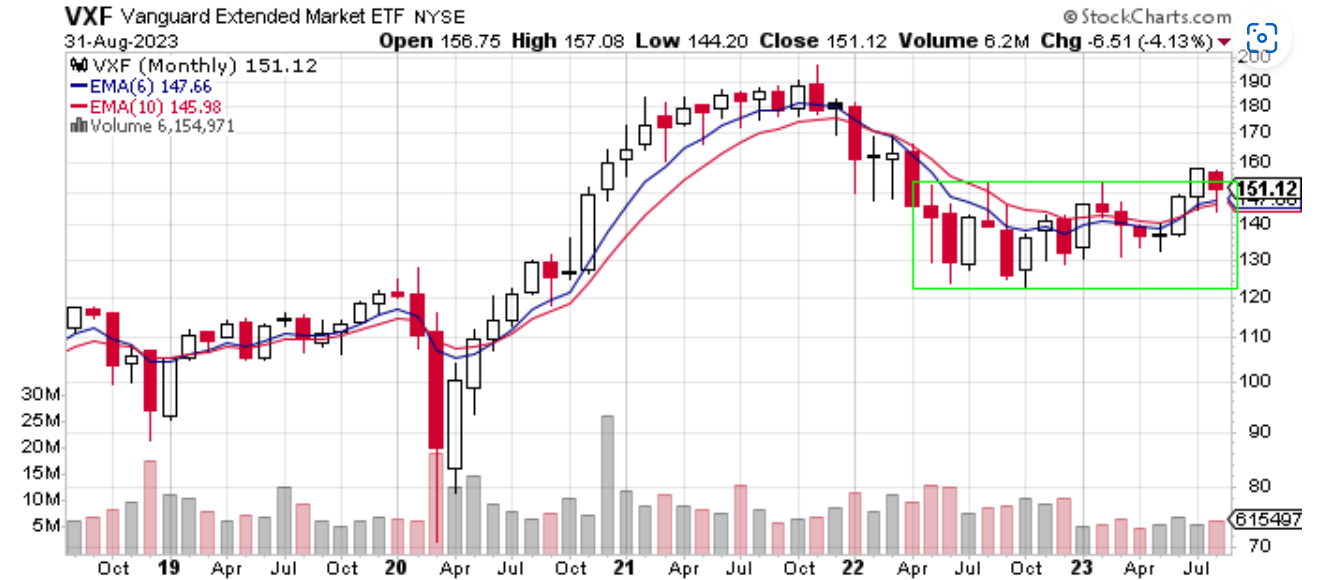
Chart 3 – Monthly VXF with 6/10 Moving Averages
Chart 3 shows that VXF lost 4.13% in August. Of all the ETFs that I follow for this article, it lost the most. Naturally, it was the ETF that I added to at the beginning of August. Oh, well. VXF remains above both of its moving averages, putting it in bullish alignment. VXF is trying to trend higher. It closed off its lows for the month on slightly higher volume. That is good. It did fall back into that area of consolidation, which is not the best news. We’ll see if the bull trend in VXF continues or if it fails. To be determined.
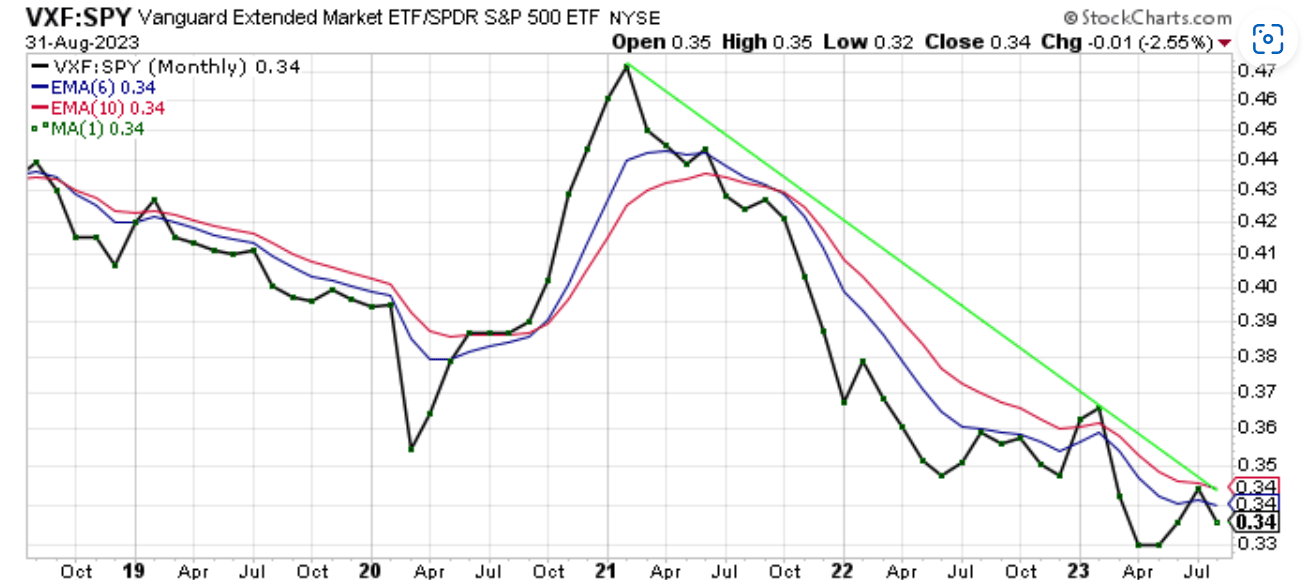
Chart 4 – Monthly VXF:SPY Relative Strength
The VXF:SPY ratio lost 2.55% in August, as shown in Chart 4. This loss is the reason I underperformed the S&P 500 index for August. At the beginning of the month, I put 25% of my assets in VXF because it was in bullish alignment and the VXF:SPY ratio closed above its blue 6-month moving average. I tried to jump the gun, so to speak. The ratio was and still is clearly in bearish alignment. I should have focused on that more than the close above the 6-month moving average. I was wrong to allocate money to VXF. Being wrong is okay. Staying wrong is a mistake. I will change my allocation in September to 0% VXF and 100% SPY. I will try to learn from this lesson.
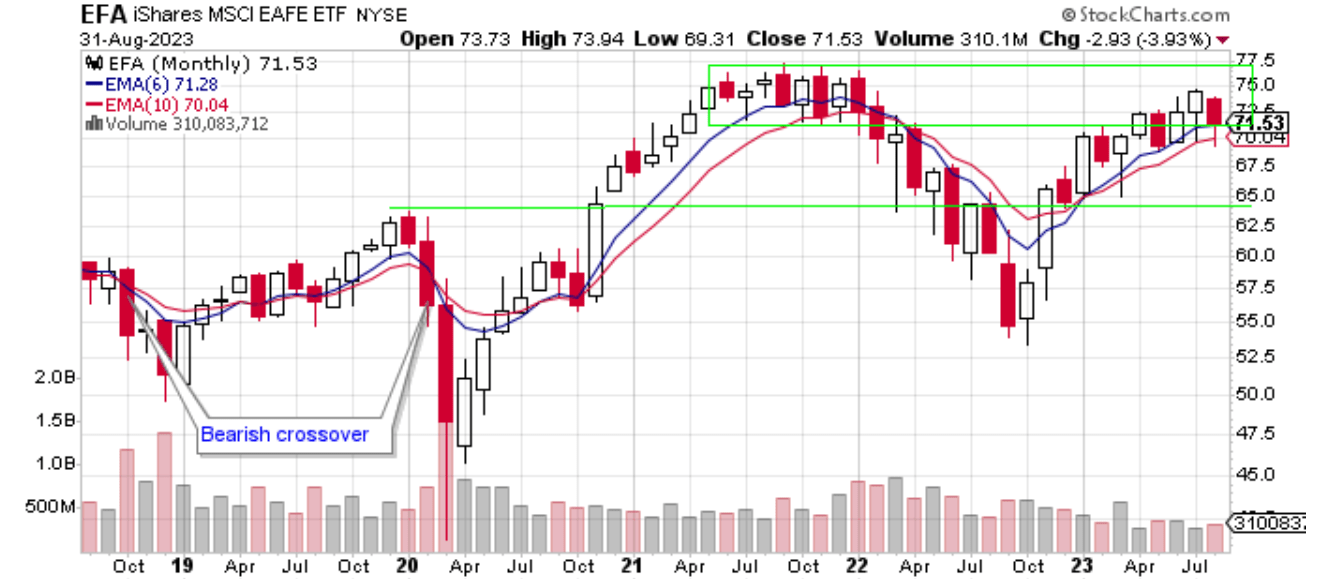
Chart 5 – Monthly EFA with 6/10 Moving Averages
Chart 5 shows EFA lost 3.93% in August and remains in bullish alignment. It is still inside that area of supply or distribution outlined by the green box. It will be interesting to see how prices act at this level this time. EFA is still trending higher, which means good things are probable in my opinion. EFA will not be part of my investment allocation in September.
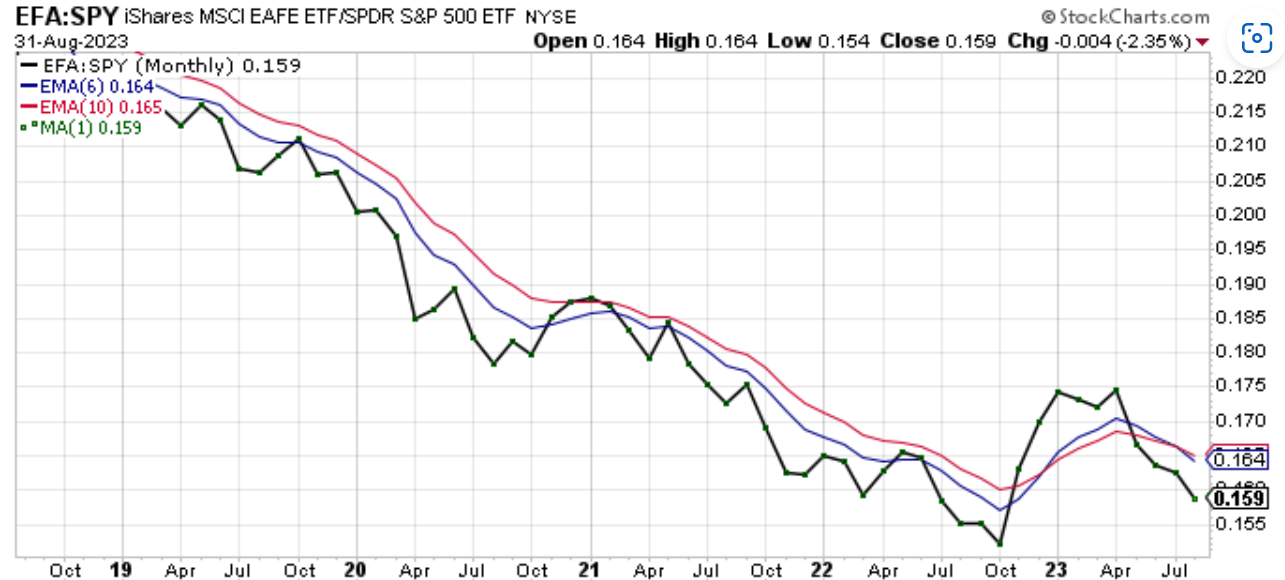
Chart 6 - Monthly EFA:SPY Relative Strength
Chart 6 shows that the EFA:SPY ratio lost 2.35% in August. The ratio trades below both moving averages and is not in a position of strength. The ratio is now in bearish alignment. There is no reason to be in EFA versus SPY now.
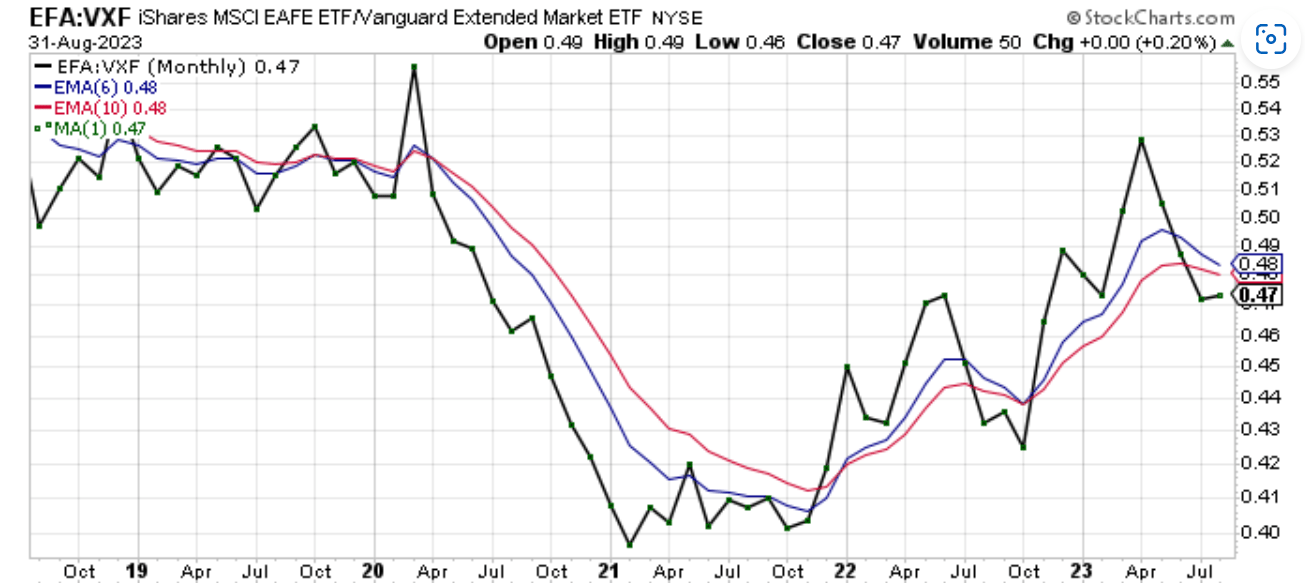
Chart 7 – Monthly EFA:VXF Relative Strength
Chart 7 shows that EFA outperformed VXF in August by 0.20%. The ratio is below both moving averages, and those moving averages are turning lower. This says that EFA is an inferior investment to VXF now.
Chart 8 – Monthly AGG with 6/10 Moving Averages
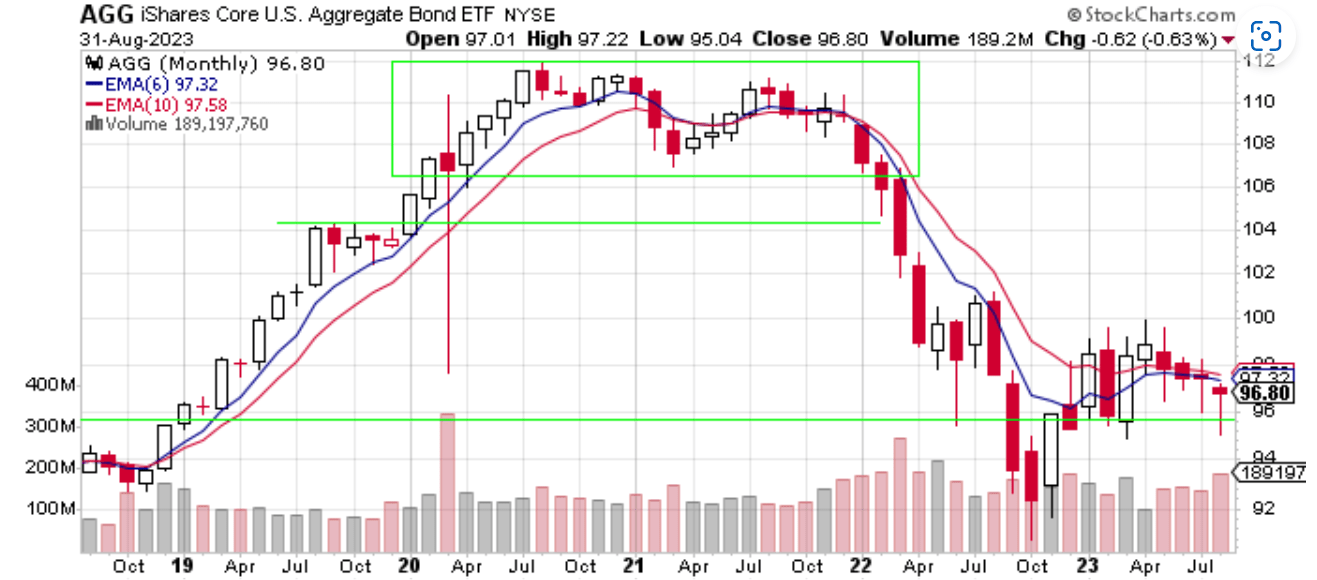
Chart 8 shows that AGG lost 0.63% in August. AGG remains inside this area of consolidation going back to May 2022. AGG trades below both moving averages. That does not bode well for AGG moving forward. Perhaps AGG will test the $93 level. I will have no exposure to AGG in September.
Chart 9 – Monthly AGG:SPY Relative Strength
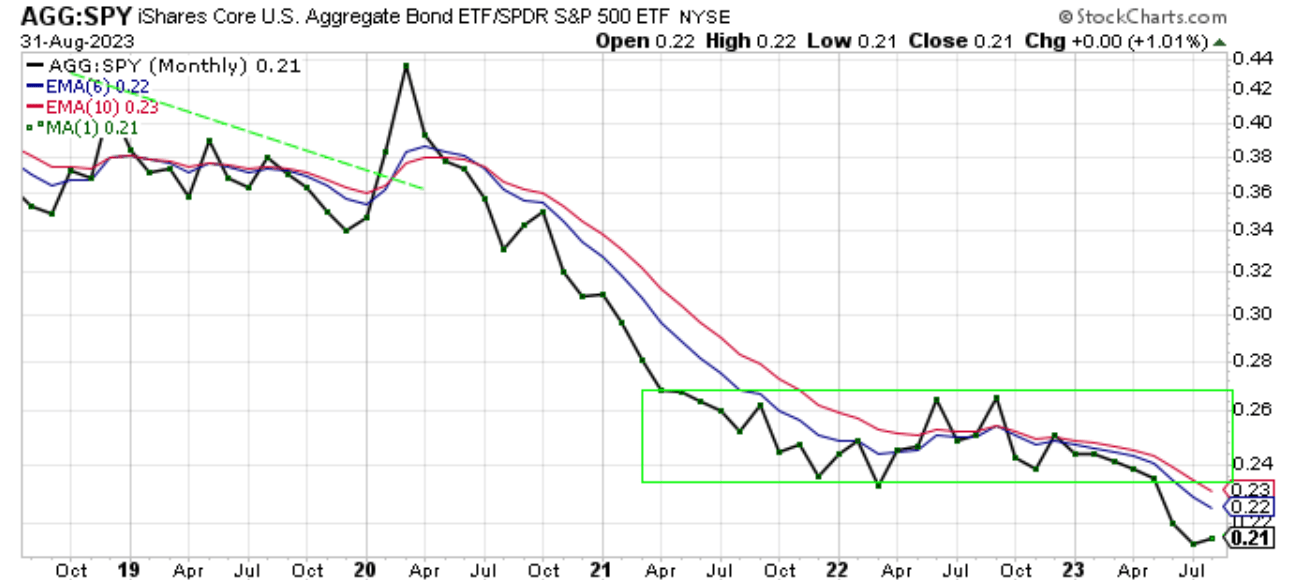
The AGG:SPY ratio in Chart 9 gained 1.01% as AGG underperformed SPY in August. The ratio is now trading below the area of consolidation.
In summary, August was a poor month for me. I lost money for the month, and I underperformed the major index. Every ETF that I follow for this article lost money in August. All the equity ETFs remain in bullish alignment despite their losses for the month. SPY, EFA, and VXF are in bullish alignment. SPY remains strong as it approaches its previous all-time high. Because of its strength, I am allocating 100% of my funds to SPY. Hopefully I learned my lesson this month. It is hard to beat SPY. Before I allocate money away from SPY to another ETF, that ETF must demonstrate outperformance. You can’t see outperformance of SPY in Charts 4, 6, and 9. Some day that will change, but for now I will stay with SPY.
For further details see:
My Current View Of The S&P 500 Index: September 2023 Edition