ALIZY - My Dividend Stock Portfolio: August 2022 Update - 102 Holdings With 30 Buys And 1 Sale
Summary
- Inflation and (expected) actions by the Federal Reserve continue to dominate market movements.
- Markets remain very volatile following record inflation readings paired with an aggressive Fed and negative consumer sentiment. US inflation is softening in July but continues to grow in Europe.
- US-China relations remain tense but so far don't really seem to impact the stock markets as long as no further escalation occurs.
- My dividend income amounted to a YTD low of $337 which is up 3% Y/Y and up 2% sequentially.
- Gifted Working Time in 2022: Around 146 hours, or 18.2 days, of active work have been replaced with passive income in 2022 already.
Portfolio Changes in August
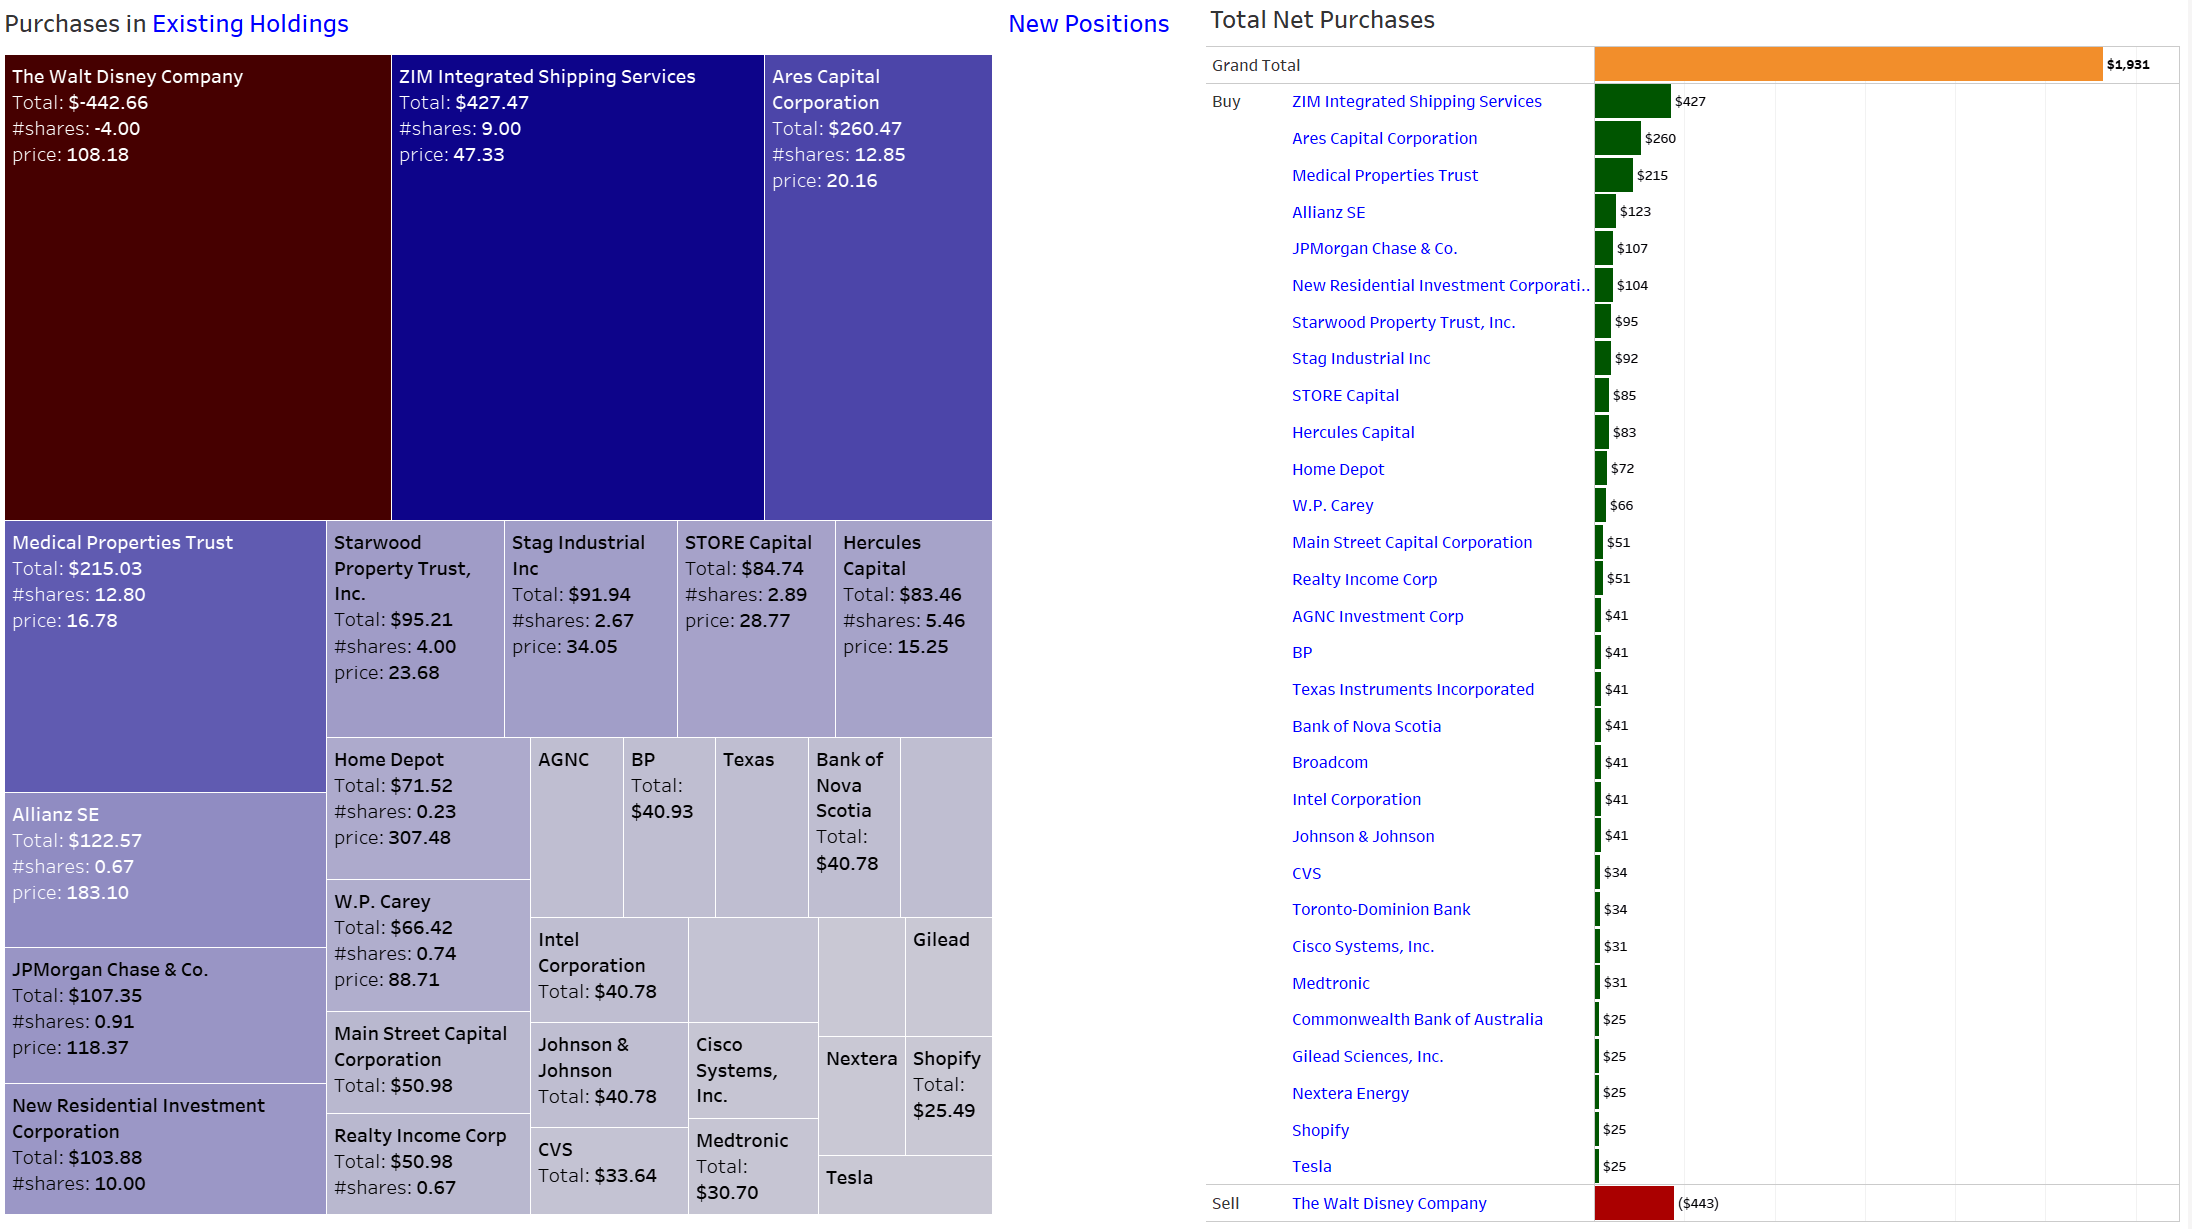
Net investment activity in August amounted to a very solid $1,900 following reduced buying in July. I continue to duck away from European stocks as the continent and my country, Germany in particular, are facing the worst energy and inflation crisis in my lifetime. Winter is coming, gas flows through Nord Stream 1 have been stopped indefinitely and in my opinion German politicians seemingly do everything not to ease the impact of that crisis. It is very frustrating to observe this and while I can consider myself to be very privileged in that situation with my portfolio and income, I am fully aware that certainly the latter is not guaranteed if things continue to deteriorate. The only thing certain is that something unexpected will happen over the course of the next 6 months but what exactly is anybody's guess albeit a standard recession could even be considered a good outcome.
In terms of investment activity the most notable change is undoubtedly the sale of Disney ( DIS ). It was a very small position which I sold mostly for ideological reasons as the woke direction Disney is taking is not something I can support. I love all the old Disney movies, characters and series. I grew up with Mickey Mouse, Ducktales, " Lustige Taschenbücher " and all the classic movies of Beauty and the Beast, Ariella, Aladdin, the Lion King and others but today's Disney has moved too far in a direction I cannot identify with.
I purchased a couple of speculative shares in ZIM Integrated Shipping Services ( ZIM ) as I believe in container shipping in the long-term despite all the supply bottlenecks and cyclicality out there. A recession is probably coming latest next year but the company is paying a strong dividend even though that will have to be cut in subsequent quarters as freight rates will likely come down. The current quarterly dividend of $4.75 is eye-watering but probably comes at the peak of the cycle. Even the $2.00 quarterly dividend of 2021 is more than enough to keep me patient as the company navigates through troubled economic waters as shipping rates are coming down hard. Stocks fluctuate which creates buying opportunities and I believe this is one, maybe too early but certainly much better than when the stock was twice the price not too long ago.
Apart from that all other purchases were triggered by the almost weekly savings plans.
Due to the nature of how the monthly investment plan process works, I am investing relatively equally into these stocks at two points of time during the month - at the beginning of the month and mid-month - which breaks down as shown below. Figures are in Euro and show that, for instance, at the beginning of the month, I am investing between 50 and 75 EUR each into Microsoft, The Home Depot (NYSE: HD ), Visa (NYSE: V ), W. P. Carey ( WPC ), and BP (NYSE: BP ). Mid-month, I am adding between 33 and 40 EUR each into STAG Industrial (NYSE: STAG ), AT&T ( T ), NextEra Energy (NYSE: NEE ), Toronto-Dominion Bank (NYSE: TD ), Main Street Capital (NYSE: MAIN ) and JPMorgan (NYSE: JPM ).
I have added several investment plans starting mid-September 2020 which include AGNC Investment Corp. (NASDAQ: AGNC ), Ares Capital (NASDAQ: ARCC ), Medical Properties Trust (NYSE: MPW ), The Bank of Nova Scotia (NYSE: BNS ) and The Trade Desk (NASDAQ: TTD ). Investments here will be focused on high-yield as well as high-growth stocks in the technology, therapeutic and renewables sectors.
All those purchases substantially raised my forward annual dividend income, breaking down as follows:
Added Dividend Income (Designed by author)
All net purchases in August can be found below:
August 2022 Net Purchases (Designed by author)
Dividend Income: What Happened on the Dividend Side?
Dividend income hit $345 which, adjusting for special effects, is up 3% Y/Y and up 2% on a sequential basis. It is the weakest month of the year so far in terms of dividend income as my investments are not geared towards balancing overall yearly dividend income. I haven't been adding to my top 2 dividend payers AbbVie ( ABBV ) and AT&T ( T ) in a long time as one is very richly valued and the other is not attractive right now to me.
Starting a couple of months ago I have started savings plans featuring some of the stocks paying in August like NextEra Energy Partners ( NEP ) or Hercules Capital ( HTGC ) and I expect them to generate sizable dividend income in the months and years to come. The near-term goal is thus to get above $400 in November.
August 2022 Net Dividends (Designed by author)
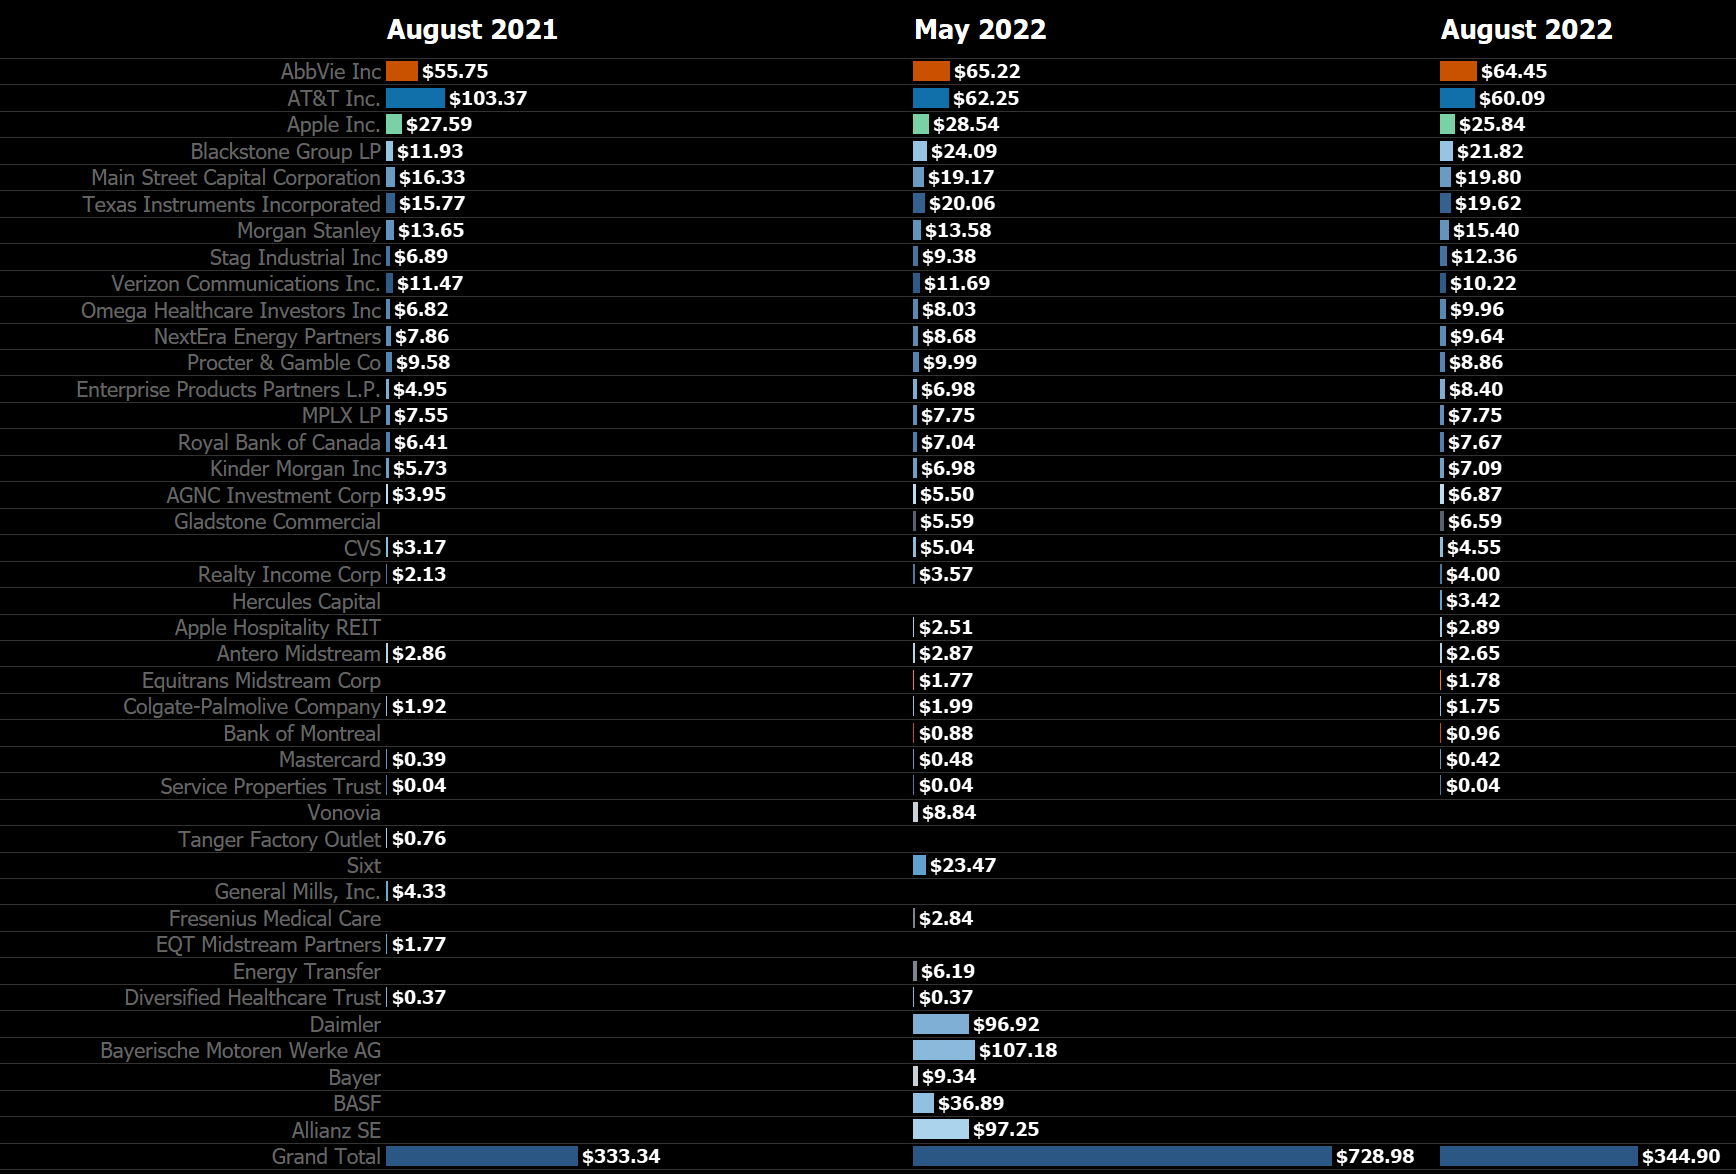
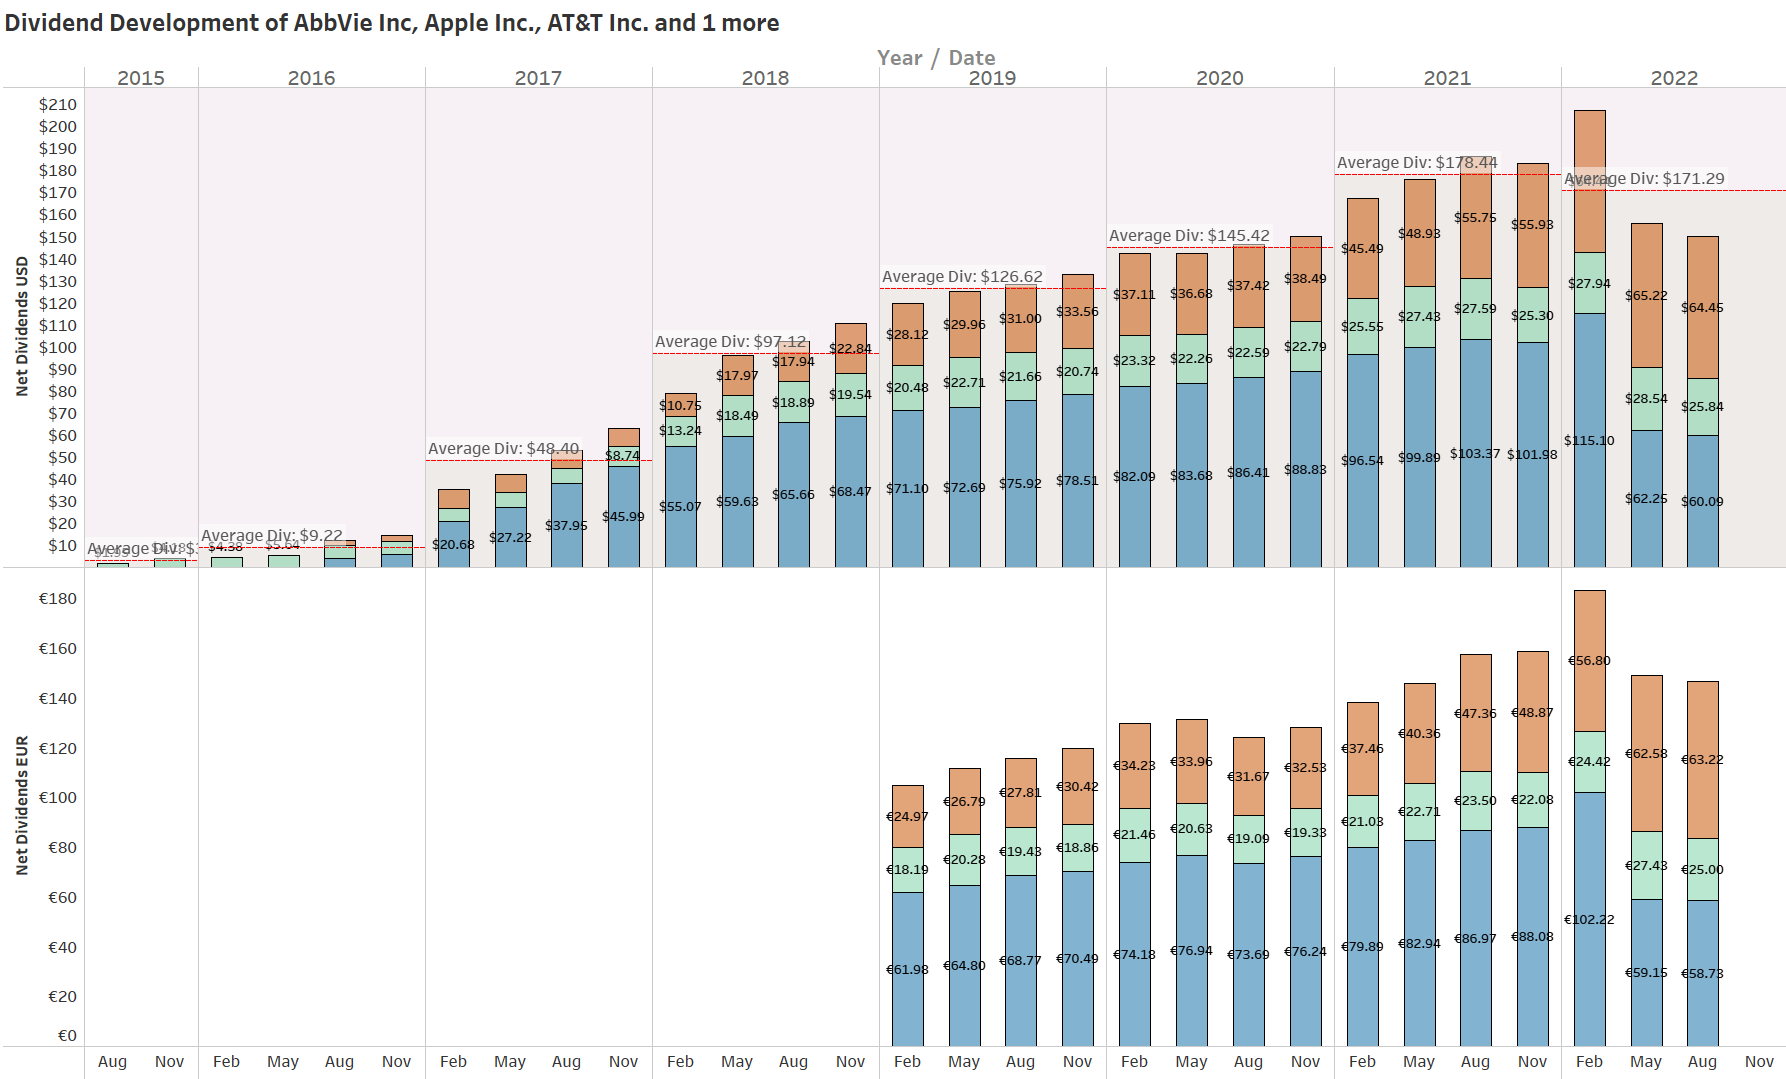
Looking at the top three dividend payers in August, dividend income developed as follows:
Top 3 Dividend Payers (Designed by author)
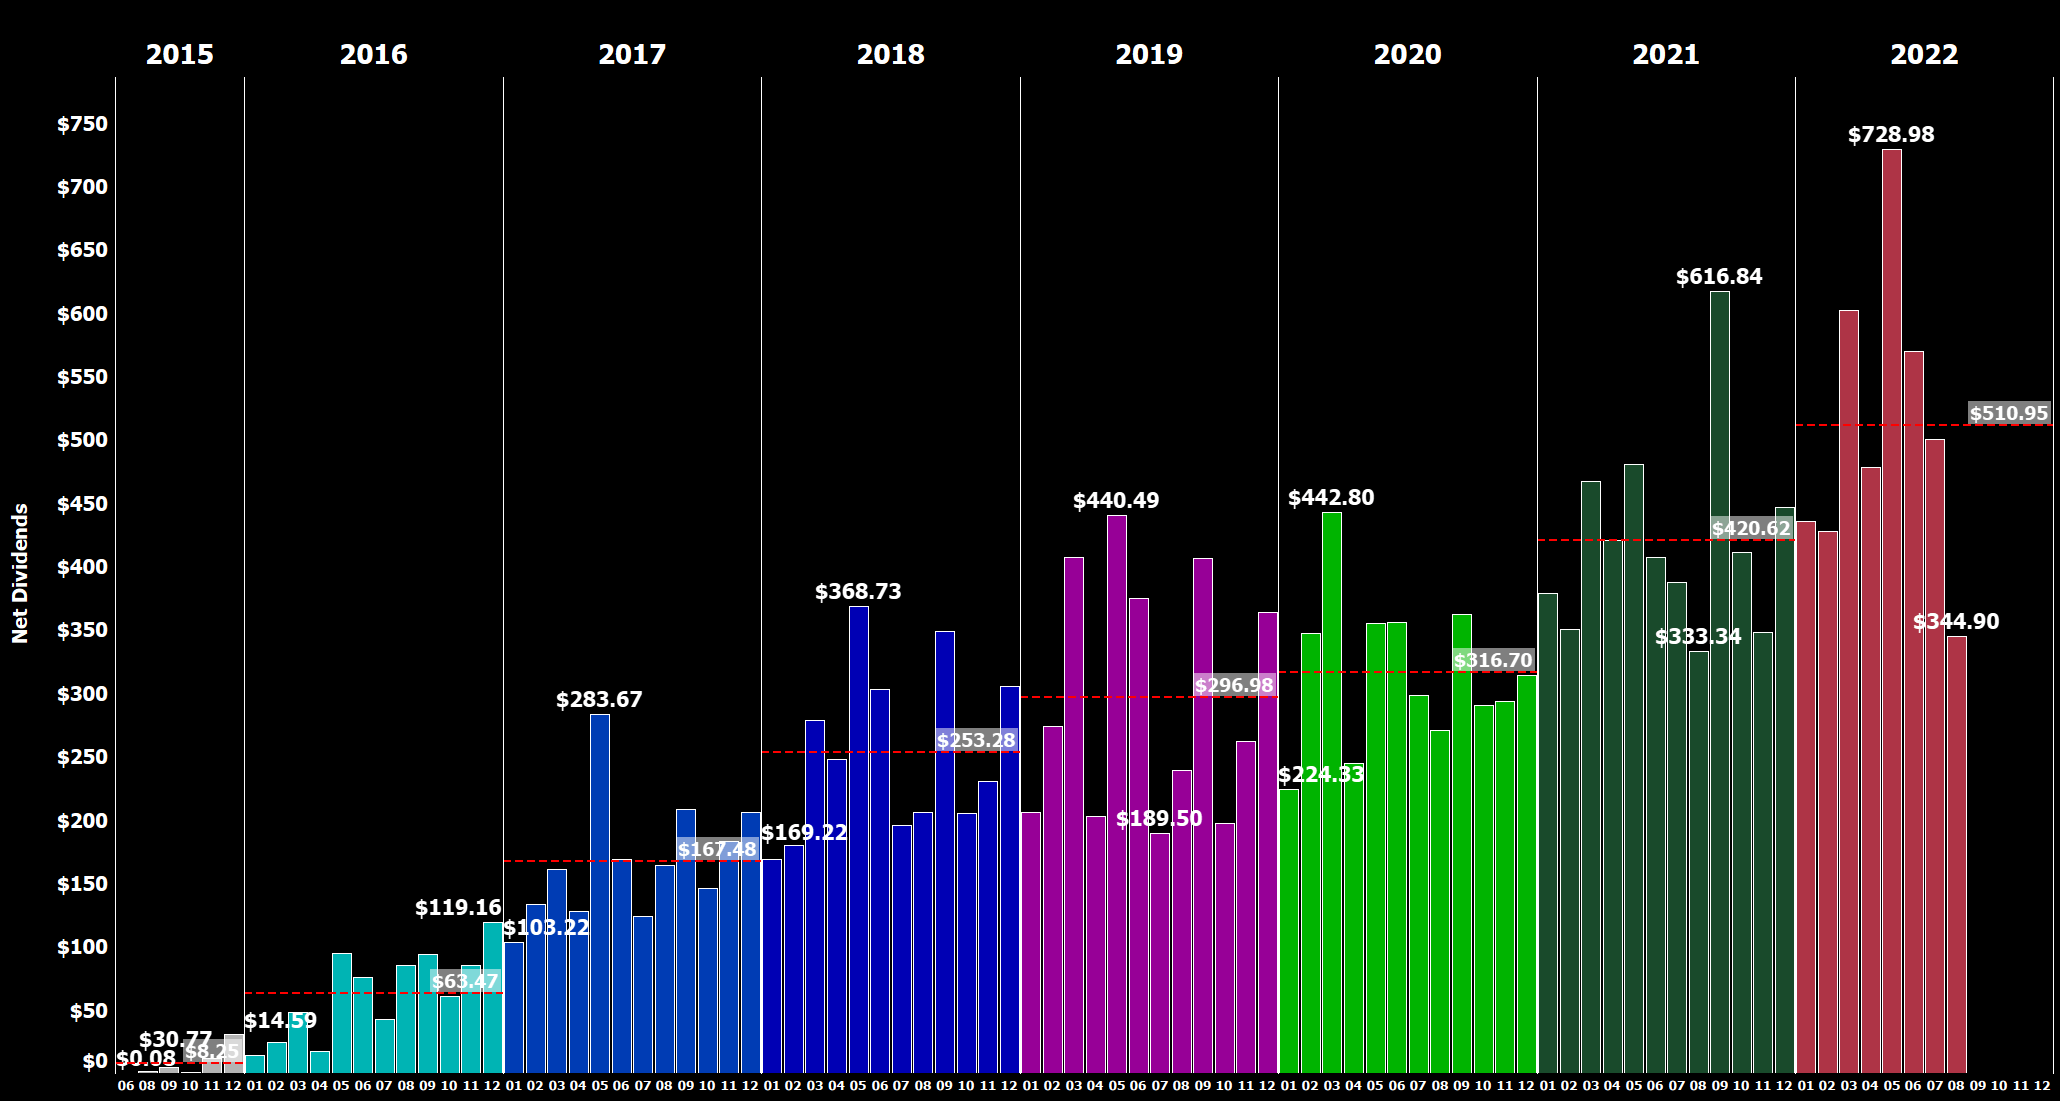
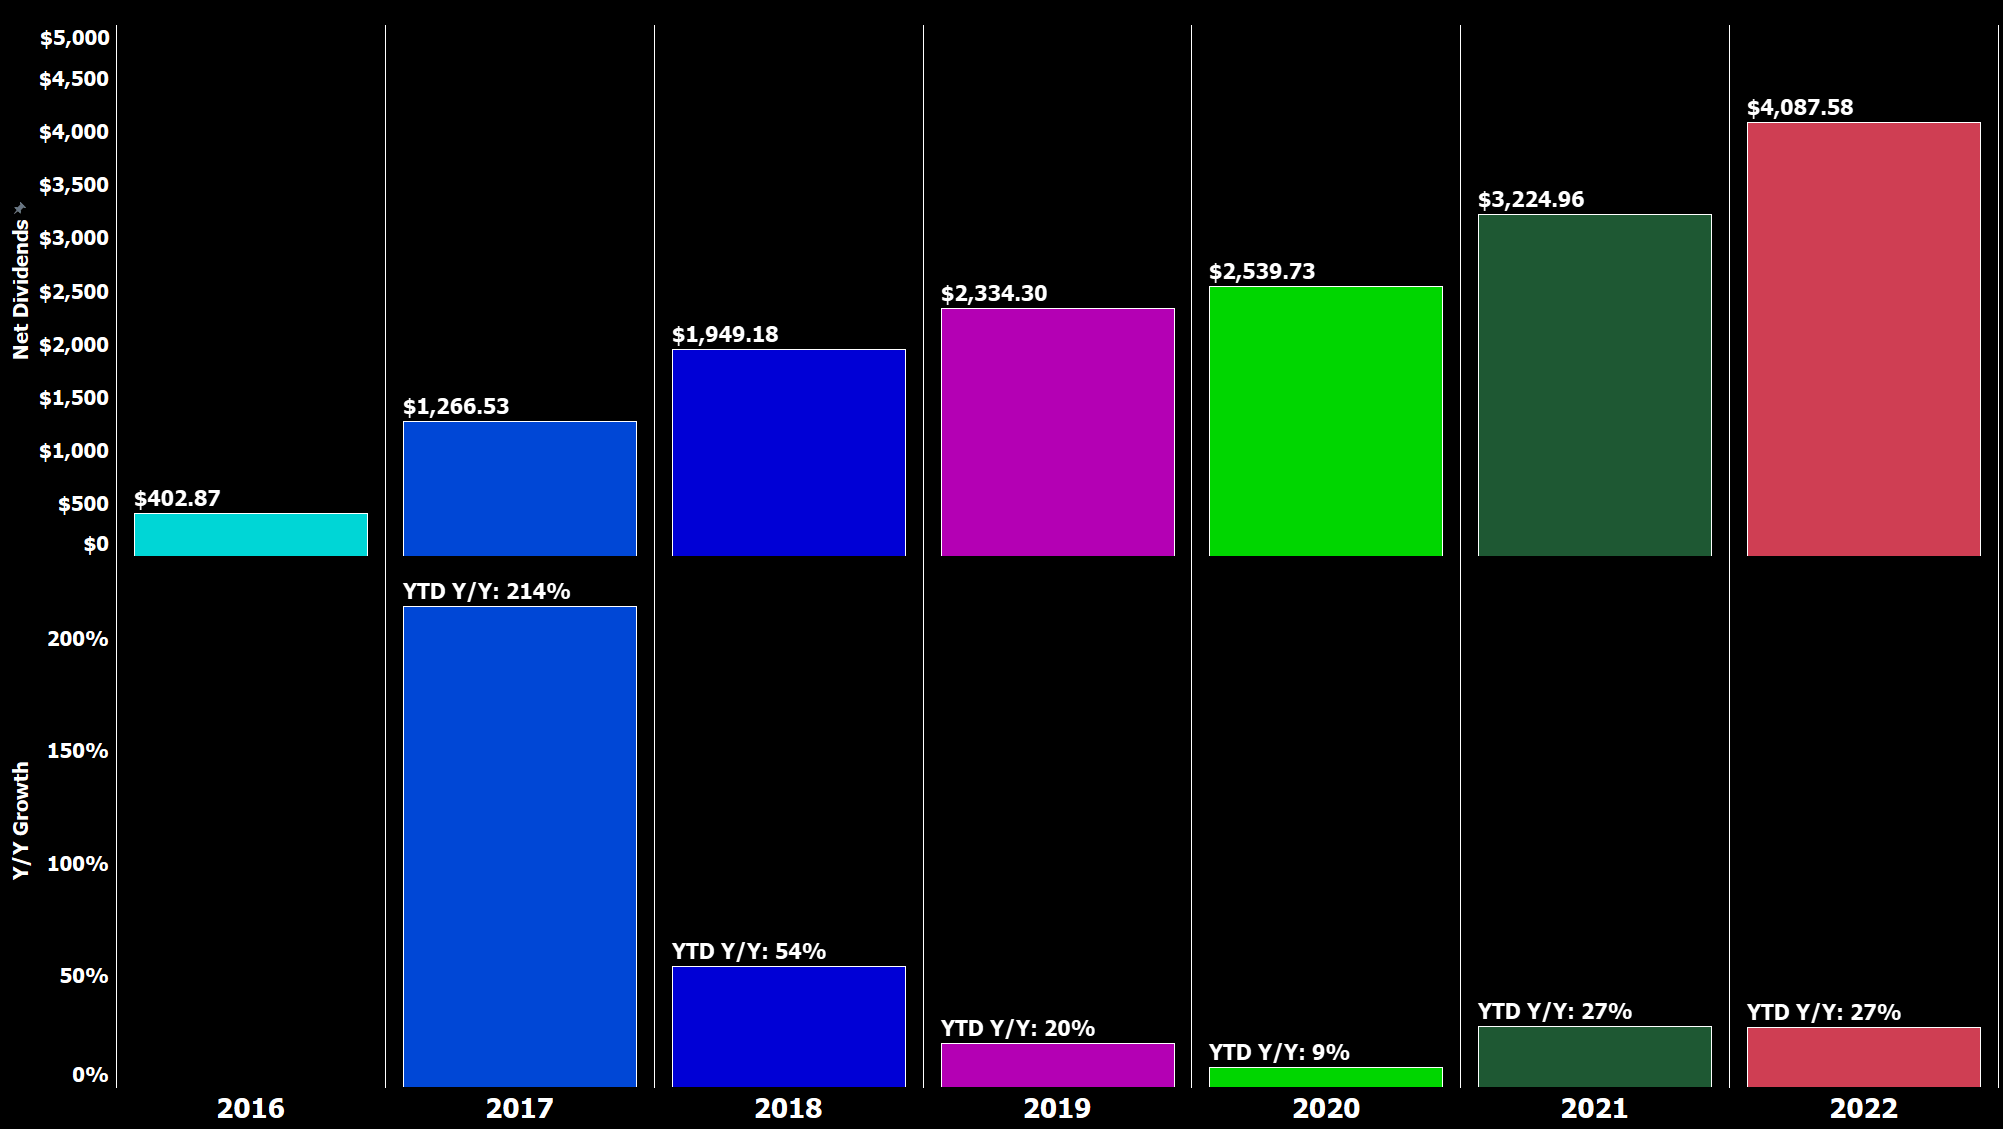
Here is a look at my favorite chart: the net dividend income development by month over time between 2015 and 2022, where you can easily see the development of my dividend income as well as the average annual dividend in a given year:
All-time Dividend Development (Designed by author)
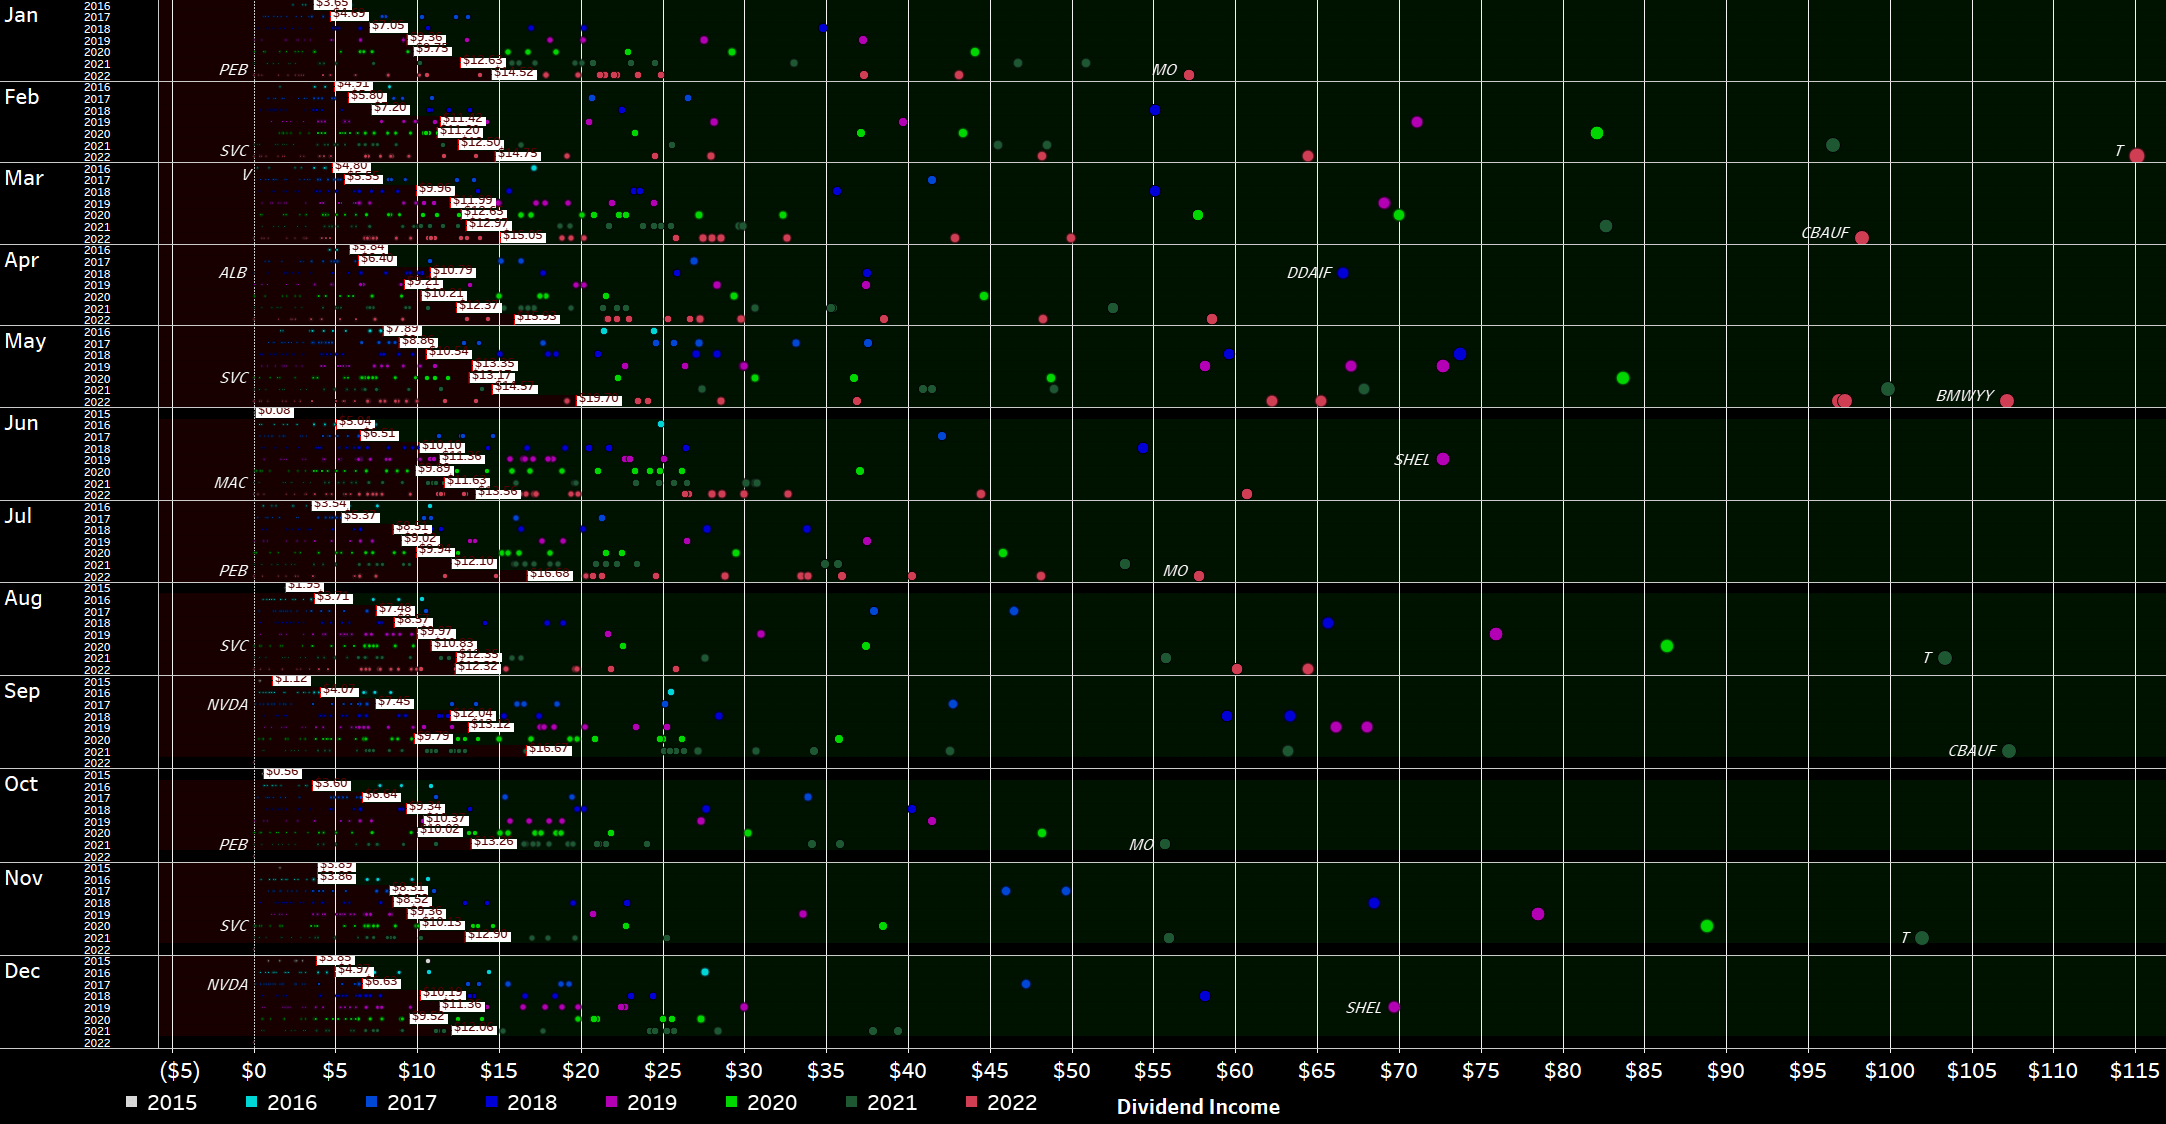
Next, I have scattered all the individual dividend payments I have ever received and colored them by year, rearranging the years side by side rather than horizontally as in previous updates:
Dividend Bubbles (Designed by author)
This view looks very cluttered at first, but it is very rich in information. It shows every single dividend payment I have received since I started my journey in 2015 in the shape of a circle colored differently by year and size, based upon their contribution. The view is broken down by month and by year (not by year and by month), and thus allows to better see the development over time. For every year of a certain month, a white rectangle indicates the average monthly dividend. The area where dividends fall below that average is filled dark red, whereas the area above is colored dark green. Personally, I absolutely love this redesigned view of my old "bubbles chart," as it is much clearer to identify developments and trends in my dividend income.
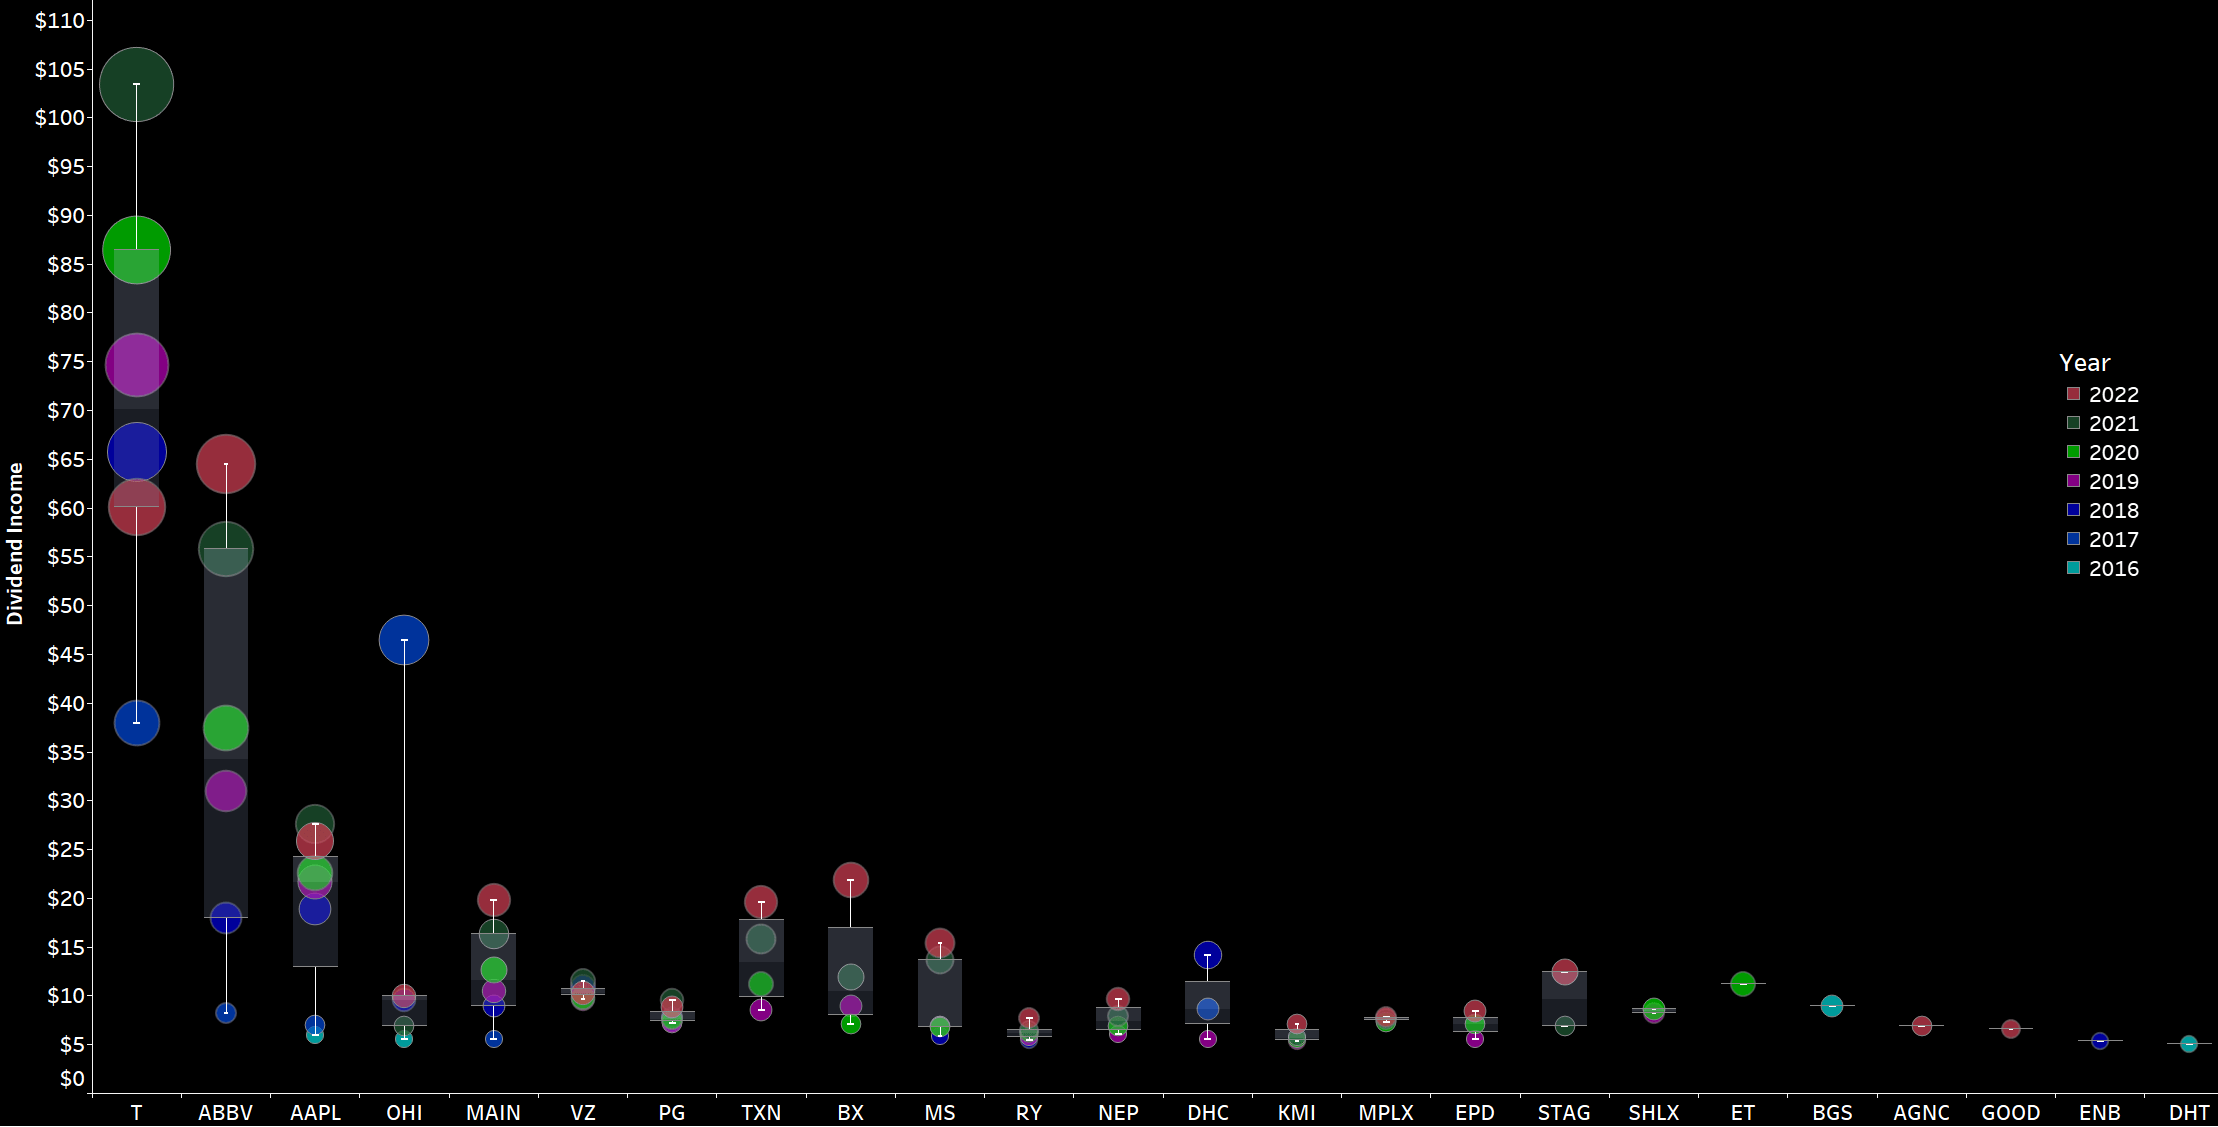
August 2022 Dividends (Designed by author)
Now, zooming in on August , we can immediately see a number of big green circles in a sea of black. The bigger the circle and the bigger the distance to the previous circle for the same stock, the bigger is the change in dividend income compared to the prior years.
It is clearly visible that my dividend income is still suffering from the massive dividend cut of AT&T which marked the end of an era for that widows-and-orphans stock. We can see that for my stocks the red circle is at the top of the individual scale which obviously marks maximum dividend income but it will take time for these payments to grow.
Finally, we can also see that the once sizable position I held in Omega Healthcare Investors (OHI) which produced tremendous dividend income in 2018 was sold off the next year and is now slowly starting to grow again. It was a mistake selling the stock back then and so I am piling back into it but at a measured pace.
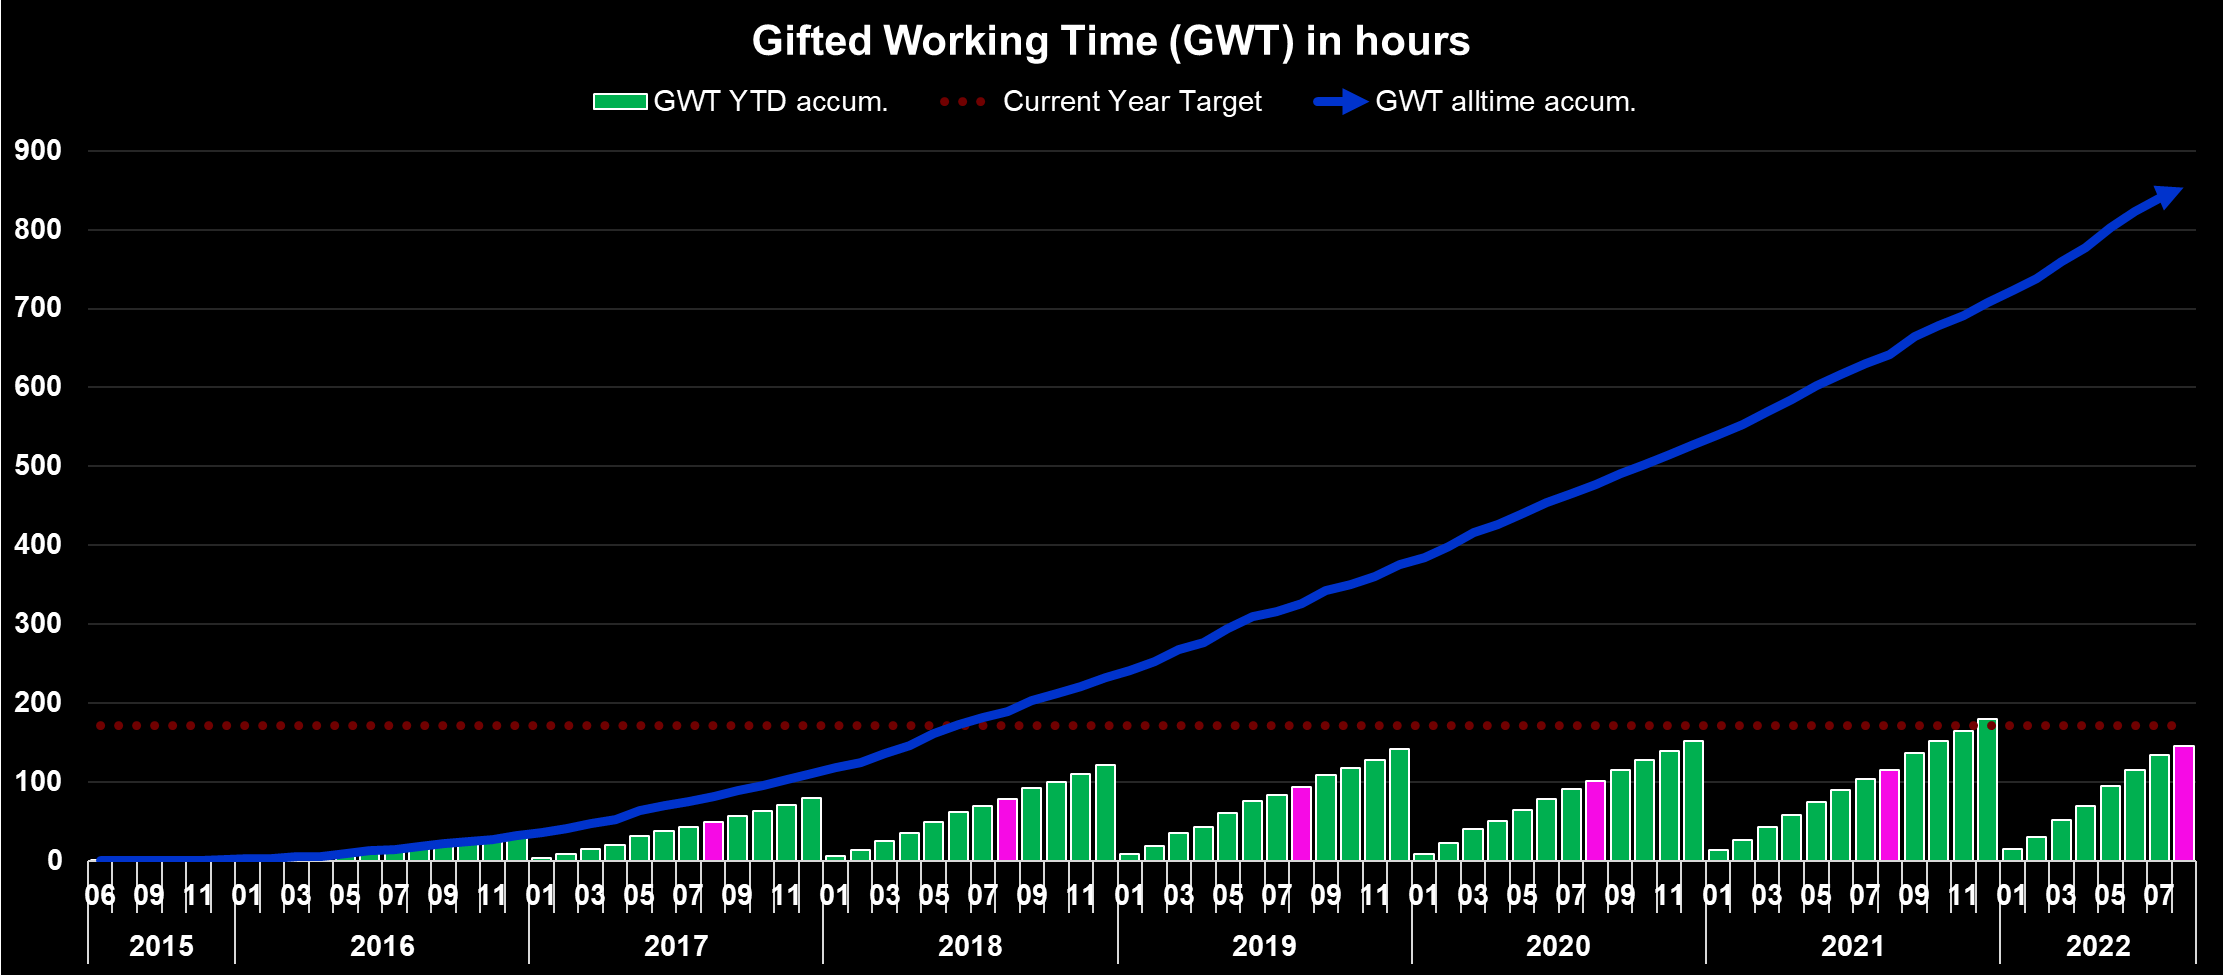
Another way to express the monthly dividend income is in terms of Gifted Working Time ((GWT)).
I am assuming an average hourly rate of $30.8 for 2022 here:
- In 2018, I generated 121 hours in GWT, equaling slightly more than $3,000 in annual net dividends.
- In 2019, I generated 142 hours in GWT, equaling almost $3,600 in annual net dividends.
- In 2020, I generated 152 hours in GWT, equaling roughly $3,800 in annual net dividends.
- In 2021, I generated 180 hours in GWT, equaling roughly $5,050 in annual net dividends.
- In 2022, I am targeting to reach at least $5,500 in annual net dividends, which equals roughly 179 hours in GWT. Despite the projected increase in annual net dividends I expect overall GWT to decrease following higher calculated hourly rates, a figure I project to rise by 10% given soaring inflation. The annual target of $5,500 is on the very cautious side as I need more visibility into how the year is progressing, particularly as I expect ongoing monthly investments to decline given elevated stock levels and rising inflationary and geopolitical pressures.
Across the years, the YTD Dividend Race as I like to call it looks as follows. While 2020 was fairly disappointing, 2021 was phenomenal as it benefited from a rather low baseline from the prior year. For 2022, I am targeting a conservative high single-digit growth rate for now, which is a very cautious estimate to begin with. YTD growth based on the first 8 months is still shattering my expectations coming in at 27% Y/Y, and while I expect some moderation over the course of the year, solid double-digit growth in annual dividend income is almost guaranteed already for this year. At this stage it becomes more and more likely that not only will I easily meet my initial goal of $5,500 in net dividend income but in fact exceed the $6,000 milestone comfortably. That would equate to at least $500 in net dividends per month which is a big number for me and more than enough to for instance pay all the utility bills which are soaring due to the war in Ukraine and its repercussions.
YTD Dividend Growth (Designed by author)
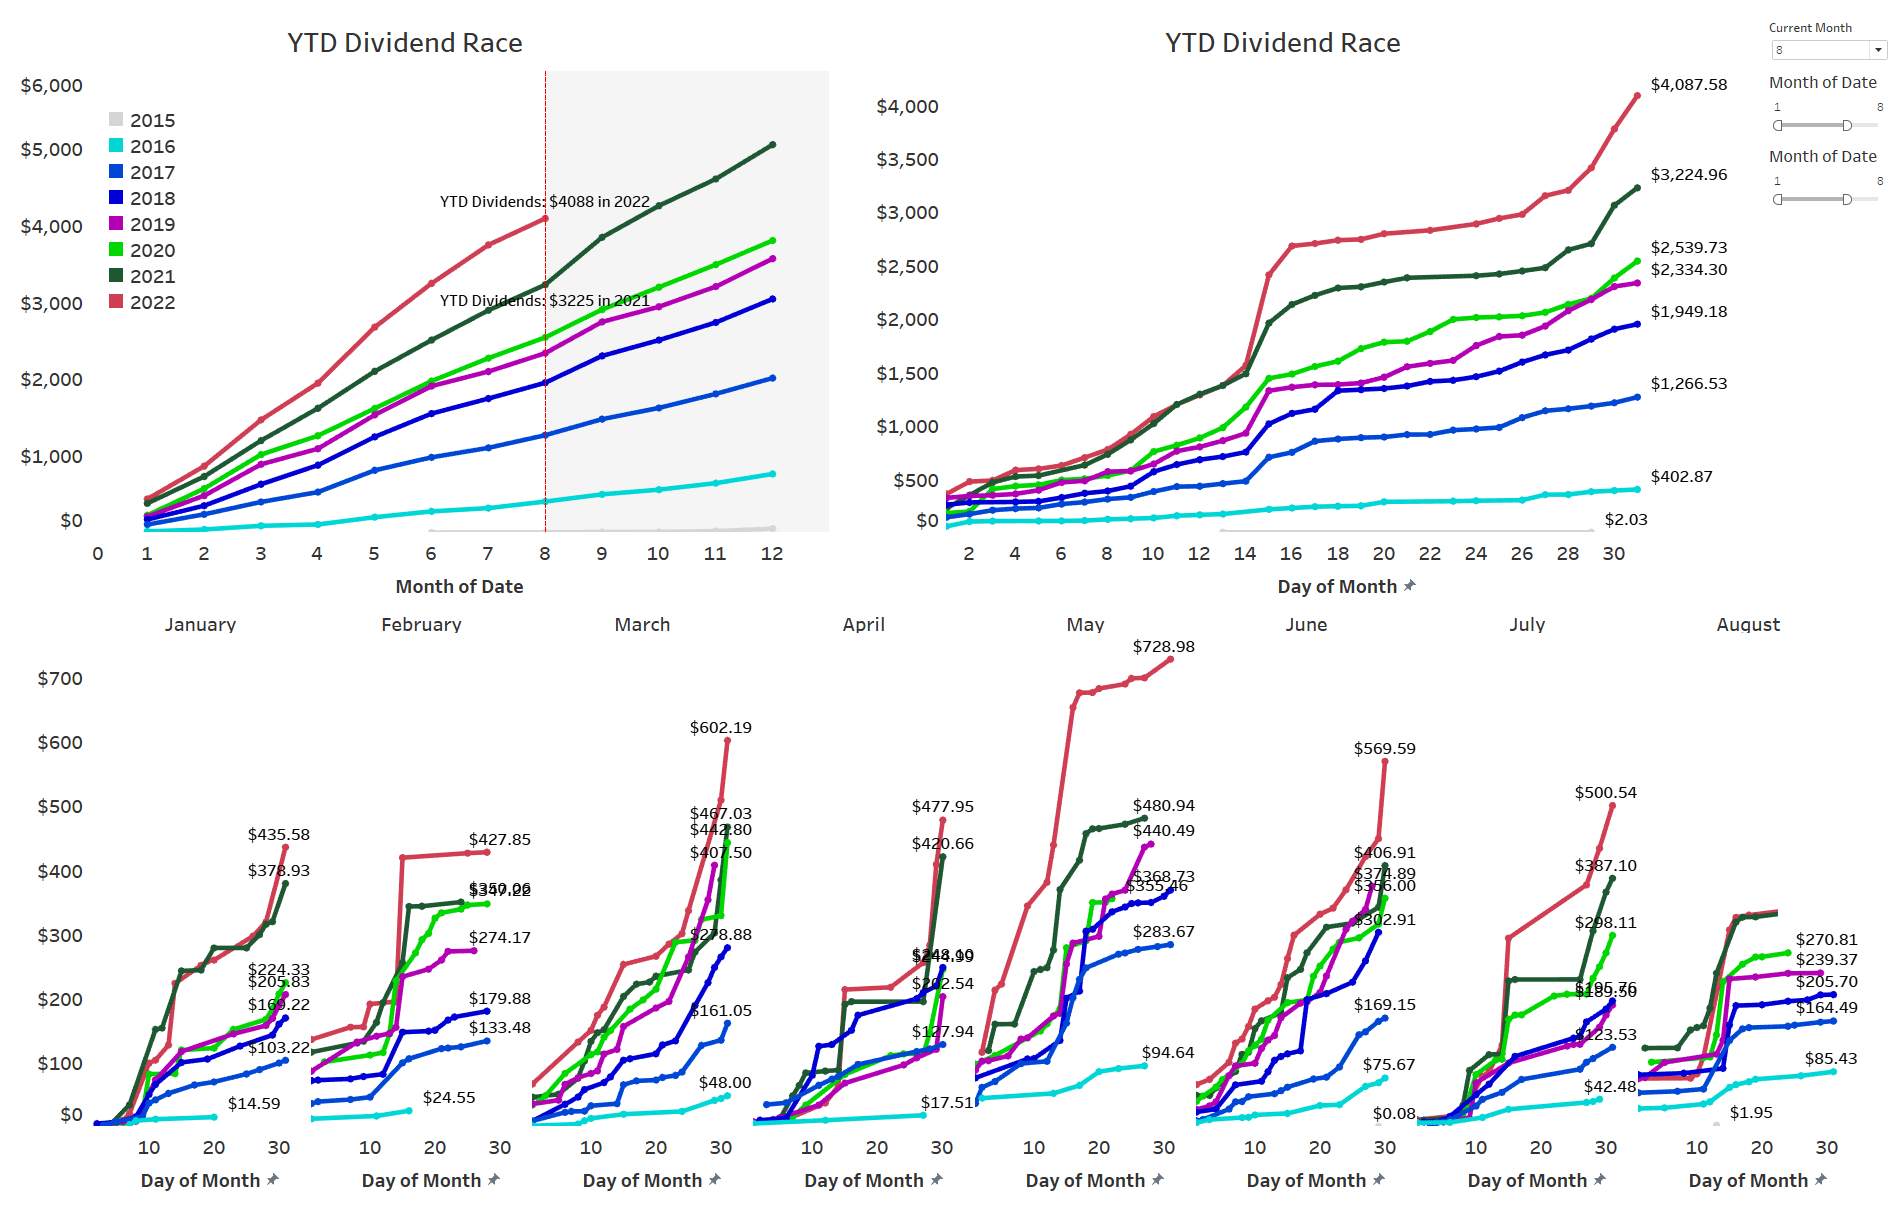
I have modified the YTD Dividend Race chart. Top left shows the YTD Dividend Race in the old format. At the top right, we can see how YTD dividend income developed on a daily basis and whereby we can easily identify that most of my dividend income is generated mid-month and towards the end of the month. At the bottom, that development is broken down by every individual month for the current year which makes big jumps clearly identifiable.
YTD Dividend Race (Designed by author)
Expressed in GWT, it presents itself as follows:
Gifted Working Time in Hours (Designed by author)
What this shows is as follows:
- All time (blue area) - Around 853 hours, or 106.7 days, of active work have been replaced with passive income since the start of my dividend journey. Assuming a five-day workweek this translates into more than 21 weeks of vacation funded via dividends.
- YTD (green bars) - Around 146 hours, or 18.2 days, of active work have been replaced with passive income in 2022 already, which equals more than 3 weeks' worth of active work funded via dividends.
- Highlighted in pink is the accumulated YTD total at the end of the current reporting month ( August ).
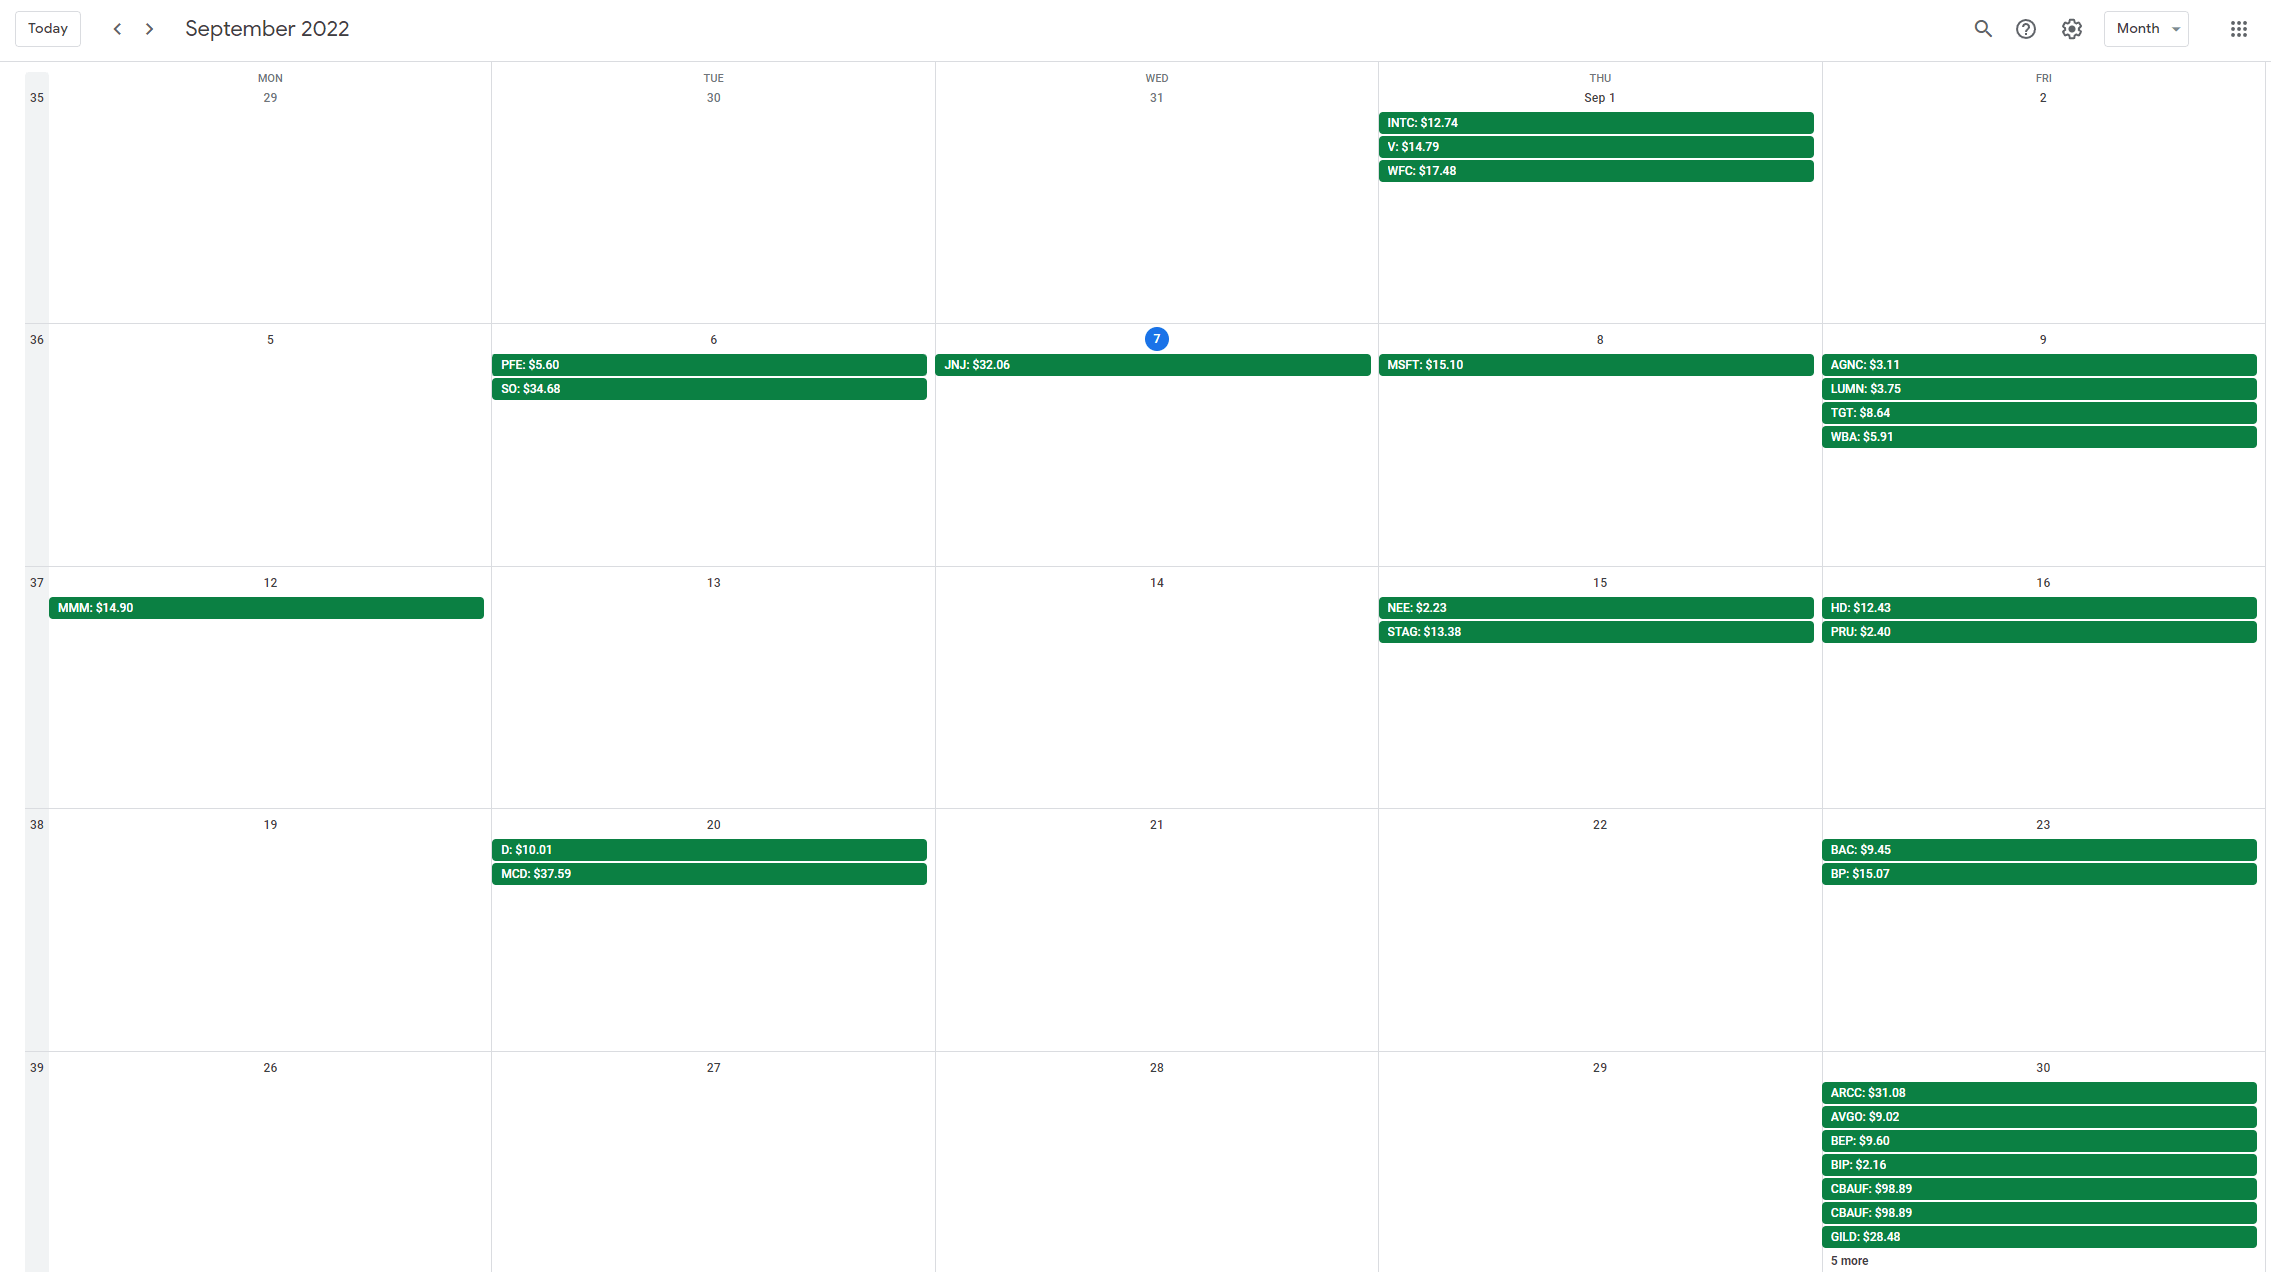
Upcoming September Dividends
With September marking the end of the quarter, this will traditionally be a strong month in terms of dividend income. Among others, further big dividend payers from my portfolio in March are Royal Dutch Shell ( SHEL ), BP ( BP ), McDonald's (NYSE: MCD ), Johnson & Johnson (NYSE: JNJ ), Southern Company (NYSE: SO ) and Ares Capital Corporation ( ARCC ) of which 4 companies are part of my regular monthly savings plans. On top of that I am looking forward to the big semi-annual dividend payment from the Commonwealth Bank of Australia ( CBAUF ).
Many of those are part of my monthly savings plans and thus there should be some solid growth in dividend income despite the heavy dividend cuts from Shell, BP and Wells Fargo although all three of them have already reverted back to growing their dividend, especially Wells Fargo which simply doubled its dividend.
The snapshot below is taken from my newly and free-for-all released Dividend Calendar (make sure to follow instructions in the video) and shows my expected dividend payments in September.
My Dividend Calendar (Designed by Author)
At the end of August, my dividend portfolio is composed as follows:
| Company Name |
| Ticker |
| % Market Value |
| Market Value (€) |
| Apple Inc. |
| ( AAPL ) |
| 12.11% |
| 23,168 |
| Visa Inc |
| ( V ) |
| 4.22% |
| 8,072 |
| AbbVie Inc |
| ( ABBV ) |
| 3.81% |
| 7,297 |
| McDonald's Corp |
| ( MCD ) |
| 3.70% |
| 7,078 |
| Microsoft Corporation |
| ( MSFT ) |
| 3.47% |
| 6,635 |
| Cisco Systems, Inc. |
| ( CSCO ) |
| 2.82% |
| 5,395 |
| Johnson & Johnson |
| ( JNJ ) |
| 2.65% |
| 5,079 |
| Commonwealth Bank of Australia |
| ( CBAUF ) |
| 2.63% |
| 5,031 |
| W. P. Carey |
| ( WPC ) |
| 2.54% |
| 4,852 |
| AT&T Inc. |
| ( T ) |
| 2.35% |
| 4,489 |
| Main Street Capital Corporation |
| ( MAIN ) |
| 2.27% |
| 4,338 |
| Shell |
| ( SHEL ) |
| 2.12% |
| 4,065 |
| Southern Co |
| ( SO ) |
| 2.09% |
| 3,990 |
| Stag Industrial Inc |
| ( STAG ) |
| 1.89% |
| 3,625 |
| Texas Instruments Incorporated |
| ( TXN ) |
| 1.81% |
| 3,457 |
| Ares Capital Corporation |
| ( ARCC ) |
| 1.79% |
| 3,424 |
| Altria Group Inc |
| ( MO ) |
| 1.77% |
| 3,390 |
| Wells Fargo & Co |
| ( WFC ) |
| 1.76% |
| 3,373 |
| Home Depot |
| ( HD ) |
| 1.68% |
| 3,223 |
| Toronto-Dominion Bank |
| ( TD ) |
| 1.68% |
| 3,217 |
| JPMorgan Chase & Co. |
| ( JPM ) |
| 1.68% |
| 3,212 |
| Gilead Sciences, Inc. |
| ( GILD ) |
| 1.49% |
| 2,856 |
| Store Capital |
| ( STOR ) |
| 1.49% |
| 2,850 |
| Medical Properties Trust |
| ( MPW ) |
| 1.48% |
| 2,823 |
| Bank of Nova Scotia |
| ( BNS ) |
| 1.42% |
| 2,725 |
| Siemens Healthineers |
| ( SEMHF ) |
| 1.25% |
| 2,400 |
| NVIDIA Corporation |
| ( NVDA ) |
| 1.19% |
| 2,284 |
| Allianz SE |
| ( ALIZF ) |
| 1.14% |
| 2,189 |
| PepsiCo, Inc. |
| ( PEP ) |
| 1.05% |
| 2,001 |
| Morgan Stanley |
| ( MS ) |
| 1.04% |
| 1,997 |
| Blackstone Group LP |
| ( BX ) |
| 0.99% |
| 1,885 |
| Procter & Gamble Co |
| ( PG ) |
| 0.93% |
| 1,782 |
| Intel Corporation |
| ( INTC ) |
| 0.88% |
| 1,685 |
| BMW |
| ( BMWYY ) |
| 0.88% |
| 1,679 |
| Brookfield Renewable Partners |
| ( BEP ) |
| 0.88% |
| 1,676 |
| Broadcom Inc |
| ( AVGO ) |
| 0.87% |
| 1,672 |
| Philip Morris International Inc. |
| ( PM ) |
| 0.86% |
| 1,654 |
| Enbridge |
| ( ENB ) |
| 0.82% |
| 1,571 |
| New Residential Corporation |
| (NRZ) |
| 0.82% |
| 1,565 |
| Bank of America Corp |
| ( BAC ) |
| 0.79% |
| 1,511 |
| Honeywell International Inc. |
| ( HON ) |
| 0.78% |
| 1,502 |
| BP1 |
| ( BP ) |
| 0.75% |
| 1,435 |
| BP2 |
| ( BP ) |
| 0.71% |
| 1,358 |
| Target Corporation |
| ( TGT ) |
| 0.69% |
| 1,323 |
| Dominion Energy Inc |
| ( D ) |
| 0.64% |
| 1,233 |
| 3M Co |
| ( MMM ) |
| 0.64% |
| 1,222 |
| The Coca-Cola Co |
| ( KO ) |
| 0.64% |
| 1,218 |
| Realty Income Corp |
| ( O ) |
| 0.62% |
| 1,194 |
| Starwood Property Trust, Inc. |
| ( STWD ) |
| 0.60% |
| 1,150 |
| NextEra Energy Partners LP |
| ( NEP ) |
| 0.60% |
| 1,144 |
| Daimler |
| (DDAIF) |
| 0.60% |
| 1,140 |
| CVS Health Corp |
| ( CVS ) |
| 0.55% |
| 1,044 |
| Gladstone Commercial Corporation |
| ( GOOD ) |
| 0.54% |
| 1,032 |
| B&G Foods, Inc. |
| ( BGS ) |
| 0.52% |
| 989 |
| Unilever NV ADR |
| ( UL ) |
| 0.52% |
| 986 |
| Royal Bank of Canada |
| ( RY ) |
| 0.49% |
| 941 |
| Apple Hospitality REIT |
| ( APLE ) |
| 0.49% |
| 930 |
| Verizon Communications Inc. |
| ( VZ ) |
| 0.47% |
| 895 |
| Stryker |
| ( SYK ) |
| 0.42% |
| 799 |
| Canadian Imperial Bank of Commerce |
| ( CM ) |
| 0.39% |
| 756 |
| AGNC Investment Corporation |
| ( AGNC ) |
| 0.39% |
| 739 |
| NextEra Energy |
| ( NEE ) |
| 0.38% |
| 731 |
| Medtronic |
| ( MDT ) |
| 0.37% |
| 711 |
| Sino AG |
| (XTP.F) |
| 0.36% |
| 690 |
| Walgreens Boots Alliance Inc |
| ( WBA ) |
| 0.35% |
| 662 |
| Pfizer Inc. |
| ( PFE ) |
| 0.34% |
| 643 |
| BASF |
| ( BASFY ) |
| 0.31% |
| 584 |
| Exxon Mobil Corporation |
| ( XOM ) |
| 0.30% |
| 567 |
| Antero Midstream Corporation |
| ( AM ) |
| 0.29% |
| 550 |
| Kinder Morgan Inc |
| ( KMI ) |
| 0.29% |
| 549 |
| General Electric Company |
| ( GE ) |
| 0.27% |
| 509 |
| Alibaba Group Holding Ltd |
| ( BABA ) |
| 0.24% |
| 461 |
| Annaly Capital Management |
| ( NLY ) |
| 0.23% |
| 442 |
| BRT Realty Trust |
| ( BRT ) |
| 0.21% |
| 397 |
| Enterprise Products Partners L.P. |
| ( EPD ) |
| 0.21% |
| 396 |
| Colgate-Palmolive Company |
| ( CL ) |
| 0.21% |
| 393 |
| Omega Healthcare Investors Inc |
| ( OHI ) |
| 0.20% |
| 389 |
| Sixt |
| ( SXTSY ) |
| 0.19% |
| 366 |
| Energy Transfer Partners |
| ( ET ) |
| 0.19% |
| 366 |
| MPLX LP |
| ( MPLX ) |
| 0.19% |
| 360 |
| Mastercard |
| ( MA ) |
| 0.18% |
| 342 |
| Bayer AG |
| ( BAYZF ) |
| 0.16% |
| 307 |
| ZIM Integrated Shipping Services |
| ( ZIM ) |
| 0.15% |
| 283 |
| Brookfield Infrastructure Partners L.P. |
| ( BIP ) |
| 0.13% |
| 248 |
| Apollo Investment |
| ( MFIC ) |
| 0.13% |
| 246 |
| Apollo Commercial Real Est. Finance Inc |
| ( ARI ) |
| 0.12% |
| 238 |
| Prudential Financial |
| ( PRU ) |
| 0.10% |
| 191 |
| Uniti Group Inc |
| ( UNIT ) |
| 0.10% |
| 186 |
| Vonovia |
| ( VONOY ) |
| 0.09% |
| 170 |
| Lumen Technologies |
| ( LUMN ) |
| 0.08% |
| 148 |
| Fresenius SE |
| ( FSNUF ) |
| 0.07% |
| 140 |
| Equitrans Midstream Corporation |
| ( ETRN ) |
| 0.07% |
| 129 |
| Boeing |
| ( BA ) |
| 0.06% |
| 112 |
| Walt Disney Co |
| ( DIS ) |
| 0.06% |
| 112 |
| Newtek Business Services |
| ( NEWT ) |
| 0.06% |
| 105 |
| Bank of Montreal |
| ( BMO ) |
| 0.05% |
| 93 |
| Hercules Capital |
| ( HTGC ) |
| 0.04% |
| 74 |
| Fresenius Medical Care |
| ( FMS ) |
| 0.04% |
| 67 |
| Diversified Healthcare Trust |
| ( DHC ) |
| 0.03% |
| 62 |
| The GEO Group Inc |
| ( GEO ) |
| 0.03% |
| 58 |
| Service Properties Trust |
| ( SVC ) |
| 0.02% |
| 34 |
For further details see:
My Dividend Stock Portfolio: August 2022 Update - 102 Holdings With 30 Buys And 1 Sale